SQL Server
A family of Microsoft relational database management and analysis systems for e-commerce, line-of-business, and data warehousing solutions.
12,654 questions
This browser is no longer supported.
Upgrade to Microsoft Edge to take advantage of the latest features, security updates, and technical support.
' cx='32' cy='32' r='32' /%3E%3Ctext x='50%25' y='55%25' dominant-baseline='middle' text-anchor='middle' fill='%23FFF' %3EAB%3C/text%3E%3C/svg%3E)
I have a sql server 2017 config:
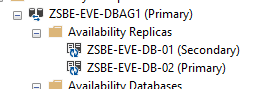
Master node zsbe-eve-db-02 is using log shipping (every minute) to send deltas to zsbe-rui-db-01.
Log shipping works: Inserting a table row in db in zsbe-eve-db-02, and after 1 minute the row can be selected on zsbe-rui-db-01.
Problem: In SQL server log of zsbe-eve-db-02, we get these 2 errors every minute:
Seems that zsbe-eve-db-02 thinks it holds secondary database (although it is master). ZSBE-EVE-DB-02 is primary and read write:
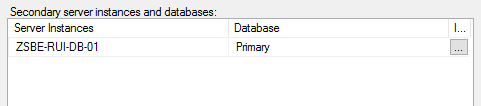
In log shipping config screen of zsbe-eve-db-02 only remote node zsbe-rui-db-01 node appears:
Can someone explain me where sql server configured a kind of log shipping from a node to himself? Transaction log shipping report is weird:
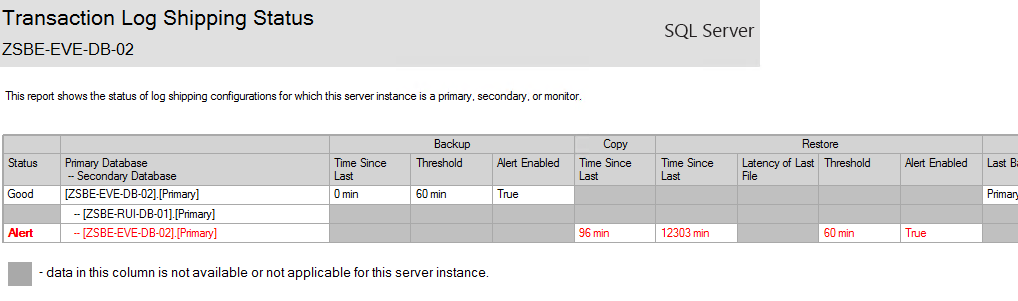
report No information appears on zsbe-rui-db-01.
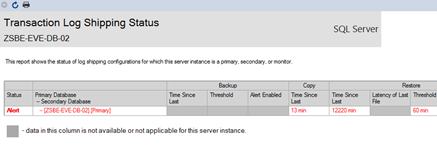
We dropped the whole log-shipping config, all related jobs and alerts, on all servers, and these error messages are still there. The log shipping report still shows only the line in red (alert) and we don't know how to clear it:
Any hint?
Thanks.
' cx='32' cy='32' r='32' /%3E%3Ctext x='50%25' y='55%25' dominant-baseline='middle' text-anchor='middle' fill='%23FFF' %3ESK%3C/text%3E%3C/svg%3E)
It seems logshipping was not completely removed and thus you are still seeing these alerts.
Run this on primary server, this removes the entry for a secondary database on the primary server (source) :
sp_delete_log_shipping_primary_secondary
    [ @primary_database = ] 'primary_database name here',
    [ @secondary_server = ] 'secondary_server name here',
    [ @secondary_database = ] 'secondary_database name here'
Run this on primary server, this stored procedure removes log shipping of primary database including backup job as well as local and remote history. Only use this stored procedure after you have removed the secondary databases using sp_delete_log_shipping_primary_secondary. (source):
sp_delete_log_shipping_primary_database
[ @database = ] 'database name here'
Run this on secondary server, this stored procedure removes a secondary database and removes the local history and remote history.(source):
sp_delete_log_shipping_secondary_database
[ @secondary_database = ] 'secondary_database name here'
Note: If you are sure the logshipping was completely removed earlier like you said in your question, run below stored procedure to remove the alert agent job as there are no primary or secondary logshipped database to monitor.
Removes an alert job from the log shipping monitor server if the job exists and there are no more primary or secondary databases to be monitored.(source):
sp_delete_log_shipping_alert_job

Hi @Alain Bourgeois ,
Did the issue always existed? Or it existed after SQL AG failed over?
Did you follow the steps from ShivamKumar to remove the log shipping configuration? If you configured log shipping with SQL AG, you need to remove the log shipping configuration on both AG primary and secondary replicas.
In addition, if you want to configure log shipping with SQL AG, please follow the steps from below blogs.
Step by Step Configuring AlwaysOn with Log Shipping
Microsoft SQL Server log shipping on existing AlwaysOn databases
If the answer is helpful, please click "Accept Answer" and kindly upvote it. If you have extra questions about this answer, please click "Comment".
@Shivam Kumar
Thanks, no alert anymore.
Problem: now it doesn't resync at all: rows inserted on primary don't come on standby.
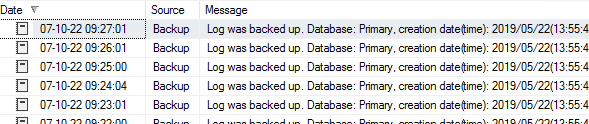
Standby log
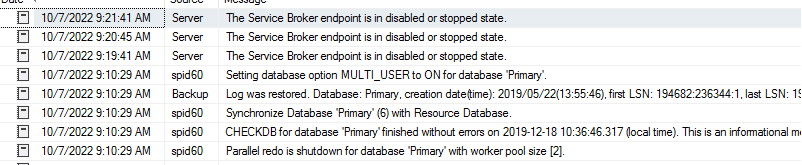
Primary log:
How can I resync without restoring a full backup?
You need to check the status of your always on , right click on AG's and see dashboard and check if they are in sync and synchornizing or not.
See for pending redo log queue and send queue.
Right click on databases under AG > databases folder > Click on resume if data movement is suspended.
As transactions movement from primary to secondaries depends on AG now not logshipping.
log shipping is not done through AG.
Transaction logs are present on primary but not shipped to standby.
I just had to wait (a lot).
Then to go to primary, tasks, ship transaction logs.
Seems working for now.
FYI, we tested putting all nodes in a single AG, we had uncontrolled switchovers (primary node became secondary, another one was promoted primary) without any "good reason".
We switched to old method of log shipping for that reason. Any explanation?
Logshipping and AG are two different things.
You had Logshipping but then you removed it as you set AG on these instances.
But you were still getting the alerts for Logshipping which was the problem as per your question and thus I provided with an answer to resolve that issue.
AG has primary and secondary nodes, primary is read write and secondary's are read only, so what you do on primary will reflect on secondary due to AG not logshipping(as you already removed it as per my understanding).
Now AG secondary's need to catch up with primary and that depends on your redo and send queue size and speed depends on the rates of send and redo from primary and secondary all this information you can find from AG group Dashboars which is why I mentioned it it in my previous comment.
Sometimes data movement gets suspended on AG databases and you wont see transactions on secondary which happened on primary and resuming the data movement resolves this issue which I also recommended in previous comment.
This is a separate issue and for looking into it we need more details and may be a different question thread to avoid confusion.
Waiting a lot depends on the size of redo and send queue and there rates which depends on no. transactions , network , waits etc.
Also make sure the database for which you are expecting to see rows in secondary are added as availability databases in the AG.
The reason why failover happened can be found in errorlogs and AG health events may be your primary was not available and thus AG did automatic failover (which I am guessing how it is configured in your case) and turned secondary into primary and primary into secondary and that perfectly normal working of AG it is supposed to do that for high availability.
(Posted this as answer as comment has character limit and this exceeded that limit)