SQL Server Reporting Services
A SQL Server technology that supports the creation, management, and delivery of both traditional, paper-oriented reports and interactive, web-based reports.
2,790 questions
This browser is no longer supported.
Upgrade to Microsoft Edge to take advantage of the latest features, security updates, and technical support.
' cx='32' cy='32' r='32' /%3E%3Ctext x='50%25' y='55%25' dominant-baseline='middle' text-anchor='middle' fill='%23FFF' %3ERB%3C/text%3E%3C/svg%3E)
Hello
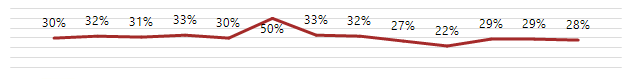
I've got the attached line chart. It's got a value of 30%, 50% etc. How do I format the chart so the 50% value is in the middle of the chart, i.e half way up the horizontal axis. the 30% value is a third the way up the chart etc. The values are calculated in a stored procedure and I'm using and expression to add the %
Thanks
Ron
I managed to work this out, I just need to set the Maximum value in the Vertical Axis Propertiesm Axis Options