SQL Server Reporting Services
A SQL Server technology that supports the creation, management, and delivery of both traditional, paper-oriented reports and interactive, web-based reports.
2,793 questions
This browser is no longer supported.
Upgrade to Microsoft Edge to take advantage of the latest features, security updates, and technical support.
' cx='32' cy='32' r='32' /%3E%3Ctext x='50%25' y='55%25' dominant-baseline='middle' text-anchor='middle' fill='%23FFF' %3EGL%3C/text%3E%3C/svg%3E)
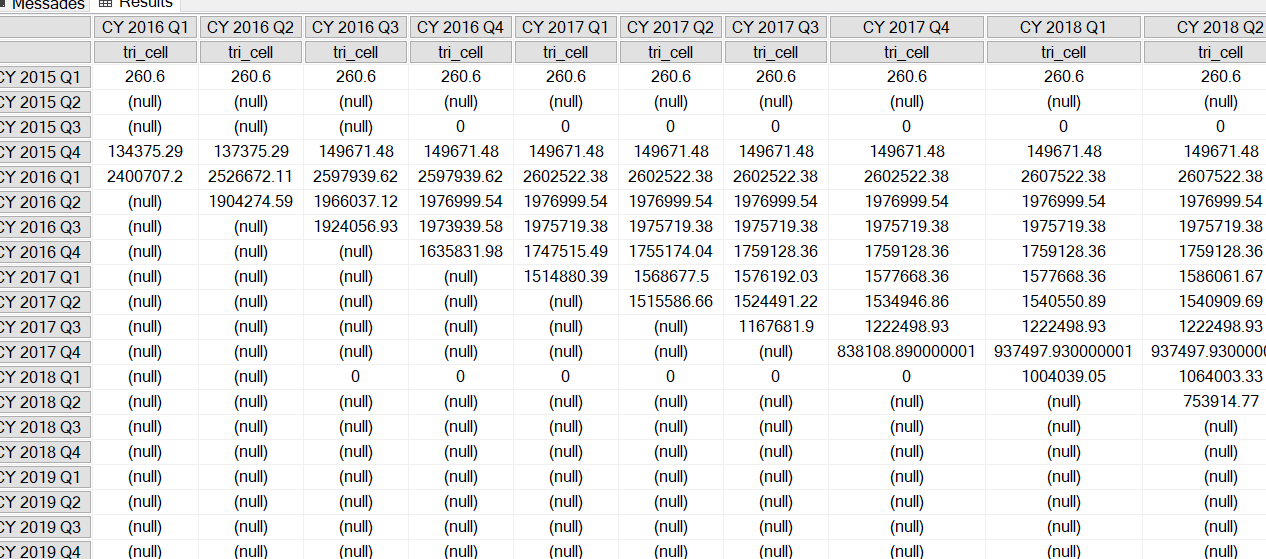
at the first image is what I have now:
on rows i have calendar quarters where each row contains claims (like auto insurance claims)
that happened that quarter (Date of Loss)
on columns I need say 12 quaters of Payment Date (DoR dimension)
that show accumulated sum of payments on those claims
the problem is that those column quarters are sort of hard coded - for each
row they should start at that row's quarter as in image 2
it makes sense - for row 2018 Q1 payments will start in that
quarter and later not in the PAST!!!!
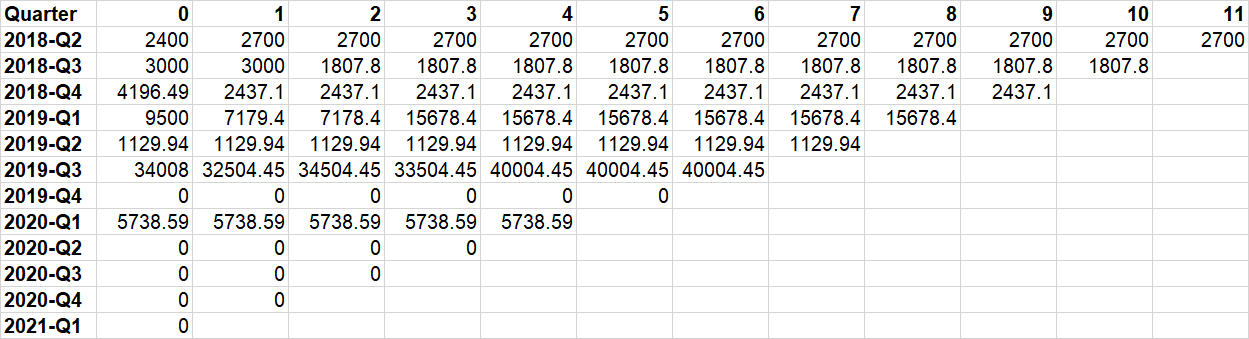
so for each row quarter i need in columns to show accumulated
sum in quarters srarting with that row quarter but in DoR dimension
that way the triangle will be on different diagonal because
for say last year rows will not be enough (12) FUTURE columns
on second image it is correct i created it in c# code of course
with member [Measures].tri_cell as
SUM
(
{NULL : [Dor Time].[Calendar Quarter].CurrentMember}
,[Measures].[Inc Amt]
)
select NON EMPTY
[Dor Time].[Calendar Quarter].[Calendar Quarter].members * {[Measures].tri_cell}
on columns,
[Dol Time].[Calendar Quarter].[Calendar Quarter].members on rows
from pandl
' cx='32' cy='32' r='32' /%3E%3Ctext x='50%25' y='55%25' dominant-baseline='middle' text-anchor='middle' fill='%23FFF' %3EAS%3C/text%3E%3C/svg%3E)
So basically to arrive at a cell's value, you start with the DoL quarter for the row, take the same quarter from DoR, move it forward by the number of quarters corresponding to the column, and finally take the value of some measure for this resulting quarter. You'll need an unrelated 'quarter offset' attribute to plot on columns, but then the MDX follows your logic quite literally.
(
  Lead
  (
    LinkMember
    (
      [Dol Time].[Calendar Quarter].CurrentMember
     ,[Dor Time].[Calendar Quarter]
    )
   ,[quarter offset].[quarter offset].CurrentMember.Key0
  )
 ,[measures].[tri_cell]
)
This implies that your codes for DoL and DoR quarters are the same. Also, tri_cell as it is now will repeat the last value for all the following quarters.
Alexei
not sure I understood - what is the full query and will it work:
I added but does not compile
with member [Measures].tri_cell as
SUM
(
{NULL : [Dor Time].[Calendar Quarter].CurrentMember}
,[Measures].[Inc Amt]
)
select NON EMPTY
(
Lead
(
LinkMember
(
[Dol Time].[Calendar Quarter].CurrentMember
,[Dor Time].[Calendar Quarter]
)
,[quarter offset].[quarter offset].CurrentMember.Key0
)
,[measures].[tri_cell]
)
The MDX I posted is for a calculated measure that you'll need to declare first. Next you plot your 'quarter offset' attribute on columns, DoL quarters on rows, and this calculated measure in cells.
Alexei
lets me sleep on it or rather learn more
i am lost but will go thru all the new terms
not sure where quarter offset came from too
thanks for the idea will be back!
Conceptually quarter offset came from column headers in your 2nd picture. Technically, you'll most probably have to add them to the cube as an unrelated attribute (quite possibly it'll take adding a whole new unlreated dimension).
Alexei
but thats the whole dificulty in my view in how one generates a set in one dymention based on value of current member in another
can i do that? here is my query with that hypothetic function(?):
with member [Measures].tri_cell as
SUM
(
{NULL : <set of several doR members>.CurrentMember}
,[Measures].[Inc Amt]
)
select NON EMPTY
<again that dynamic set of Dor members based on DoL current row member value> * {[Measures].tri_cell}
on columns,
[Dol Time].[Calendar Quarter].[Calendar Quarter].members on rows
from pandl
so how do we generate that set? and does MDX interpreter evaluates it as we think (or want) it to do - for each row member it creates column set then calculates sum for each column cell
The solution I suggested lets you achieve your 2nd picture, which I'll copy here. Note that column headers in the picture are a zero-based index and not calendar quarters from any of your dimensions. You don't really generate such lists with MDX in MD cubes, you typically create them as any other dimension/attribute.
Alexei
i
i am trying to understand mdx and it appears to me that mdx query cannot have sort of multiple slices of a cube right?
i mean in this case we have a slice along Dol/Dor dimensions like a matrix
ithats what my mdx query does
but it is ugly
i read lots of stuff and dont see example of mdx query dynamically doing evaluation of row to dynamic column set tuple
so the way I look at it (and correct me if i am wrong)
we want horizontally to apply a mask to display only the subset of a set that starts with that Linkmember function returned starting quarter
interval or lead does not matter the quesion again is: can a mask be applied to columns by row
so it is one slice just display on columns differ by rows
have you heard anything like that?
i hope i am not wasting your time
I think we should take a break from MDX and straighten out your requirements first. Do you want to produce a matrix from pic.2? If yes, what do the numbers (0..11) in the column header area mean?
Alexei
they mean number of quarters from the loss date
basically they show how payments on a claim accumulate N quarters after loss
in my (first image) mdx query i used quarters names but it is the same
so for row say Q1 2017 34 years back we need to display all quarters Q1 2017 Q2 2017
and so forth untill say to day
next row will be claims that happened Q2 2017
so for them we go forward one quarter (since nothing was paid before claim happened right?!)
it is a major insurance report called claim development triangles
shows how long it takes for an average claim to be completely settled say 2-3 years for injury claims
thats why i wrote - each row we need different subset of columns to show!
each row we need different subset of columns to show!
This is the root of your perceived trickiness! The final table shows one single set of columns, meaning the number of quarters from the loss date. However, for each row, that is for each [DoL time] quarter, there'll be different [DoR time] ranges that'll form the cell at the intersection of that row and that column. You don't 'show' DoR in the final table at all - you only use it for calculations! The three things you do show are:
Now the only two things SSAS MD can put on columns are members from some dim attribute, or a set of measures. Coding and plotting 12 measures is a bad idea. Thus you need in your cube an attribute with values of 0 to 11 for members. The rest is in my original answer.
Alexei
is the below more or less what you mean?
only i dont have enough technique?
with member [Measures].tri_cell as
SUM
(
{NULL : ??????? how to get from triangles current set member ????? }
,[Measures].[Inc Amt]
),
set [triangles] as {
PeriodsToDate([Dor Time].[Calendar Quarter].[Calendar Quarter],LinkMember
(
[Dol Time].[Calendar Quarter].CurrentMember
,[Dor Time].[Calendar Quarter]
).Lead(12))
}
select [triangles] * {[Measures].[tri_cell]}
on columns,
[Dol Time].[Calendar Quarter].[Calendar Quarter].members on rows
from pandl
You are trying to put too much logic on columns, it doesn't belong there. All you need on columns is a list of numbers 0..11. The logic happens in the cells, which take current DoL quarter from rows and current quarter offset, a simple number, from columns.
For the final query, supposing the measure I proposed is called [tri_cell_2], you'll have something far more simple:
SELECT [quarter offset].[quarter offset].[quarter offset].members on columns
, [Dol Time].[Calendar Quarter].[Calendar Quarter].members on rows
from pandl
where [measures].[tri_cell_2];
As noted, you'll have to do something with tri_cell repeating its last value for all consecutive quarters.
Alexei
I think close :(
I think i am looking procedurally and not slices
it complains 1st argument should be hierarchy not member
with member [Measures].tri_cell_2 as
(
with member [Measures].tri_cell_2 as
(
{ NULL :
LinkMember
 (
   [Dol Time].[Calendar Quarter].CurrentMember
  ,[Dor Time].[Calendar Quarter]
 ).Lead(
    [Dim State].[State Key].[State Key].CurrentMember
)
}
,[Measures].[Inc Amt]
)
select [Dim State].[State Key].[State Key].members
on columns,
[Dol Time].[Calendar Quarter].[Calendar Quarter].members on rows
from pandl
where [Measures].[tri_cell_2]
Since you apparently decided to do without your original [measures].[tri_cell], you'll need to do the SUMming in tri_cell_2, so it's SUM ( {..}, IncAmt ).
And the argument to Lead should be an integer, so it's more like
[Dim State].[State Key].CurrentMember.Key0. To the engine, a member is far more than just its caption you typically see in the output.
By the way, this State Key attribute you're using must not influence the value of Inc Amt on its own.
Intriguingly, I don't see in this code you posted anything that receives a member instead of a hierarchy for the 1st argument, as the error message says.
final version
Alexei - !!!!!!!!!!!!!!!!!!!!!!!!!!!!!!!!!!!!!!!!!!!!!!!
will not do attach it is just like the second image originally uploaded done by c#
with member [Measures].tri_cell_2 as
Sum(
{ NULL :
LinkMember
(
[Dol Time].[Calendar Quarter].CurrentMember
,[Dor Time].[Calendar Quarter]
).Lead(
[Dim State].[State Key].CurrentMember.Properties("Key0")
)}
,[Measures].[Inc Amt]
)
select [Dim State].[State Key].[State Key].members
on columns,
[Dol Time].[Calendar Quarter].[Calendar Quarter].members on rows
from pandl
where [Measures].[tri_cell_2]