Windows API - Win32
A core set of Windows application programming interfaces (APIs) for desktop and server applications. Previously known as Win32 API.
2,420 questions
This browser is no longer supported.
Upgrade to Microsoft Edge to take advantage of the latest features, security updates, and technical support.
' cx='32' cy='32' r='32' /%3E%3Ctext x='50%25' y='55%25' dominant-baseline='middle' text-anchor='middle' fill='%23FFF' %3EVK%3C/text%3E%3C/svg%3E)
Hello everyone,
We have developed a desktop server application which is written in C++. After running this application for 24hours, we could notice the following changes in memory usage(data collected through Perfmon).
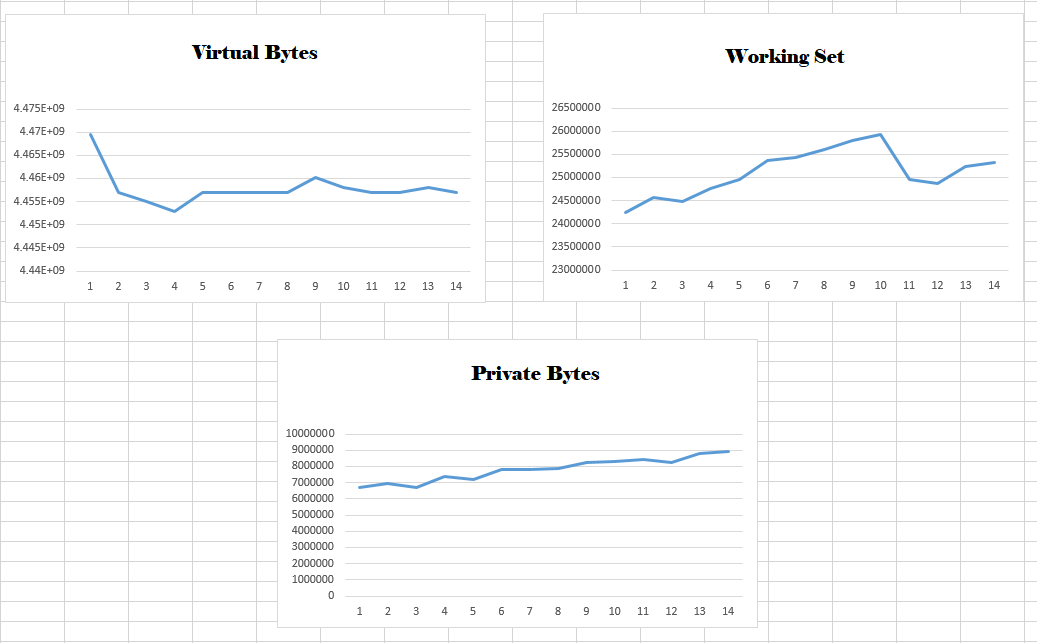
As per the information provided here(troubleshooting-native-memory-leak-in-an-iis-7x-application-pool), a memory leak is said to occur if consistently both Process\Private Bytes and Process\Virtual Bytes are increasing or Process\Private Bytes and Process\Working Set are increasing and Memory\Available Bytes is decreasing.
So as per the above analysis, can we assume that there is no memory leak in our desktop server application?
Secondly, the Debug Diagnostics report indicates the memory leak with following call-stacks.
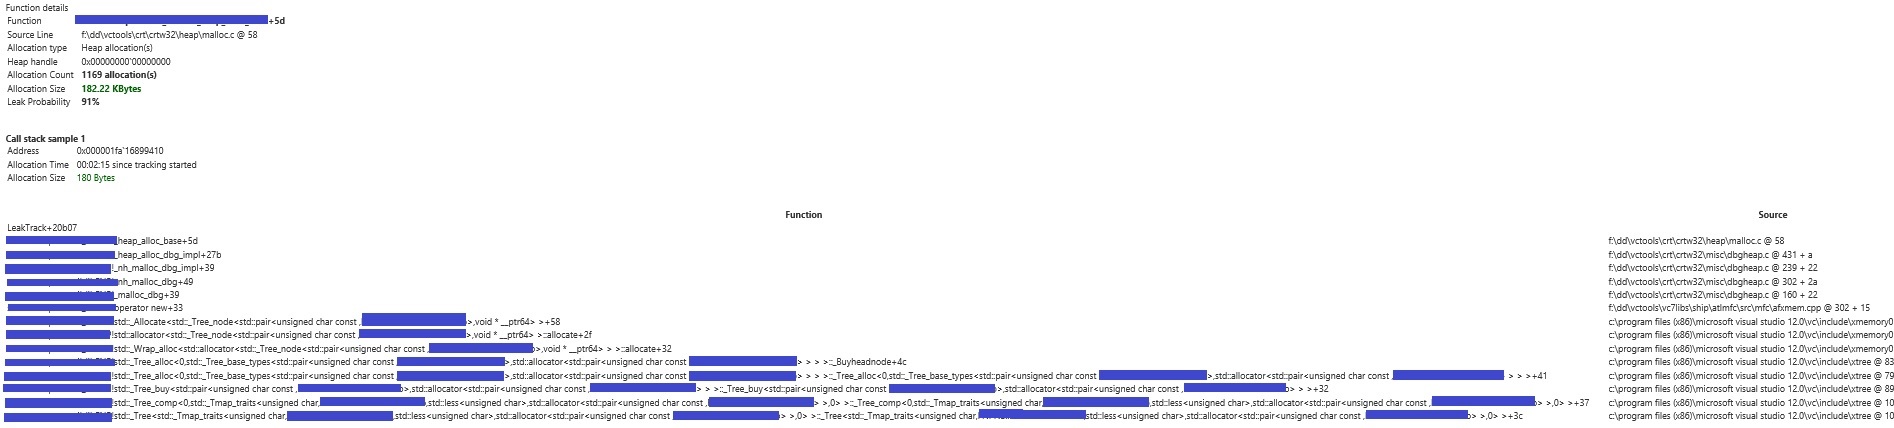
We could not see any issue with our source code, as the destructors are being invoked in the right manner.
Are std::map/std::pair destructors not invoked automatically, once the object goes out of scope? Where exactly is the memory leak?
System: Windows 10
Application built with Visual Studio 2013 and SDK 8.1
Any help would be greatly appreciated.
Thanks,
Vinay

Welcome to Microsoft Q&A! Have you checked to see if Memory\Available Bytes is decreasing? Which platform is your application based on?
' cx='32' cy='32' r='32' /%3E%3Ctext x='50%25' y='55%25' dominant-baseline='middle' text-anchor='middle' fill='%23FFF' %3EDR%3C/text%3E%3C/svg%3E)
Unfortunately there is nowhere near enough information provided here to really help. All you have shown are graphs showing an increase over an unknown time frame and a call stack showing that some STL internals call through to the an allocator.
For all we know you could be be doing something like:
#include <map>

struct s {};

int main()
{
 std::map<unsigned int, s *> m;
 auto p = m.insert({1, new s});
}
which would obviously leak since the map object doesn't clean up memory you allocated.
You would need to either delete the pointer before you erase it:
#include <map>

struct s {};

int main()
{
 std::map<unsigned int, s *> m;
 auto p = m.insert({1, new s});

 delete m.find(1)->second;
}
or use a smart pointer to do this for you:
#include <map>
#include <memory>

struct s {};

int main()
{
 std::map<unsigned int, std::unique_ptr<s>> m;
 auto p = m.insert({1, std::make_unique<s>()});
}
Actually providing code or even a sample which shows the same behaviour is the most helpful thing here.
Also remember that the Visual C++ CRT has debug features that get the CRT to show when a block of memory is still allocated when your application exits. See this for more information. The new header also has placement new functions defined to call the debug version of malloc to extend the same functionality to new too. This means if you are allocating memory using the default malloc and new, you can tell whether or not there are leaks.
As an aside Microsoft Q&A with the winapi tags is not the right place for this since this is a C++ question. The C++ tag would be better.