Azure Service Bus
An Azure service that provides cloud messaging as a service and hybrid integration.
544 questions
This browser is no longer supported.
Upgrade to Microsoft Edge to take advantage of the latest features, security updates, and technical support.
' cx='32' cy='32' r='32' /%3E%3Ctext x='50%25' y='55%25' dominant-baseline='middle' text-anchor='middle' fill='%23FFF' %3EA%3C/text%3E%3C/svg%3E)
Hello.
I am developing a Service Bus Queue Trigger with .NET 5 on Azure Functions.
When a specific URI is sent to Service Bus, it is taken from the Service Bus Queue Trigger, collected Html, parsed and stored in Cosmos DB.
Collecting the html is doing in the SDK I made.
This Crawling SDK creates a Value Object in the form of a Cosmos DB Entity that I want by loading the Html collected through HttpClient to HttpAgilityPack and parsing it.
In this process, I initially did this with one Azure Functions App, and when I collected 20-30 Html at the same time, I noticed that the Memory jumped up to 4GB in Visual Studio and the CPU was stuck at 100%.
When I waited and waited, it wasn't stopped, it was going very slowly.
Guessing the cause, the SDK I made generated a lot of garbage, and it seemed to proceed as several threads stopped while GC was in progress.
But I don't know how to prove my guess is correct.
So, first of all, 1 Azure Functions was divided into 3 projects of .NET Azure Functions Project: Crawling Part, Parsing Part, and Cosmos DB Insert Part.
If the project is divided, resources are also created separately in Azure and memory is managed by three processes, so the burden on GC seems to be less.
But it doesn't seem to work very well.
Is there a way to do Server GC instead of workstation GC in Isolated Azure Functions?
Or do you have the know-how to control the load without touching the SDK in a situation where there is a lot of garbage like this?
PrefetchCount is not used because of fear of memory load, and MaxConcurrentCalls is used with 15.
Please Help.
' cx='32' cy='32' r='32' /%3E%3Ctext x='50%25' y='55%25' dominant-baseline='middle' text-anchor='middle' fill='%23FFF' %3EAM%3C/text%3E%3C/svg%3E)
Hi @상준 이
Welcome to Microsoft Q&A! Thanks for posting the question.
I understand that you are developing Azure Function targeting .NET 5 (isolated mode). Based on the details posted, please find my response below:
1. Is there a way to do Server GC instead of workstation GC in Isolated Azure Functions?
No, the available configuration options for Azure Function is configured through host.json file and its reference is available here.. It contains configuration that applies "after" the runtime has initialized. The GC mode settings must be configured "before" the dotnet runtime initializes. Furthermore, just changing the GC mode to server will not lower the size of memory. In-fact, in most scenarios the memory requirement increases because in server mode you have 1 dotnet heap per processor core. Setting the mode to server will benefit the applications which is intended to run as servers and need high throughput and scalability (not lower memory).
In the current scenario, I suspect that the web crawling is creating large objects (probably strings/XML docs) which are rooted in your application.
2. Or do you have the know-how to control the load without touching the SDK in a situation where there is a lot of garbage like this?
There is no direct solution to achieve this. However, the best approach here would be to investigate the high memory usage and take appropriate actions. I have added some of the helpful resources and tips below to help you track it down and investigate it.
Is there a memory leak and where?
It may be possible that the application does need a lot of memory to perform. In such cases, the best approach is to modify the code/logic, such that the memory requirement is lowered. You can use tools below to investigate the memory leak:
> Visual Studio Diagnostic tool, OR
> Command line tools
The tools above would help you understand details of Objects in dotnet heap and their details like count/size.
How does garbage collector work? **
Understanding the **Fundamentals of Garbage collection would help you understand if the objects identified above can be reclaimed when GC runs; especially the concept of rooted objects
Breaking the entire FunctionApp into smaller functionApp could be a good option here, as mentioned above.
Also, you may investigate Static classes being used which are alive till the application closes. Try to minimize the static classes in the FunctionApp. You may also convert the created functionApp classes from template to non-static and they would still work:
Finally, for test purpose only, you can call GC.Collect() to understand the amount of memory that will be claimed when GC runs next. For more details, please refer to GC.Collect Method This should be done for test purpose only as it will disturb the GC's internal heuristics.
There are also some articles on the web on similar topics to help reduce memory consumption like:
> Optimising C# for a serverless environment
> Increasing performance via low memory allocation in C#
Please let me know if you have any questions.
Please 'Accept as answer' and ‘Upvote’ if it helped so that it can help others in the community looking for help on similar topics.
Thank you very much for your reply. @AnuragSingh-MSFT
We've been told through our CSP company that Azure Functions uses Server GC mode by default. However, since the Azure Functions I deployed is a consumption (serverless) plan, I got a response saying that it could work similarly to the workstation GC because it has one CPU.
And I don't know why, but when debugging on my PC, GC appears frequently as shown in the picture below. As a result of checking with Azure Metric, the deployed Azrue Functinons only had GC once. One thing I'm curious about is, can you figure out why the GIF below is happening?
Obviously it's a problem with my code, but it's impossible to predict where the problem lies. I don't understand the behavior of Visual Studio. How does the seconds count of diagnostic sessions in diagnostic tools work in Visual Studio? A GIF is a 30-second video. But looking at the diagnostic session, it only lasted 3 seconds.
I have one more question.
What I asked about how to handle the load is that I know that one Azure Functions processes multiple messages at the same time with MaxConcurrentCalls in Azure Functions App, but Azure Functions is one process, so Garbage is in one Azure Functions App As they accumulate, they will be shared. Therefore, if there are several Azure Functions that perform the same operation, the garbage will not be shared, so I think that it will be slightly advantageous for GC.
Is there anything you can do to help with this?
Attach an image.
@상준 이 , thank you for the reply.
I tested Consumption Plan for .NET 5.0 Isolated function app and here is the results:
Function running on ::
NetCoreVer: 5.0.13; runtimeVer: .NET 5.0.13; isServerGC: False; processorCount: 2
I got these values from Azure FunctionApp by including the following in code and returning the values as response:
var netCoreVersion = System.Environment.Version;
var runtimeVersion = System.Runtime.InteropServices.RuntimeInformation.FrameworkDescription;
var isServerGC = System.Runtime.GCSettings.IsServerGC; //bool; returns true if GC mode is server
var processorCount = System.Environment.ProcessorCount;
Thus, even though FunctionApp running on consumption plan has 2vCPUs allocated, the GC mode still stays Workstation for isolated function app.
---
Running application in Debug mode vs Release mode has significant impact on GC, performance, and other runtime behavior. For example, in Debug mode (when you are debugging the application through Visual Studio), GC/Code is not optimized, the generated assemblies have additional information to facilitate debugging: Use Debug build configuration. Therefore, you might see GC run not identical in both modes. GC runs more frequently in debug mode and depends on resource constraint.
(Part 1)
@상준 이 , to answer your questions:
1. In the shared screenshot, the GC seems to be getting triggered frequently. In visual studio, you can pause If you would like to understand what type of GC ran and why. You can use the pause/Ctrl+Alt+Break option as shown below and hover over the GC pointers:

It would show something like below. Forced means that the GC run was triggered by Debugger and did not run on its own.

If you would like even deeper understanding of the pauses and duration, you may use Perfview as mentioned in this blog: Workflow of diagnosing memory performance issues – Part 1
2. How does the seconds count of diagnostic sessions in diagnostic tools work in Visual Studio?
This is the total duration of the application run under VS debugger.
3. Is there anything you can do to help with this?
Even though multiple messages are being processed by the same function, the heap is shared (where objects are allocated). Each message will invoke function's method independent of other message. Therefore, when GC runs, all non-rooted objects will be collected by it. MaxConcurrentCalls can help to check CPU/memory to be under control. However, it will only impact the frequency of GC run, i.e., more objects allocated frequently would mean that GC will have to run frequently.
(Part2)
@상준 이 In my opinion, you should not worry about the GC run unless you are seeing serious high memory issue in your application in production. If you are running into high memory consumption causing issues in your FunctionApp, I would suggest using the information available in the following blog series.
https://devblogs.microsoft.com/dotnet/work-flow-of-diagnosing-memory-performance-issues-part-0/
If the issue remains with HttpAgilityPack, I would advise looking up their forums/support to understand the best way to utilize it.
If you need assistance analyzing memory pressure, I would advise opening a support case with us so that we can help you collect required data and analyze it.
Please let me know if you have any questions.
(Part 3)
---
Please 'Accept as answer' if it helped so that it can help others in the community looking for help on similar topics.
Thank you very much for the detailed reply.
I'll take a closer look and return to this thread if I have any questions.
thank you. @AnuragSingh-MSFT
@상준 이 , thank you for your kind words.
Please 'Accept as answer' if it helped so that it can help others in the community looking for help on similar topics.
Oh, I have one more question.
How is Memory scoped for deployed Azure Functions?
Generally, processes are known to share memory except for stack within one process.
Does Azure Functions share memory except for Stack only within 1 resource, with 1 GC per resource?
@상준 이 , thank you for the reply. Every process has its own memory limit that it may use. For example, based on service limits available here for Azure Function, for consumption plan each instance of Azure Function App (which may have more than 1 functions defined in it) can utilize a max of 1.5 GB of memory (RAM). This memory, if the Function App runs on .NET, is managed by Garbage collector running in that instance (GC would also shared the same memory).
Thanks for the reply. @AnuragSingh-MSFT
The reason I was curious about this is that my Service Bus Trigger was originally in the form of 4 functions subscribing to 4 Service Bus Queues in 1 .NET Azure Functions project. Because it was divided into one.
For WorkStation GC, it is common for my other threads to stop when GC is running.
I split the function with this intention, but I'm not sure if I did it correctly.
I've also heard from acquaintances that Azure Functions share memory according to their App Service Plan. Even if Azure Functions are divided into different resources, if you use the same App Service Plan, you have to check that part because memory is shared.
Is this part correct?
@상준 이 , Based on my understanding, there are 2 aspects of this scenario:
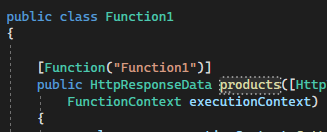
1. One Azure Function App project (which has many functions/methods): The entire project/solution will run as a single process (as you can observe when running locally), which means that 1 instance of this FunctionApp (if run in consumption plan) would have the 1.5 GB memory for its usage. When we say 1 instance, you can imaging it as running on 1 server. When the load increases (increase in the Service Bus messages), the function app might scale to more than 1 instance i.e., 1 more process of the same Function App running on another server (the real scaling operation is more complex than that, but the above scenario has been provided for clarification purpose). After scaling, we have 2 instance of FunctionApp running and each have a 1.5 GB limit. These 2 processes are independent of each other, i.e., they don't share each other's memory. For example, consider the following output which contains 2 function definition inside a single FunctionApp project. Here, it is a single process hosting both functions and the limit of 1.5 GB applies to the Function App process (not individual functions):
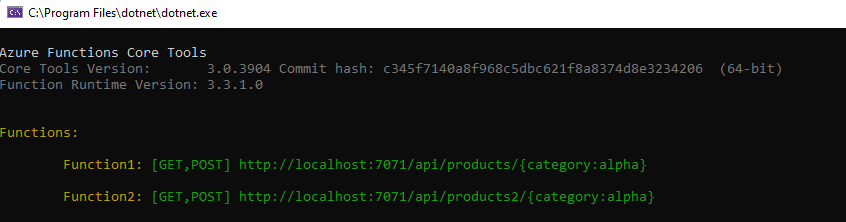
(Part 1)
@상준 이 ,
...
2. App Service Plan: An App Service plan defines a set of compute resources for a web app to run (this is not applicable to consumption based FunctionApp). Here, assume that you have selected machine size of 3.5 GB. Each Azure Web Apps, Function Apps etc. running in this "App Service plan" will share this 3.5 GB of memory when running on that machine. Individually, these processes may have a higher limit but in this scenario, consumption by all of them combined cannot go beyond what is available on the machine. Again, the process' individual memory is isolated from each other (even when running on the same system) and each process will have its own GC to take care of memory.
Please let me know if you have any questions.
(Part 2)
(Part2)
I think I've misunderstood the App Service Plan.
I thought that the isolated memory of an already running runtime process could be mixed with the memory of a later running runtime process.
I wondered how that was possible.
For example, my PC has a fixed amount of physical RAM, and I think it can be understood in a similar context to how many processes use the RAM together through virtual memory.
There was no magic.
Thank you very much.
(Part1)
Then you can think of it as the same as a general .NET Process.
I was mistaken.
But one question is, how is it that the number of Azure Functions App introduced as a scenario increases to two?
Does Azure Functions have the ability to copy an Azure Functions Resource that does the same to its own function?
Or are you using a feature like AKS?
@상준 이 , The scaling is taken care by scale controller. In a way, you can find it analogous to AKS - for example, pods in k8s are function app instance process here running on host VMs (nodes in k8s). For an overview of scaling, please refer to the following articles:
Event-driven scaling in Azure Functions
Scale and Cold start behavior in Azure Functions
I hope that clarified your doubts.
Thanks for sharing good documentation.
I just figured out that if Azure Functions is a model of App Service Plan or higher, I can use AutoScale without the capabilities of other orchestrators.
Everything I was wondering about in this thread was coolly solved.
Thank you very much till the end.