Azure Monitor
An Azure service that is used to collect, analyze, and act on telemetry data from Azure and on-premises environments.
2,799 questions
This browser is no longer supported.
Upgrade to Microsoft Edge to take advantage of the latest features, security updates, and technical support.
' cx='32' cy='32' r='32' /%3E%3Ctext x='50%25' y='55%25' dominant-baseline='middle' text-anchor='middle' fill='%23FFF' %3EB%3C/text%3E%3C/svg%3E)
I have this kinda Log Analytics query on my workbook
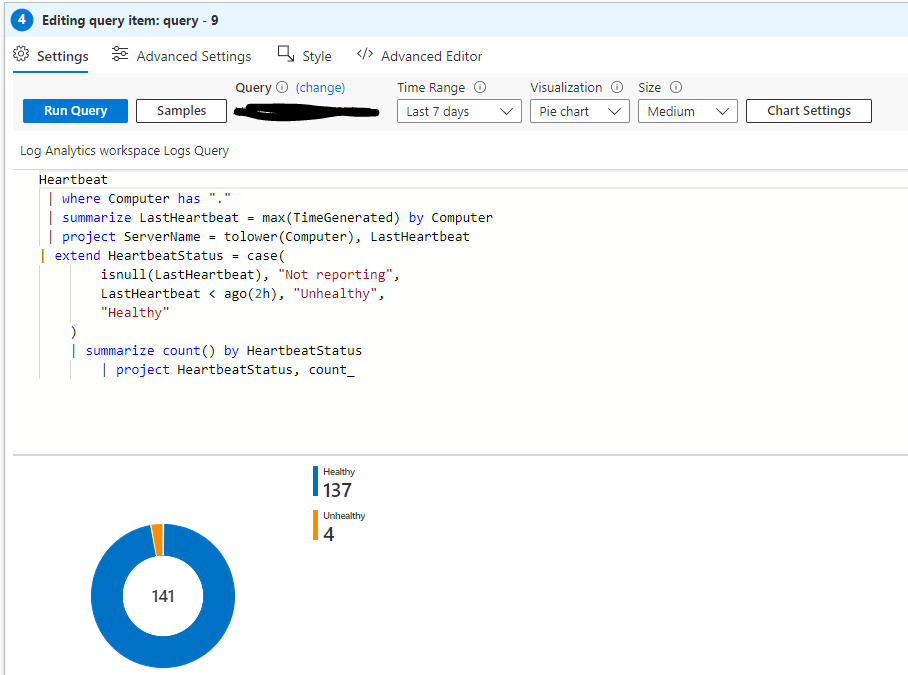
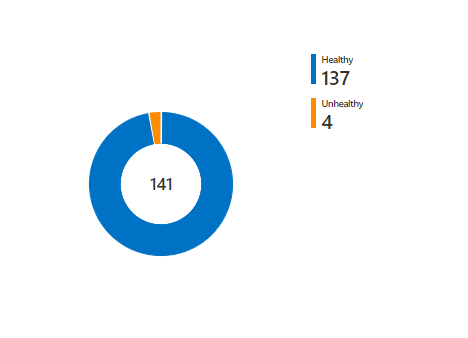
which displays as following in Workbook when not in editing mode.
I'm wondering what should I change / add / remove so that after pressing the pie chart in my workbook it would pop up some kinda of info which of the servers are 'Unhealthy' so basically same query but without line | summarize count() by HeartbeatStatus.

You can make objects hidden in workbooks and view them when a parameter has a set value or is / isn't set. In the case of pie charts, you want to use the series field, but you can see all fields by not specifying a field within When items are selected, export parameters and then using the parameter in a text box instead.
{
  "version": "Notebook/1.0",
  "items": [
    {
      "type": 9,
      "content": {
        "version": "KqlParameterItem/1.0",
        "crossComponentResources": [
          "value::all"
        ],
        "parameters": [
          {
            "id": "ff24505c-2099-43a4-a8a3-3456bed78eb5",
            "version": "KqlParameterItem/1.0",
            "name": "TimeRange",
            "type": 4,
            "isRequired": true,
            "value": {
              "durationMs": 604800000
            },
            "typeSettings": {
              "selectableValues": [
                {
                  "durationMs": 3600000
                },
                {
                  "durationMs": 14400000
                },
                {
                  "durationMs": 43200000
                },
                {
                  "durationMs": 86400000
                },
                {
                  "durationMs": 172800000
                },
                {
                  "durationMs": 259200000
                },
                {
                  "durationMs": 604800000
                },
                {
                  "durationMs": 1209600000
                },
                {
                  "durationMs": 2419200000
                },
                {
                  "durationMs": 2592000000
                },
                {
                  "durationMs": 5184000000
                },
                {
                  "durationMs": 7776000000
                }
              ],
              "allowCustom": true
            }
          },
          {
            "id": "bfe50469-7469-4c4d-a33e-0edbb43546c4",
            "version": "KqlParameterItem/1.0",
            "name": "Subscription",
            "type": 6,
            "isRequired": true,
            "multiSelect": true,
            "quote": "'",
            "delimiter": ",",
            "query": "where type =~ 'microsoft.compute/virtualmachines'\r\n| summarize Count = count() by subscriptionId\r\n\t| order by Count desc\r\n\t| extend Rank = row_number()\r\n\t| project value = subscriptionId, label = subscriptionId, selected = Rank == 1",
            "crossComponentResources": [
              "value::all"
            ],
            "typeSettings": {
              "limitSelectTo": 100,
              "additionalResourceOptions": [
                "value::10"
              ]
            },
            "queryType": 1,
            "resourceType": "microsoft.resourcegraph/resources"
          },
          {
            "id": "fb861784-4609-49f2-9f58-427fcc547677",
            "version": "KqlParameterItem/1.0",
            "name": "Workspace",
            "type": 5,
            "isRequired": true,
            "multiSelect": true,
            "quote": "'",
            "delimiter": ",",
            "query": "where type =~ 'microsoft.operationalinsights/workspaces'\r\n| project id",
            "crossComponentResources": [
              "{Subscription}"
            ],
            "value": [
            ],
            "typeSettings": {
              "resourceTypeFilter": {
                "microsoft.operationalinsights/workspaces": true
              },
              "limitSelectTo": 100,
              "additionalResourceOptions": [
                "value::1",
                "value::3",
                "value::all"
              ]
            },
            "timeContext": {
              "durationMs": 0
            },
            "timeContextFromParameter": "TimeRange",
            "queryType": 1,
            "resourceType": "microsoft.resourcegraph/resources"
          },
          {
            "id": "b2627475-cef7-4e91-97b9-b70bf00164e6",
            "version": "KqlParameterItem/1.0",
            "name": "Servers",
            "type": 2,
            "isRequired": true,
            "multiSelect": true,
            "quote": "'",
            "delimiter": ",",
            "query": "Heartbeat\r\n| distinct Computer\r\n| order by Computer",
            "crossComponentResources": [
              "{Workspace}"
            ],
            "value": [
              "value::all"
            ],
            "typeSettings": {
              "limitSelectTo": 100,
              "additionalResourceOptions": [
                "value::10",
                "value::all"
              ],
              "selectAllValue": "*",
              "showDefault": false
            },
            "timeContext": {
              "durationMs": 0
            },
            "timeContextFromParameter": "TimeRange",
            "defaultValue": "value::all",
            "queryType": 0,
            "resourceType": "microsoft.operationalinsights/workspaces"
          }
        ],
        "style": "pills",
        "queryType": 1,
        "resourceType": "microsoft.resourcegraph/resources"
      },
      "name": "parameters - 1"
    },
    {
      "type": 12,
      "content": {
        "version": "NotebookGroup/1.0",
        "groupType": "editable",
        "items": []
      },
      "name": "group - 4"
    },
    {
      "type": 3,
      "content": {
        "version": "KqlItem/1.0",
        "query": "Heartbeat\r\n| where \"'*'\" == \"{Servers}\" or Computer in ({Servers})\r\n| summarize LastHeartbeat = max(TimeGenerated) by Computer\r\n| project ServerName = tolower(Computer), LastHeartbeat\r\n| extend HeartbeatStatus = case(\r\n    isnull(LastHeartbeat), \"Not Reporting\",\r\n    LastHeartbeat < ago(2h), \"Unhealthy\",\r\n    \"Healthy\"\r\n)\r\n| summarize Count = count() by HeartbeatStatus\r\n",
        "size": 0,
        "timeContextFromParameter": "TimeRange",
        "exportFieldName": "series",
        "exportParameterName": "PieChart1Output",
        "queryType": 0,
        "resourceType": "microsoft.operationalinsights/workspaces",
        "crossComponentResources": [
          "{Workspace}"
        ],
        "visualization": "piechart"
      },
      "customWidth": "50",
      "name": "query - 1",
      "styleSettings": {
        "maxWidth": "50"
      }
    },
    {
      "type": 1,
      "content": {
        "json": "Pie Chart Not Selected. Select part of the piechart to the left\r\n",
        "style": "info"
      },
      "conditionalVisibility": {
        "parameterName": "PieChart1Output",
        "comparison": "isEqualTo"
      },
      "customWidth": "50",
      "name": "text - 3",
      "styleSettings": {
        "maxWidth": "50"
      }
    },
    {
      "type": 3,
      "content": {
        "version": "KqlItem/1.0",
        "query": "Heartbeat\r\n| where \"'*'\" == \"{Servers}\" or Computer in ({Servers})\r\n| summarize LastHeartbeat = max(TimeGenerated) by Computer\r\n| project ServerName = tolower(Computer), LastHeartbeat\r\n| extend HeartbeatStatus = case(\r\n    isnull(LastHeartbeat), \"Not Reporting\",\r\n    LastHeartbeat < ago(2h), \"Unhealthy\",\r\n    \"Healthy\"\r\n)\r\n| where HeartbeatStatus == \"{PieChart1Output}\"\r\n| project ServerName, LastHeartbeat\r\n",
        "showQuery": true,
        "size": 0,
        "timeContextFromParameter": "TimeRange",
        "queryType": 0,
        "resourceType": "microsoft.operationalinsights/workspaces",
        "crossComponentResources": [
          "{Workspace}"
        ]
      },
      "conditionalVisibility": {
        "parameterName": "PieChart1Output",
        "comparison": "isNotEqualTo"
      },
      "customWidth": "50",
      "name": "query - 2",
      "styleSettings": {
        "maxWidth": "50"
      }
    }
  ],
  "fallbackResourceIds": [
    "Azure Monitor"
  ],
  "$schema": "https://github.com/Microsoft/Application-Insights-Workbooks/blob/master/schema/workbook.json"
}