Azure App Service
Azure App Service is a service used to create and deploy scalable, mission-critical web apps.
6,865 questions
This browser is no longer supported.
Upgrade to Microsoft Edge to take advantage of the latest features, security updates, and technical support.

There is no metric for app service CPU %, only CPU Time. Thats not very helpful when the App Service Plan sends an alert saying its using 90% CPU. How do I tell which of the app services in the plan is the one (or ones) that are running so hard?
' cx='32' cy='32' r='32' /%3E%3Ctext x='50%25' y='55%25' dominant-baseline='middle' text-anchor='middle' fill='%23FFF' %3EKG%3C/text%3E%3C/svg%3E)
still the answer mentioned below doesnt justify not be to get the reports
' cx='32' cy='32' r='32' /%3E%3Ctext x='50%25' y='55%25' dominant-baseline='middle' text-anchor='middle' fill='%23FFF' %3ET%3C/text%3E%3C/svg%3E)
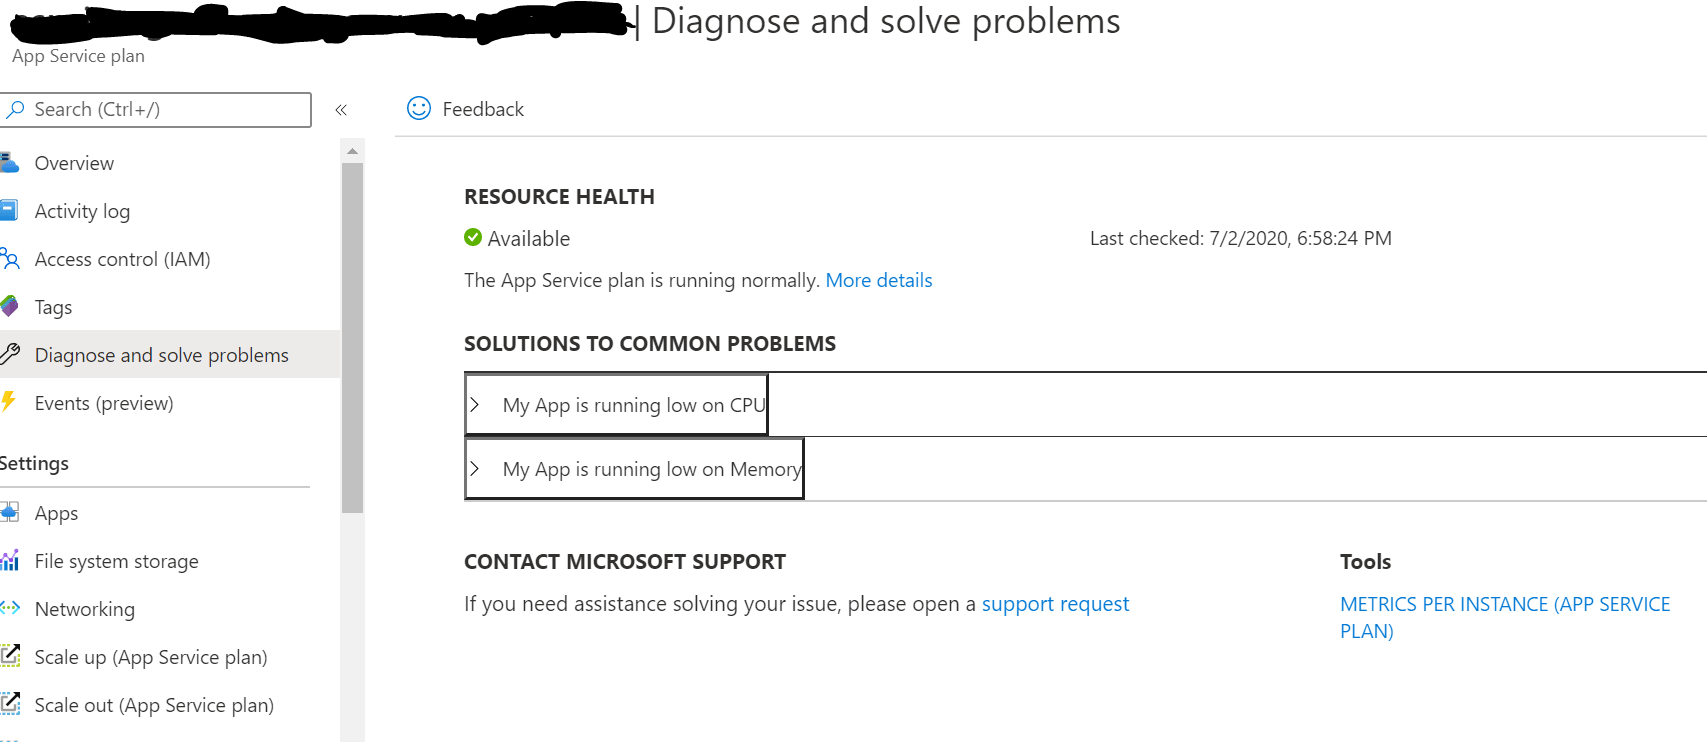
The reason you can't find the CPU stats for apps within a service plan is that you can't access the information from the service plan page.
To access it you need to select an app within the service plan that you want to investigate.
open the service plan on the "overview" page
click on the "apps/slots" link to display a list of the apps within this service plan
click on one of the apps listed, anyone is fine
when the app overview page is shown
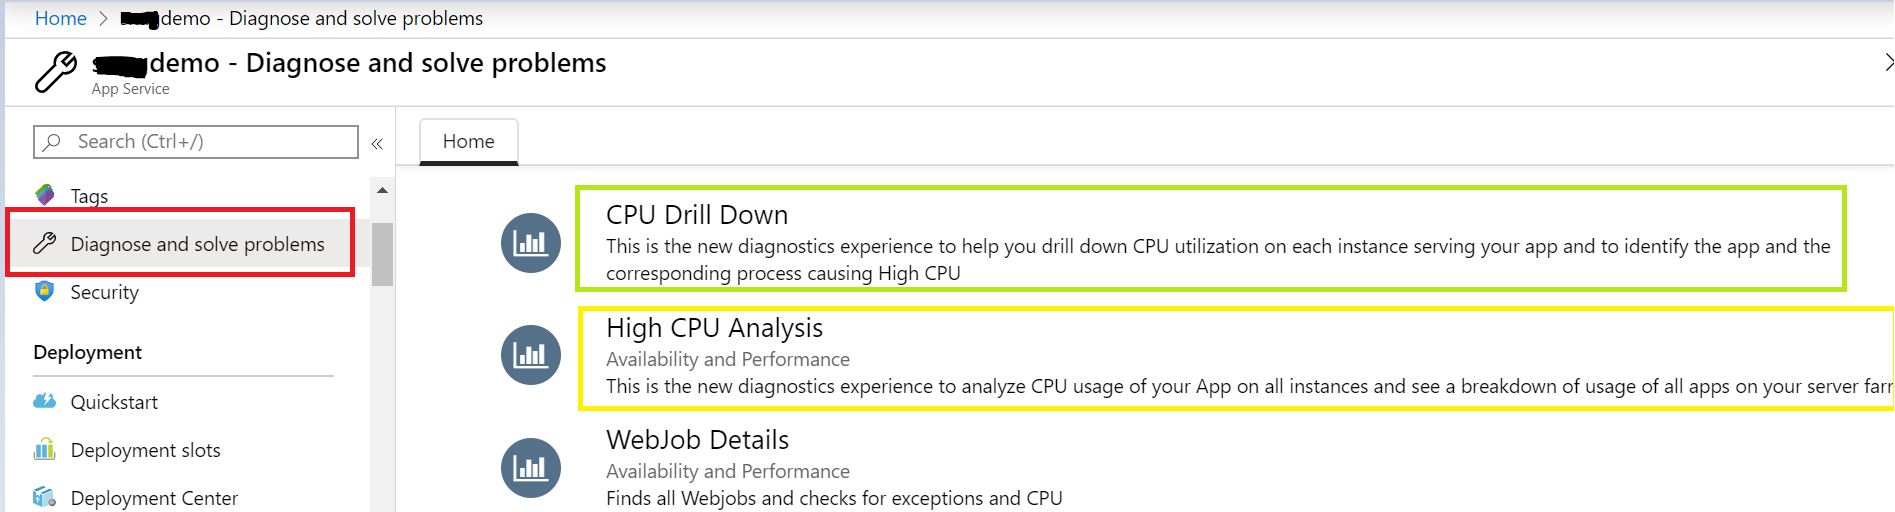
click on the "diagnose and solve problems" on left menu
now click on "availability and performance"
on the left menu you will see "high cpu analysis" click this
it may show a drop down "one web app causing high cpu usage", click the arrow on the right to expand
you will see several sections, the bottom one is "cpu drill down"
you can then see usage by each app within the app service.
you can float over the graph or over the list of apps to see the detail, you can also click on the list of apps to show/hide that apps info
Why they have created this backwards way of getting the info is anyones guess
Hope this helps
T
' cx='32' cy='32' r='32' /%3E%3Ctext x='50%25' y='55%25' dominant-baseline='middle' text-anchor='middle' fill='%23FFF' %3EA%3C/text%3E%3C/svg%3E)
Thanks for taking time to share the step-step instructions to view the App Service-Apps/resources. Also, videos shared by PuneetGupta-4162 would be helpful in this case.
If you wish to share any feedback with our product engineering team on this, you may always post here- https://feedback.azure.com/forums/169385-web-apps.
Much appreciate your response.
' cx='32' cy='32' r='32' /%3E%3Ctext x='50%25' y='55%25' dominant-baseline='middle' text-anchor='middle' fill='%23FFF' %3ESA%3C/text%3E%3C/svg%3E)
@TrevorL - Dude, thank you!
@ajkuma - this Diagnose and Solve Problems page has a totally new look compared to before. It was definitely 100% broken or not available when I posted this question, because it would not even show me the Drill Down section. If you are open to feedback/tips, next time someone appears to be stuck when you have given them illustrated directions, try asking them for screenshots of what they see at each step. (thats real feedback btw, not every word of customer communication is "feedback"; sometimes its requests, sometimes defect reports, sometimes meaningless jabber. Irks me to no end that MSFT treats customers in that way in general - nothing against you, I appreciate the attempt to assist.)
' cx='32' cy='32' r='32' /%3E%3Ctext x='50%25' y='55%25' dominant-baseline='middle' text-anchor='middle' fill='%23FFF' %3EPL%3C/text%3E%3C/svg%3E)
Maybe the poster would like to know of all the Apps within his App Service Plan, which is consuming the most CPU. For example at the moment I have an App Service Plan which is running at 100% CPU but I can't tell which App within the plan is causing it to run at such a high CPU.
@Piers Lawson , Thanks for the clarification on this. Kindly take a look at the suggestions posted above and let us know if this helps.
' cx='32' cy='32' r='32' /%3E%3Ctext x='50%25' y='55%25' dominant-baseline='middle' text-anchor='middle' fill='%23FFF' %3EME%3C/text%3E%3C/svg%3E)
This is exactly what I am looking for. I have 14 applications on my App Service Plan and see spikes of 100% CPU utilization. Looking to see which service is doing this.
Welcome to Microsoft Q&A! Thanks for posting this question.
Firstly, to highlight there are two metrics that reflect CPU usage:
CPU Time: Useful for apps hosted in Free or Shared plans, because one of their quotas is defined in CPU minutes used by the app.
So, if you’re using Free or Share plans you will see this metric.
CPU percentage: Useful for apps hosted in Basic, Standard, and Premium plans, because they can be scaled out. CPU percentage is a good indication of the overall usage across all instances.
On the higher App Service Plan (noted above), from “Diagnosed and solve problems” You can analyze CPU usage of your App on all instances and see a breakdown of usage of all apps on your server farm & also drill down CPU utilization on each instance serving your app and identify the app and the corresponding process causing High CPU in percentage.
Kindly let us know if this helps or you need further assistance on this topic we would be more than happy assist you.
Just checking in to see if the above post helped answer your question. Kindly let us know if you have any further questions on this specific topic, we would be more than happy to assist you.
Please do mark the post which was helpful by clicking on ‘Accept Answer’ & ‘Up-Vote’ to help the community find the right answers.
I didn't even see this response. I'll look at it today.
CPU percentage is what I'm after, but it's not available for app services. Our production services are not using the free or shared tiers. If you think CPU% is available, kindly take a screenshot of it on the metrics tab of the app service, and share the steps you used to get to that point.
@ajkuma - indeed it has not helped, because I want to see the CPU usage percent for a single app service. When there are 5 app services in a plan and the plan is spiking at 100%, I need to be able to see which are causing the spike. This is not available on the metrics tab/blade for the app service, and there is no breakout metric for it on the app service plan.
When you start off by talking about the two possible stats and include CPU time and the rest of the post is well formatted, im going to stop reading because at that point its clear you are giving me a generalized canned answer that will not have the details I am asking about specifically.
@StingyJack , My apologies for the delay. Thanks for sharing additional details on this.
You can view the CPU usage per Apps /instance from Diagnostics view.
Kindly navigate to "CPU Drill down"section. Here in my screenshots, you will notice I have 3 test Apps /instance and CPU Percentage.
Further scroll down to "App Level CPU consumption" , you can review CPU usage per App.


@StingyJack , Just to clarify on a few points. From your initial question, it was not clear on the App Service Plan you were using ( Shared or non-shared plan), so initially I just wanted to clarify the difference between CPU time and CPU percentage to begin with and then further share details on exploring these metrics. Sorry if it was confusing to understand.
Also, I believe there was some confusion with terminology, so I just wanted to clarify.
App Service – Service which enables you to build and host web apps, mobile back ends, and RESTful APIs.
Apps– Your individual Apps (WebApps), these apps run in App Service Plan.
App Service Plan - An App Service plan defines a set of compute resources for a web app to run.
@StingyJack , I was expecting your response on our first engagement. But, I missed notification on your second response, so I could not follow-up sooner. Sorry about that!
I completely understand the frustration with this issue, my apologies for all the inconvenience. If something is still not clear or you need further assistance, please send an email to AzCommunity[at]Microsoft[dot]com referencing this thread, with subject line 'Attn:Ajay', I would receive the email and will follow-up with you offline further and provide a more focused assistance.
Thanks for your kind cooperation!
Ack! Thanks for the response.
Thanks for the info share, this looks like it will be what our support team needs to better react to CPU spike alerts.
I dont get the notifications properly for things on here either. This forum either needs a lot of work or should just be closed since we already have StackOverflow and this one is just lacking badly. Not to mention its going to be the victim of the "must lock all things" policy at microsoft.
I found the uservoice item for adding the CPU % to the app service or app service plan blade (displaying the percentage for each app service) and upvoted it. Its almost shocking that such an elementary thing is missing still.
@StingyJack , just to clarify on the above post. The message is a humble follow-up to check if we were able address the issue in our previous engagement and to take-up any further questions you may have. The above message is not intended for thread closure. We are here to help you. Again, sorry if this was confusing to you.
@StingyJack , Thanks for the follow-up.
For the notification issues on Microsoft Q&A platform, I have reported this to our team internally. We really appreciate all the feedback you share; we do closely monitor all the suggestions and feedback and incorporate them to ensure our user experience is better.
If you have more feedback about the Microsoft Q&A platform, we encourage you to share your feedback, on this page ( top righthand corner) > from the “Post” dropdown > select “Site feedback” – these are closely monitored by our platform team.
Just to highlight, on notifications from the platform, you can manage the Microsoft Q&A notification by going into your User Menu profile settings (Top righthand corner on this page) > “Profile”>>Under ‘Settings’. By default, when an answer is posted you will receive ‘instant’ notification and also when someone mentions you using @ username notation.
@StingyJack , Following-up on my post above. We really appreciate you for sharing feedback about the Microsoft Q&A platform. To answer to your question on why not Stackoverflow, I'm copying the answer from our FAQ article below.
You may wish to checkout this discussion thread here - Why not just use Stack Exchange
Q: What are the major benefits of Microsoft Q&A versus Stack Overflow?
A: We love Stack Overflow. We will continue supporting our customers who ask questions there. In the future, we will introduce a feature that points askers on Microsoft Q&A to relevant answers from Stack Overflow. Please check the FAQ above for more details on this topic.
@StingyJack , In regards to your feedback; for having the CPU% metrics blade for each apps/ App Service Plan, I have shared your feedback with our product team, I shall follow-up further on this, could you please share the Uservoice post that you're referring to
(I have checked a few and followed-up internally). Thanks for up-voting the feedback item.
Once again, I completely understand the frustration you had with this issue, sincere apologies for all the inconvenience!. Thanks for sharing your positive feedback. We are here to help you.
Sorry to belabor this, but I dont see any of the screens you have depicted in screenshots. I'm going to have to open a support case since I cant seem to click enough to find these things.
' cx='32' cy='32' r='32' /%3E%3Ctext x='50%25' y='55%25' dominant-baseline='middle' text-anchor='middle' fill='%23FFF' %3EKS%3C/text%3E%3C/svg%3E)
Hi,
I do not find the tabs which you have mentioned.
I need to know which app is causing the high CPU percentage for that app service plan .
Please find the screenshot. And help me solve this issue.
Thanks in advance
Apologies for the delay! Kindly check the videos shared (in the below) by PuneetGupta-4162, if you still have issues with this, kindly let us know.
Thank you ajkuma.
' cx='32' cy='32' r='32' /%3E%3Ctext x='50%25' y='55%25' dominant-baseline='middle' text-anchor='middle' fill='%23FFF' %3EPG%3C/text%3E%3C/svg%3E)
We started recording some troubleshooting videos that can guide customers on troubleshooting common issues on Azure App Service. To troubleshoot high CPU - watch this video - https://youtu.be/hxB0JaQk2Z8 and subscribe to the channel - https://www.youtube.com/channel/UCWPqqOAHkb7XgPk1YdAm8tQ