Use Logstash to stream logs with pipeline transformations via DCR-based API
Important
Data ingestion using the Logstash output plugin with Data Collection Rules (DCRs) is currently in public preview. This feature is provided without a service level agreement. For more information, see Supplemental Terms of Use for Microsoft Azure Previews.
Microsoft Sentinel's new Logstash output plugin supports pipeline transformations and advanced configuration via Data Collection Rules (DCRs). The plugin forwards any type of logs from external data sources into custom or standard tables in Log Analytics or Microsoft Sentinel.
In this article, you learn how to set up the new Logstash plugin to stream the data into Log Analytics or Microsoft Sentinel using DCRs, with full control over the output schema. Learn how to deploy the plugin.
Note
A previous version of the Logstash plugin allows you to connect data sources through Logstash via the Data Collection API.
With the new plugin, you can:
- Control the configuration of the column names and types.
- Perform ingestion-time transformations like filtering or enrichment.
- Ingest custom logs into a custom table, or ingest a Syslog input stream into the Log Analytics Syslog table.
Ingestion into standard tables is limited only to standard tables supported for custom logs ingestion.
To learn more about working with the Logstash data collection engine, see Getting started with Logstash.
Overview
Architecture and background

The Logstash engine is comprised of three components:
- Input plugins: Customized collection of data from various sources.
- Filter plugins: Manipulation and normalization of data according to specified criteria.
- Output plugins: Customized sending of collected and processed data to various destinations.
Note
Microsoft supports only the Microsoft Sentinel-provided Logstash output plugin discussed here. The current plugin is named microsoft-sentinel-log-analytics-logstash-output-plugin, v1.1.0. You can open a support ticket for any issues regarding the output plugin.
Microsoft does not support third-party Logstash output plugins for Microsoft Sentinel, or any other Logstash plugin or component of any type.
See the prerequisites for the plugin’s Logstash version support.
The Microsoft Sentinel output plugin for Logstash sends JSON-formatted data to your Log Analytics workspace, using the Log Analytics Log Ingestion API. The data is ingested into custom logs or standard table.
- Learn more about the Logs ingestion API.
Deploy the Microsoft Sentinel output plugin in Logstash
To set up the plugin, follow these steps:
- Review the prerequisites
- Install the plugin
- Create a sample file
- Create the required DCR-related resources
- Configure Logstash configuration file
- Restart Logstash
- View incoming logs in Microsoft Sentinel
- Monitor output plugin audit logs
Prerequisites
Install a supported version of Logstash. The plugin supports the following Logstash versions:
- 7.0 - 7.17.13
- 8.0 - 8.9
- 8.11
Note
If you use Logstash 8, we recommended that you disable ECS in the pipeline.
Verify that you have a Log Analytics workspace with at least contributor rights.
Verify that you have permissions to create DCR objects in the workspace.
Install the plugin
The Microsoft Sentinel output plugin is available in the Logstash collection.
- Follow the instructions in the Logstash Working with plugins document to install the microsoft-sentinel-log-analytics-logstash-output-plugin plugin.
- If your Logstash system does not have Internet access, follow the instructions in the Logstash Offline Plugin Management document to prepare and use an offline plugin pack. (This will require you to build another Logstash system with Internet access.)
Create a sample file
In this section, you create a sample file in one of these scenarios:
Create a sample file for custom logs
In this scenario, you configure the Logstash input plugin to send events to Microsoft Sentinel. For this example, we use the generator input plugin to simulate events. You can use any other input plugin.
In this example, the Logstash configuration file looks like this:
input {
      generator {
            lines => [
                 "This is a test log message"
            ]
           count => 10
      }
}
Copy the output plugin configuration below to your Logstash configuration file.
output {
    microsoft-sentinel-log-analytics-logstash-output-plugin {
      create_sample_file => true
      sample_file_path => "<enter the path to the file in which the sample data will be written>" #for example: "c:\\temp" (for windows) or "/tmp" for Linux.
    }
}
To make sure that the referenced file path exists before creating the sample file, start Logstash.
The plugin writes ten records to a sample file named
sampleFile<epoch seconds>.jsonin the configured path. For example: c:\temp\sampleFile1648453501.json. Here is part of a sample file that the plugin creates:[ { "host": "logstashMachine", "sequence": 0, "message": "This is a test log message", "ls_timestamp": "2022-03-28T17:45:01.690Z", "ls_version": "1" }, { "host": "logstashMachine", "sequence": 1 ... ]The plugin automatically adds these properties to every record:
ls_timestamp: The time when the record is received from the input pluginls_version: The Logstash pipeline version.
You can remove these fields when you create the DCR.
Create a sample file to ingest logs into the Syslog table
In this scenario, you configure the Logstash input plugin to send syslog events to Microsoft Sentinel.
If you don't already have syslog messages forwarded into your Logstash machine, you can use the logger command to generate messages. For example (for Linux):
logger -p local4.warn --rfc3164 --tcp -t CEF: "0|Microsoft|Device|cef-test|example|data|1|here is some more data for the example" -P 514 -d -n 127.0.0.1
Here is an example for the Logstash input plugin:
input {
     syslog {
         port => 514
    }
}
Copy the output plugin configuration below to your Logstash configuration file.
output {
    microsoft-sentinel-log-analytics-logstash-output-plugin {
      create_sample_file => true
      sample_file_path => "<enter the path to the file in which the sample data will be written>" #for example: "c:\\temp" (for windows) or "/tmp" for Linux.
    }
}
To make sure that the file path exists before creating the sample file, start Logstash.
The plugin writes ten records to a sample file named
sampleFile<epoch seconds>.jsonin the configured path. For example: c:\temp\sampleFile1648453501.json. Here is part of a sample file that the plugin creates:[ { "logsource": "logstashMachine", "facility": 20, "severity_label": "Warning", "severity": 4, "timestamp": "Apr 7 08:26:04", "program": "CEF:", "host": "127.0.0.1", "facility_label": "local4", "priority": 164, "message": 0|Microsoft|Device|cef-test|example|data|1|here is some more data for the example", "ls_timestamp": "2022-04-07T08:26:04.000Z", "ls_version": "1" } ]The plugin automatically adds these properties to every record:
ls_timestamp: The time when the record is received from the input pluginls_version: The Logstash pipeline version.
You can remove these fields when you create the DCR.
Create the required DCR resources
To configure the Microsoft Sentinel DCR-based Logstash plugin, you first need to create the DCR-related resources.
In this section, you create resources to use for your DCR, in one of these scenarios:
- Create DCR resources for ingestion into a custom table
- Create DCR resources for ingestion into a standard table
Create DCR resources for ingestion into a custom table
To ingest the data to a custom table, follow these steps (based on the Send data to Azure Monitor Logs using REST API (Azure portal) tutorial):
Review the prerequisites.
Parse and filter sample data using the sample file you created in the previous section.
Assign permissions to the DCR.
Skip the Send sample data step.
If you come across any issues, see the troubleshooting steps.
Create DCR resources for ingestion into a standard table
To ingest the data to a standard table like Syslog or CommonSecurityLog, you use a process based on the Send data to Azure Monitor Logs using REST API (Resource Manager templates) tutorial. While the tutorial explains how to ingest data into a custom table, you can easily adjust the process to ingest data into a standard table. The steps below indicate relevant changes in the steps.
Review the prerequisites.
-
Skip the Create new table in Log Analytics workspace step. This step isn't relevant when ingesting data into a standard table, because the table is already defined in Log Analytics.
Create the DCR. In this step:
- Provide the sample file you created in the previous section.
- Use the sample file you created to define the
streamDeclarationsproperty. Each of the fields in the sample file should have a corresponding column with the same name and the appropriate type (see the example below). - Configure the value of the
outputStreamproperty with the name of the standard table instead of the custom table. Unlike custom tables, standard table names don't have the_CLsuffix. - The prefix of the table name should be
Microsoft-instead ofCustom-. In our example, theoutputStreamproperty value isMicrosoft-Syslog.
-
Skip the Send sample data step.
If you come across any issues, see the troubleshooting steps.
Example: DCR that ingests data into the Syslog table
Note that:
- The
streamDeclarationscolumn names and types should be the same as the sample file fields, but you do not have to specify all of them. For example, in the DCR below, thePRI,typeandls_versionfields are omitted from thestreamDeclarationscolumn. - The
dataflowsproperty transforms the input to the Syslog table format, and sets theoutputStreamtoMicrosoft-Syslog.
{
	"$schema": "https://schema.management.azure.com/schemas/2019-04-01/deploymentTemplate.json#",
	"contentVersion": "1.0.0.0",
	"parameters": {
		"dataCollectionRuleName": {
			"type": "String",
			"metadata": {
				"description": "Specifies the name of the Data Collection Rule to create."
			}
		},
		"location": {
			"defaultValue": "westus2",
			"allowedValues": [
				"westus2",
				"eastus2",
				"eastus2euap"
			],
			"type": "String",
			"metadata": {
				"description": "Specifies the location in which to create the Data Collection Rule."
			}
		},
        "location": {
            "defaultValue": "[resourceGroup().location]",
            "type": "String",
            "metadata": {
                "description": "Specifies the location in which to create the Data Collection Rule."
            }
        },
		"workspaceResourceId": {
			"type": "String",
			"metadata": {
				"description": "Specifies the Azure resource ID of the Log Analytics workspace to use."
			}
		},
		"endpointResourceId": {
			"type": "String",
			"metadata": {
				"description": "Specifies the Azure resource ID of the Data Collection Endpoint to use."
			}
		}
	},
	"resources": [
		{
			"type": "Microsoft.Insights/dataCollectionRules",
			"apiVersion": "2021-09-01-preview",
			"name": "[parameters('dataCollectionRuleName')]",
			"location": "[parameters('location')]",
			"properties": {
				"dataCollectionEndpointId": "[parameters('endpointResourceId')]",
				"streamDeclarations": {
					"Custom-SyslogStream": {
						"columns": [
							{
                        "name": "ls_timestamp",
                        "type": "datetime"
                    },	{
                        "name": "timestamp",
                        "type": "datetime"
                    },
                    {
                        "name": "message",
                        "type": "string"
                    },
					{
                        "name": "facility_label",
                        "type": "string"
                    },
					{
                        "name": "severity_label",
                        "type": "string"
                    },
                    {
                        "name": "host",
                        "type": "string"
                    },
                    {
                        "name": "logsource",
                        "type": "string"
                    }
	]
				      }
				},
				"destinations": {
					"logAnalytics": [
						{
							"workspaceResourceId": "[parameters('workspaceResourceId')]",
							"name": "clv2ws1"
						}
					]
				},
				"dataFlows": [
					{
					"streams": [
						"Custom-SyslogStream"
					],
					"destinations": [
						"clv2ws1"
					],
					"transformKql": "source | project TimeGenerated = ls_timestamp, EventTime = todatetime(timestamp), Computer = logsource, HostName = logsource, HostIP = host, SyslogMessage = message, Facility = facility_label, SeverityLevel = severity_label",
						"outputStream": "Microsoft-Syslog"
					}
				]
			}
		}
	],
	"outputs": {
		"dataCollectionRuleId": {
			"type": "String",
			"value": "[resourceId('Microsoft.Insights/dataCollectionRules', parameters('dataCollectionRuleName'))]"
		}
	}
}
Configure Logstash configuration file
To configure the Logstash configuration file to ingest the logs into a custom table, retrieve these values:
| Field | How to retrieve |
|---|---|
client_app_Id |
The Application (client) ID value you create in step 3 when you create the DCR resources, according to the tutorial you used in this section. |
client_app_secret |
The Application (client) ID value you create in step 5 when you create the DCR resources, according to the tutorial you used in this section. |
tenant_id |
Your subscription's tenant ID. You can find the tenant ID under Home > Microsoft Entra ID > Overview > Basic Information. |
data_collection_endpoint |
The value of the logsIngestion URI in step 3 when you create the DCR resources, according to the tutorial you used in this section. |
dcr_immutable_id |
The value of the DCR immutableId in step 6 when you create the DCR resources, according to the tutorial you used in this section. |
dcr_stream_name |
For custom tables, as explained in step 6 when you create the DCR resources, go to the JSON view of the DCR, and copy the dataFlows > streams property. See the dcr_stream_name in the example below.For standard tables, the value is Custom-SyslogStream. |
After you retrieve the required values:
- Replace the output section of the Logstash configuration file you created in the previous step with the example below.
- Replace the placeholder strings in the example below with the values you retrieved.
- Make sure you change the
create_sample_fileattribute tofalse.
Optional configuration
| Field | Description | Default value |
|---|---|---|
azure_cloud |
Used to specify the name of the Azure cloud that is being used, Available values are: AzureCloud, AzureChinaCloud, and AzureUSGovernment. |
AzureCloud |
key_names |
An array of strings. Provide this field if you want to send a subset of the columns to Log Analytics. | None (field is empty) |
plugin_flush_interval |
Defines the maximal time difference (in seconds) between sending two messages to Log Analytics. | 5 |
retransmission_time |
Sets the amount of time in seconds for retransmitting messages once sending failed. | 10 |
compress_data |
When this field is True, the event data is compressed before using the API. Recommended for high throughput pipelines. |
False |
proxy |
Specify which proxy URL to use for all API calls. | None (field is empty) |
proxy_aad |
Specify which proxy URL to use for API calls to Microsoft Entra ID. | Same value as 'proxy' (field is empty) |
proxy_endpoint |
Specify which proxy URL to use for API calls to the Data Collection Endpoint. | Same value as 'proxy' (field is empty) |
Example: Output plugin configuration section
output {
    microsoft-sentinel-log-analytics-logstash-output-plugin {
      client_app_Id => "<enter your client_app_id value here>"
      client_app_secret => "<enter your client_app_secret value here>"
      tenant_id => "<enter your tenant id here> "
      data_collection_endpoint => "<enter your DCE logsIngestion URI here> "
      dcr_immutable_id => "<enter your DCR immutableId here> "
      dcr_stream_name => "<enter your stream name here> "
      create_sample_file=> false
      sample_file_path => "c:\\temp"
      proxy => "http://proxy.example.com"
    }
}
To set other parameters for the Microsoft Sentinel Logstash output plugin, see the output plugin's readme file.
Note
For security reasons, we recommend that you don't implicitly state the client_app_Id, client_app_secret, tenant_id, data_collection_endpoint, and dcr_immutable_id attributes in your Logstash configuration file. We recommend that you store this sensitive information in a Logstash KeyStore.
Restart Logstash
Restart Logstash with the updated output plugin configuration and see that data is ingested to the right table according to your DCR configuration.
View incoming logs in Microsoft Sentinel
Verify that messages are being sent to the output plugin.
From the Microsoft Sentinel navigation menu, click Logs. Under the Tables heading, expand the Custom Logs category. Find and click the name of the table you specified (with a
_CLsuffix) in the configuration.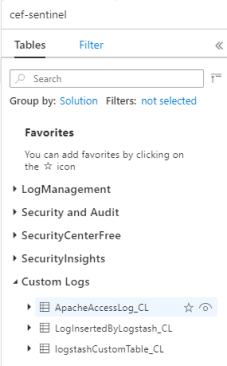
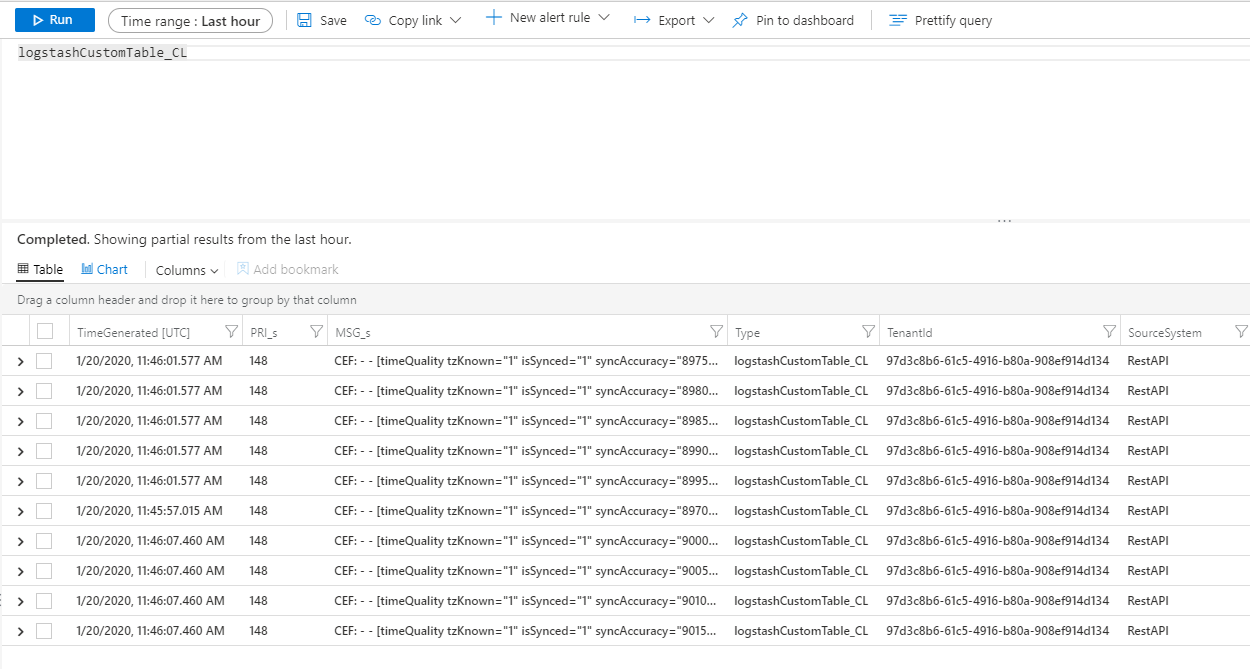
To see records in the table, query the table by using the table name as the schema.
Monitor output plugin audit logs
To monitor the connectivity and activity of the Microsoft Sentinel output plugin, enable the appropriate Logstash log file. See the Logstash Directory Layout document for the log file location.
If you are not seeing any data in this log file, generate and send some events locally (through the input and filter plugins) to make sure the output plugin is receiving data. Microsoft Sentinel will support only issues relating to the output plugin.
Network security
Define network settings and enable network isolation for Microsoft Sentinel Logstash output plugin.
Virtual network service tags
Microsoft Sentinel output plugin supports Azure virtual network service tags. Both AzureMonitor and AzureActiveDirectory tags are required.
Azure Virtual Network service tags can be used to define network access controls on network security groups, Azure Firewall, and user-defined routes. Use service tags in place of specific IP addresses when you create security rules and routes. For scenarios where Azure Virtual Network service tags cannot be used, the firewall requirements are given below.
Firewall requirements
The following table lists the firewall requirements for scenarios where Azure virtual network service tags can't be used.
| Cloud | Endpoint | Purpose | Port | Direction | Bypass HTTPS inspection |
|---|---|---|---|---|---|
| Azure Commercial | https://login.microsoftonline.com | Authorization server (the Microsoft identity platform) | Port 443 | Outbound | Yes |
| Azure Commercial | https://<data collection endpoint name>.<Azure cloud region>.ingest.monitor.azure.com |
Data collection Endpoint | Port 443 | Outbound | Yes |
| Azure Government | https://login.microsoftonline.us | Authorization server (the Microsoft identity platform) | Port 443 | Outbound | Yes |
| Azure Government | Replace '.com' above with '.us' | Data collection Endpoint | Port 443 | Outbound | Yes |
| Microsoft Azure operated by 21Vianet | https://login.chinacloudapi.cn | Authorization server (the Microsoft identity platform) | Port 443 | Outbound | Yes |
| Microsoft Azure operated by 21Vianet | Replace '.com' above with '.cn' | Data collection Endpoint | Port 443 | Outbound | Yes |
Limitations
- Ingestion into standard tables is limited only to standard tables supported for custom logs ingestion.
- The columns of the input stream in the
streamDeclarationsproperty must start with a letter. If you start a column with other characters (for example@or_), the operation fails. - The
TimeGenerateddatetime field is required. You must include this field in the KQL transform. - For additional possible issues, review the troubleshooting section in the tutorial.
Next steps
In this article, you learned how to use Logstash to connect external data sources to Microsoft Sentinel. To learn more about Microsoft Sentinel, see the following articles:
- Learn how to get visibility into your data and potential threats.
- Get started detecting threats with Microsoft Sentinel, using built-in or custom rules.
Feedback
Coming soon: Throughout 2024 we will be phasing out GitHub Issues as the feedback mechanism for content and replacing it with a new feedback system. For more information see: https://aka.ms/ContentUserFeedback.
Submit and view feedback for