Monitor Azure Virtual WAN
This article describes:
- The types of monitoring data you can collect for this service.
- Ways to analyze that data.
Note
If you're already familiar with this service and/or Azure Monitor and just want to know how to analyze monitoring data, see the Analyze section near the end of this article.
When you have critical applications and business processes that rely on Azure resources, you need to monitor and get alerts for your system. The Azure Monitor service collects and aggregates metrics and logs from every component of your system. Azure Monitor provides you with a view of availability, performance, and resilience, and notifies you of issues. You can use the Azure portal, PowerShell, Azure CLI, REST API, or client libraries to set up and view monitoring data.
- For more information on Azure Monitor, see the Azure Monitor overview.
- For more information on how to monitor Azure resources in general, see Monitor Azure resources with Azure Monitor.
Insights
Some services in Azure have a built-in monitoring dashboard in the Azure portal that provides a starting point for monitoring your service. These dashboards are called insights, and you can find them in the Insights Hub of Azure Monitor in the Azure portal.
Virtual WAN uses Network Insights to provide users and operators with the ability to view the state and status of a Virtual WAN, presented through an autodiscovered topological map. Resource state and status overlays on the map give you a snapshot view of the overall health of the Virtual WAN. You can navigate resources on the map by using one-click access to the resource configuration pages of the Virtual WAN portal. For more information, see Azure Monitor Network Insights for Virtual WAN.
Resource types
Azure uses the concept of resource types and IDs to identify everything in a subscription. Resource types are also part of the resource IDs for every resource running in Azure. For example, one resource type for a virtual machine is Microsoft.Compute/virtualMachines. For a list of services and their associated resource types, see Resource providers.
Azure Monitor similarly organizes core monitoring data into metrics and logs based on resource types, also called namespaces. Different metrics and logs are available for different resource types. Your service might be associated with more than one resource type.
For more information about the resource types for Virtual WAN, see Azure Virtual WAN monitoring data reference.
Data storage
For Azure Monitor:
- Metrics data is stored in the Azure Monitor metrics database.
- Log data is stored in the Azure Monitor logs store. Log Analytics is a tool in the Azure portal that can query this store.
- The Azure activity log is a separate store with its own interface in the Azure portal.
You can optionally route metric and activity log data to the Azure Monitor logs store. You can then use Log Analytics to query the data and correlate it with other log data.
Many services can use diagnostic settings to send metric and log data to other storage locations outside Azure Monitor. Examples include Azure Storage, hosted partner systems, and non-Azure partner systems, by using Event Hubs.
For detailed information on how Azure Monitor stores data, see Azure Monitor data platform.
Azure Monitor platform metrics
Azure Monitor provides platform metrics for most services. These metrics are:
- Individually defined for each namespace.
- Stored in the Azure Monitor time-series metrics database.
- Lightweight and capable of supporting near real-time alerting.
- Used to track the performance of a resource over time.
Collection: Azure Monitor collects platform metrics automatically. No configuration is required.
Routing: You can also usually route platform metrics to Azure Monitor Logs / Log Analytics so you can query them with other log data. For more information, see the Metrics diagnostic setting. For how to configure diagnostic settings for a service, see Create diagnostic settings in Azure Monitor.
For a list of all metrics it's possible to gather for all resources in Azure Monitor, see Supported metrics in Azure Monitor.
For a list of available metrics for Virtual WAN, see Azure Virtual WAN monitoring data reference.
You can view metrics for Virtual WAN by using the Azure portal. The following steps help you locate and view metrics:
Select Monitor Gateway and then Metrics. You can also select Metrics at the bottom to view a dashboard of the most important metrics for site-to-site and point-to-site VPN.

On the Metrics page, you can view the metrics.

To see metrics for the virtual hub router, you can select Metrics from the virtual hub Overview page.
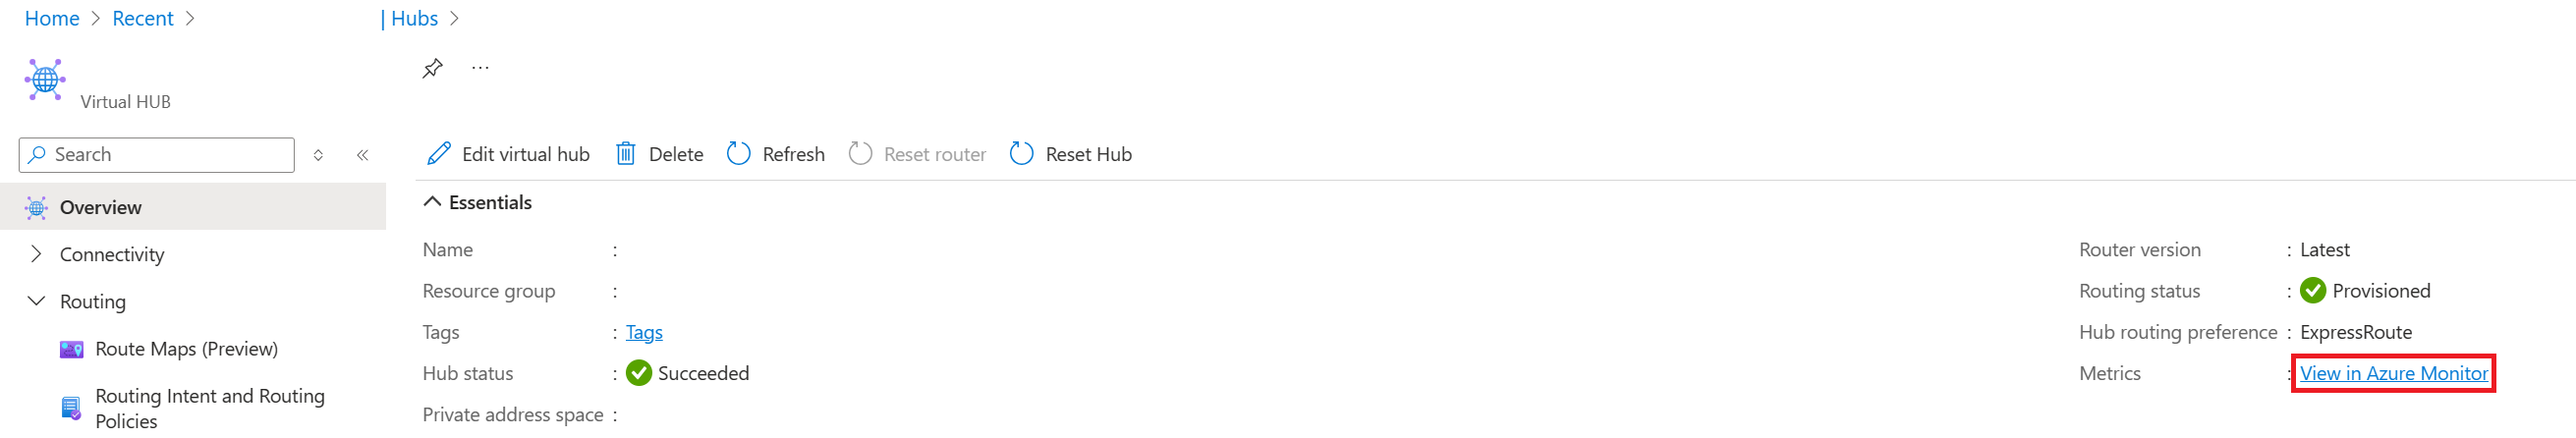


For more information, see Analyze metrics for an Azure resource.
PowerShell steps
You can view metrics for Virtual WAN by using PowerShell. To query, use the following example PowerShell commands.
$MetricInformation = Get-AzMetric -ResourceId "/subscriptions/<SubscriptionID>/resourceGroups/<ResourceGroupName>/providers/Microsoft.Network/VirtualHubs/<VirtualHubName>" -MetricName "VirtualHubDataProcessed" -TimeGrain 00:05:00 -StartTime 2022-2-20T01:00:00Z -EndTime 2022-2-20T01:30:00Z -AggregationType Sum

$MetricInformation.Data
- Resource ID. Your virtual hub's Resource ID can be found on the Azure portal. Navigate to the virtual hub page within vWAN and select JSON View under Essentials.
- Metric Name. Refers to the name of the metric you're querying, which in this case is called
VirtualHubDataProcessed. This metric shows all the data that the virtual hub router processed in the selected time period of the hub. - Time Grain. Refers to the frequency at which you want to see the aggregation. In the current command, you see a selected aggregated unit per 5 mins. You can select – 5M/15M/30M/1H/6H/12H and 1D.
- Start Time and End Time. This time is based on UTC. Ensure that you're entering UTC values when inputting these parameters. If these parameters aren't used, the past one hour's worth of data is shown by default.
- Sum Aggregation Type. The sum aggregation type shows you the total number of bytes that traversed the virtual hub router during a selected time period. For example, if you set the Time granularity to 5 minutes, each data point corresponds to the number of bytes sent in that five-minute interval. To convert this value to Gbps, you can divide this number by 37500000000. Based on the virtual hub's capacity, the hub router can support between 3 Gbps and 50 Gbps. The Max and Min aggregation types aren't meaningful at this time.
Azure Monitor resource logs
Resource logs provide insight into operations that were done by an Azure resource. Logs are generated automatically, but you must route them to Azure Monitor logs to save or query them. Logs are organized in categories. A given namespace might have multiple resource log categories.
Collection: Resource logs aren't collected and stored until you create a diagnostic setting and route the logs to one or more locations. When you create a diagnostic setting, you specify which categories of logs to collect. There are multiple ways to create and maintain diagnostic settings, including the Azure portal, programmatically, and though Azure Policy.
Routing: The suggested default is to route resource logs to Azure Monitor Logs so you can query them with other log data. Other locations such as Azure Storage, Azure Event Hubs, and certain Microsoft monitoring partners are also available. For more information, see Azure resource logs and Resource log destinations.
For detailed information about collecting, storing, and routing resource logs, see Diagnostic settings in Azure Monitor.
For a list of all available resource log categories in Azure Monitor, see Supported resource logs in Azure Monitor.
All resource logs in Azure Monitor have the same header fields, followed by service-specific fields. The common schema is outlined in Azure Monitor resource log schema.
For the available resource log categories, their associated Log Analytics tables, and the log schemas for Virtual WAN, see Azure Virtual WAN monitoring data reference.
Schemas
For detailed description of the top-level diagnostic logs schema, see Supported services, schemas, and categories for Azure Diagnostic Logs.
When you review any metrics through Log Analytics, the output contains the following columns:
| Column | Type | Description |
|---|---|---|
| TimeGrain | string | PT1M (metric values are pushed every minute) |
| Count | real | Usually equal to 2 (each MSEE pushes a single metric value every minute) |
| Minimum | real | The minimum of the two metric values pushed by the two MSEEs |
| Maximum | real | The maximum of the two metric values pushed by the two MSEEs |
| Average | real | Equal to (Minimum + Maximum)/2 |
| Total | real | Sum of the two metric values from both MSEEs (the main value to focus on for the metric queried) |
Create diagnostic setting to view logs
The following steps help you create, edit, and view diagnostic settings:
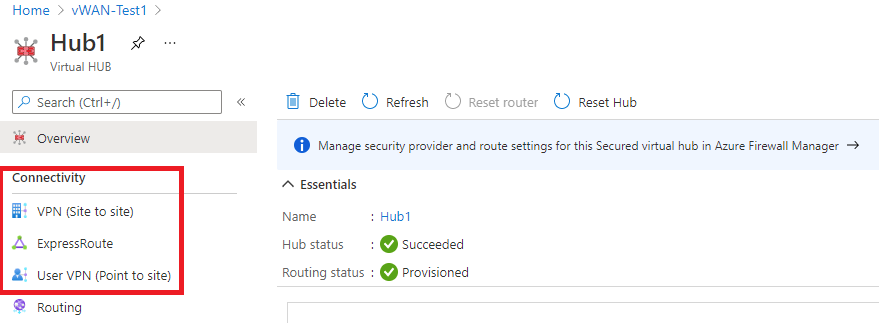
In the portal, navigate to your Virtual WAN resource, then select Hubs in the Connectivity group.

Under the Connectivity group on the left, select the gateway for which you want to examine diagnostics:
On the right part of the page, select Monitor Gateway and then Logs.
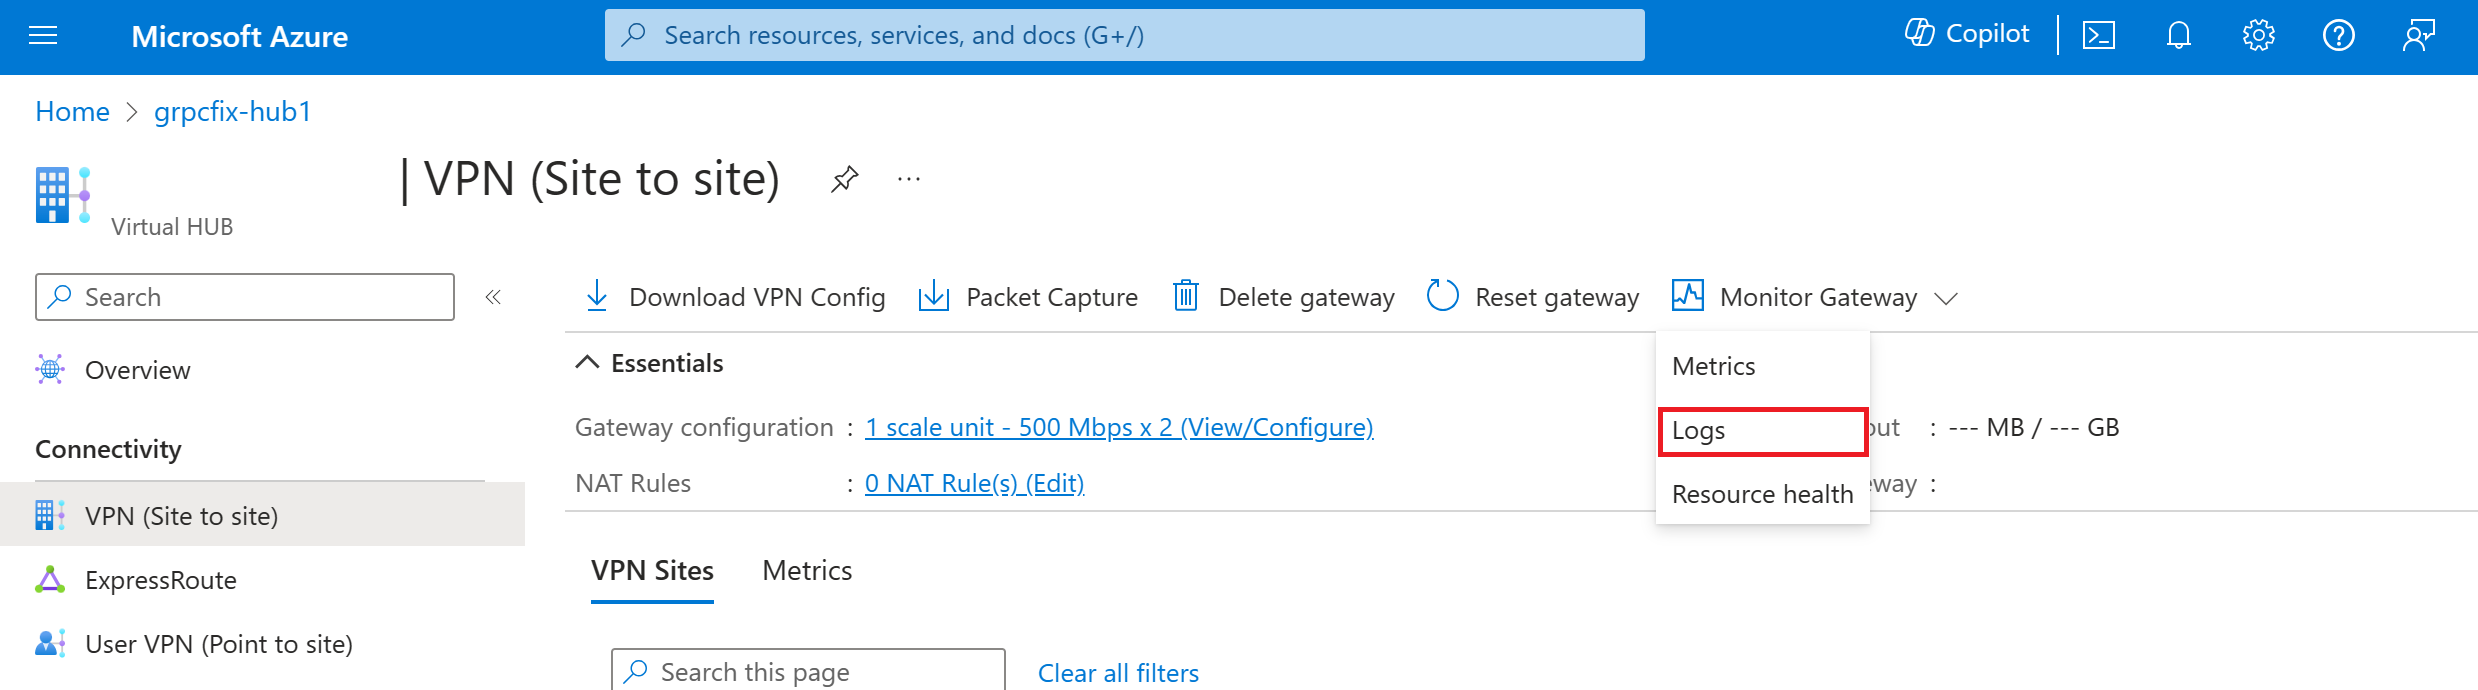
In this page, you can create a new diagnostic setting (+Add diagnostic setting) or edit an existing one (Edit setting). You can choose to send the diagnostic logs to Log Analytics (as shown in the following example), stream to an event hub, send to a 3rd-party solution, or archive to a storage account.
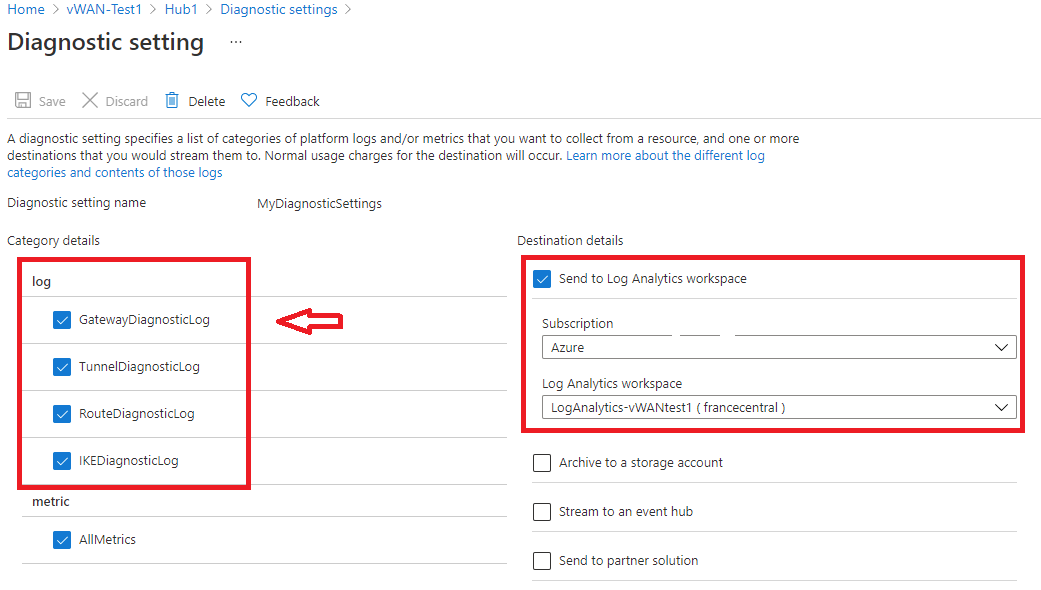
After clicking Save, you should start seeing logs appear in this log analytics workspace within a few hours.
To monitor a secured hub (with Azure Firewall), then diagnostics and logging configuration must be done from accessing the Diagnostic Setting tab:
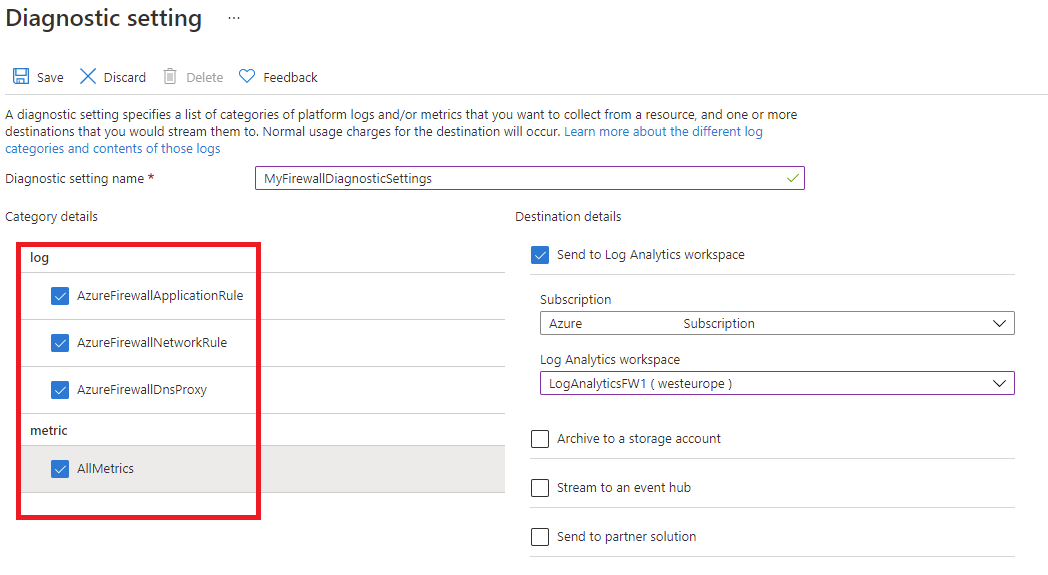


Important
Enabling these settings requires additional Azure services (storage account, event hub, or Log Analytics), which may increase your cost. To calculate an estimated cost, visit the Azure pricing calculator.
Monitoring secured hub (Azure Firewall)
If you chose to secure your virtual hub using Azure Firewall, relevant logs and metrics are available here: Azure Firewall logs and metrics.
You can monitor the Secured Hub using Azure Firewall logs and metrics. You can also use activity logs to audit operations on Azure Firewall resources. For every Azure Virtual WAN you secure and convert to a Secured Hub, Azure Firewall creates an explicit firewall resource object. The object is in the resource group where the hub is located.

Azure activity log
The activity log contains subscription-level events that track operations for each Azure resource as seen from outside that resource; for example, creating a new resource or starting a virtual machine.
Collection: Activity log events are automatically generated and collected in a separate store for viewing in the Azure portal.
Routing: You can send activity log data to Azure Monitor Logs so you can analyze it alongside other log data. Other locations such as Azure Storage, Azure Event Hubs, and certain Microsoft monitoring partners are also available. For more information on how to route the activity log, see Overview of the Azure activity log.
Analyze monitoring data
There are many tools for analyzing monitoring data.
Azure Monitor tools
Azure Monitor supports the following basic tools:
Metrics explorer, a tool in the Azure portal that allows you to view and analyze metrics for Azure resources. For more information, see Analyze metrics with Azure Monitor metrics explorer.
Log Analytics, a tool in the Azure portal that allows you to query and analyze log data by using the Kusto query language (KQL). For more information, see Get started with log queries in Azure Monitor.
The activity log, which has a user interface in the Azure portal for viewing and basic searches. To do more in-depth analysis, you have to route the data to Azure Monitor logs and run more complex queries in Log Analytics.
Tools that allow more complex visualization include:
- Dashboards that let you combine different kinds of data into a single pane in the Azure portal.
- Workbooks, customizable reports that you can create in the Azure portal. Workbooks can include text, metrics, and log queries.
- Grafana, an open platform tool that excels in operational dashboards. You can use Grafana to create dashboards that include data from multiple sources other than Azure Monitor.
- Power BI, a business analytics service that provides interactive visualizations across various data sources. You can configure Power BI to automatically import log data from Azure Monitor to take advantage of these visualizations.
Azure Monitor export tools
You can get data out of Azure Monitor into other tools by using the following methods:
Metrics: Use the REST API for metrics to extract metric data from the Azure Monitor metrics database. The API supports filter expressions to refine the data retrieved. For more information, see Azure Monitor REST API reference.
Logs: Use the REST API or the associated client libraries.
Another option is the workspace data export.
To get started with the REST API for Azure Monitor, see Azure monitoring REST API walkthrough.
Kusto queries
You can analyze monitoring data in the Azure Monitor Logs / Log Analytics store by using the Kusto query language (KQL).
Important
When you select Logs from the service's menu in the portal, Log Analytics opens with the query scope set to the current service. This scope means that log queries will only include data from that type of resource. If you want to run a query that includes data from other Azure services, select Logs from the Azure Monitor menu. See Log query scope and time range in Azure Monitor Log Analytics for details.
For a list of common queries for any service, see the Log Analytics queries interface.
Alerts
Azure Monitor alerts proactively notify you when specific conditions are found in your monitoring data. Alerts allow you to identify and address issues in your system before your customers notice them. For more information, see Azure Monitor alerts.
There are many sources of common alerts for Azure resources. For examples of common alerts for Azure resources, see Sample log alert queries. The Azure Monitor Baseline Alerts (AMBA) site provides a semi-automated method of implementing important platform metric alerts, dashboards, and guidelines. The site applies to a continually expanding subset of Azure services, including all services that are part of the Azure Landing Zone (ALZ).
The common alert schema standardizes the consumption of Azure Monitor alert notifications. For more information, see Common alert schema.
Types of alerts
You can alert on any metric or log data source in the Azure Monitor data platform. There are many different types of alerts depending on the services you're monitoring and the monitoring data you're collecting. Different types of alerts have various benefits and drawbacks. For more information, see Choose the right monitoring alert type.
The following list describes the types of Azure Monitor alerts you can create:
- Metric alerts evaluate resource metrics at regular intervals. Metrics can be platform metrics, custom metrics, logs from Azure Monitor converted to metrics, or Application Insights metrics. Metric alerts can also apply multiple conditions and dynamic thresholds.
- Log alerts allow users to use a Log Analytics query to evaluate resource logs at a predefined frequency.
- Activity log alerts trigger when a new activity log event occurs that matches defined conditions. Resource Health alerts and Service Health alerts are activity log alerts that report on your service and resource health.
Some Azure services also support smart detection alerts, Prometheus alerts, or recommended alert rules.
For some services, you can monitor at scale by applying the same metric alert rule to multiple resources of the same type that exist in the same Azure region. Individual notifications are sent for each monitored resource. For supported Azure services and clouds, see Monitor multiple resources with one alert rule.
Note
If you're creating or running an application that runs on your service, Azure Monitor application insights might offer more types of alerts.
Virtual WAN alert rules
You can set alerts for any metric, log entry, or activity log entry listed in the Azure Virtual WAN monitoring data reference.
Monitoring Azure Virtual WAN - Best practices
This article provides configuration best practices for monitoring Virtual WAN and the different components that can be deployed with it. The recommendations presented in this article are mostly based on existing Azure Monitor metrics and logs generated by Azure Virtual WAN. For a list of metrics and logs collected for Virtual WAN, see the Monitoring Virtual WAN data reference.
Most of the recommendations in this article suggest creating Azure Monitor alerts. Azure Monitor alerts proactively notify you when there's an important event in the monitoring data. This information helps you address the root cause quicker and ultimately reduce downtime. To learn how to create a metric alert, see Tutorial: Create a metric alert for an Azure resource. To learn how to create a log query alert, see Tutorial: Create a log query alert for an Azure resource.
Virtual WAN gateways
This section describes best practices for Virtual WAN gateways.
Site-to-site VPN gateway
Design checklist – metric alerts
- Create alert rule for increase in Tunnel Egress and/or Ingress packet count drop.
- Create alert rule to monitor BGP peer status.
- Create alert rule to monitor number of BGP routes advertised and learned.
- Create alert rule for VPN gateway overutilization.
- Create alert rule for tunnel overutilization.
| Recommendation | Description |
|---|---|
| Create alert rule for increase in Tunnel Egress and/or Ingress packet drop count. | An increase in tunnel egress and/or ingress packet drop count might indicate an issue with the Azure VPN gateway, or with the remote VPN device. Select the Tunnel Egress/Ingress Packet drop count metric when creating alert rules. Define a static Threshold value greater than 0 and the Total aggregation type when configuring the alert logic. You can choose to monitor the Connection as a whole, or split the alert rule by Instance and Remote IP to be alerted for issues involving individual tunnels. To learn the difference between the concept of VPN connection, link, and tunnel in Virtual WAN, see the Virtual WAN FAQ. |
| Create alert rule to monitor BGP peer status. | When using BGP in your site-to-site connections, it's important to monitor the health of the BGP peerings between the gateway instances and the remote devices, as recurrent failures can disrupt connectivity. Select the BGP Peer Status metric when creating the alert rule. Using a static threshold, choose the Average aggregation type and configure the alert to be triggered whenever the value is less than 1. We recommend that you split the alert by Instance and BGP Peer Address to detect issues with individual peerings. Avoid selecting the gateway instance IPs as BGP Peer Address because this metric monitors the BGP status for every possible combination, including with the instance itself (which is always 0). |
| Create alert rule to monitor number of BGP routes advertised and learned. | BGP Routes Advertised and BGP Routes Learned monitor the number of routes advertised to and learned from peers by the VPN gateway, respectively. If these metrics drop to zero unexpectedly, it could be because there’s an issue with the gateway or with on-premises. We recommend that you configure an alert for both these metrics to be triggered whenever their value is zero. Choose the Total aggregation type. Split by Instance to monitor individual gateway instances. |
| Create alert rule for VPN gateway overutilization. | The number of scale units per instance determines a VPN gateway’s aggregate throughput. All tunnels that terminate in the same gateway instance share its aggregate throughput. It's likely that tunnel stability will be affected if an instance is working at its capacity for a long period of time. Select Gateway S2S Bandwidth when creating the alert rule. Configure the alert to be triggered whenever the Average throughput is greater than a value that is close to the maximum aggregate throughput of both instances. Alternatively, split the alert by instance and use the maximum throughput per instance as a reference. It's good practice to determine the throughput needs per tunnel in advance in order to choose the appropriate number of scale units. To learn more about the supported scale unit values for site-to-site VPN gateways, see the Virtual WAN FAQ. |
| Create alert rule for tunnel overutilization. | The scale units of the gateway instance where it terminates determines the maximum throughput allowed per tunnel. You might want to be alerted if a tunnel is at risk of nearing its maximum throughput, which can lead to performance and connectivity issues. Act proactively by investigating the root cause of the increased tunnel utilization or by increasing the gateway’s scale units. Select Tunnel Bandwidth when creating the alert rule. Split by Instance and Remote IP to monitor all individual tunnels or choose specific tunnels instead. Configure the alert to be triggered whenever the Average throughput is greater than a value that is close to the maximum throughput allowed per tunnel. To learn more about how the gateway’s scale units impact a tunnel’s maximum throughput, see the Virtual WAN FAQ. |
Design checklist - log query alerts
To configure log-based alerts, you must first create a diagnostic setting for your site-to-site/point-to-site VPN gateway. A diagnostic setting is where you define what logs and/or metrics you want to collect and how you want to store that data to be analyzed later. Unlike gateway metrics, gateway logs aren't available if there's no diagnostic setting configured. To learn how to create a diagnostic setting, see Create diagnostic setting to view logs.
- Create tunnel disconnect alert rule.
- Create BGP disconnect alert rule.
| Recommendation | Description |
|---|---|
| Create tunnel disconnect alert rule. | Use Tunnel Diagnostic Logs to track disconnect events in your site-to-site connections. A disconnect event can be due to a failure to negotiate SAs, unresponsiveness of the remote VPN device, among other causes. Tunnel Diagnostic Logs also provide the disconnect reason. See the Create tunnel disconnect alert rule - log query below this table to select disconnect events when creating the alert rule. Configure the alert to be triggered whenever the number of rows resulting from running the query is greater than 0. For this alert to be effective, select Aggregation Granularity to be between 1 and 5 minutes and the Frequency of evaluation to also be between 1 and 5 minutes. This way, after the Aggregation Granularity interval passes, the number of rows is 0 again for a new interval. For troubleshooting tips when analyzing Tunnel Diagnostic Logs, see Troubleshoot Azure VPN gateway using diagnostic logs. Additionally, use IKE Diagnostic Logs to complement your troubleshooting, as these logs contain detailed IKE-specific diagnostics. |
| Create BGP disconnect alert rule. | Use Route Diagnostic Logs to track route updates and issues with BGP sessions. Repeated BGP disconnect events can affect connectivity and cause downtime. See the Create BGP disconnect rule alert- log query below this table to select disconnect events when creating the alert rule. Configure the alert to be triggered whenever the number of rows resulting from running the query is greater than 0. For this alert to be effective, select Aggregation Granularity to be between 1 and 5 minutes and the Frequency of evaluation to also be between 1 and 5 minutes. This way, after the Aggregation Granularity interval has passes, the number of rows is 0 again for a new interval if the BGP sessions are restored. For more information about the data collected by Route Diagnostic Logs, see Troubleshooting Azure VPN Gateway using diagnostic logs. |
Log queries
Create tunnel disconnect alert rule - log query: The following log query can be used to select tunnel disconnect events when creating the alert rule:
AzureDiagnostics
| where Category == "TunnelDiagnosticLog"
| where OperationName == "TunnelDisconnected"
Create BGP disconnect rule alert- log query: The following log query can be used to select BGP disconnect events when creating the alert rule:
AzureDiagnostics
| where Category == "RouteDiagnosticLog"
| where OperationName == "BgpDisconnectedEvent"
Point-to-site VPN gateway
The following section details the configuration of metric-based alerts only. However, Virtual WAN point-to-site gateways also support diagnostic logs. To learn more about the available diagnostic logs for point-to-site gateways, see Virtual WAN point-to-site VPN gateway diagnostics.
Design checklist - metric alerts
- Create alert rule for gateway overutilization.
- Create alert for P2S connection count nearing limit.
- Create alert for User VPN route count nearing limit.
| Recommendation | Description |
|---|---|
| Create alert rule for gateway overutilization. | The number of scale units configured determines the bandwidth of a point-to-site gateway. To learn more about point-to-site gateway scale units, see Point-to-site (User VPN). Use the Gateway P2S Bandwidth metric to monitor the gateway’s utilization and configure an alert rule that is triggered whenever the gateway’s bandwidth is greater than a value near its aggregate throughput – for example, if the gateway was configured with 2 scale units, it has an aggregate throughput of 1 Gbps. In this case, you could define a threshold value of 950 Mbps. Use this alert to proactively investigate the root cause of the increased utilization, and ultimately increase the number of scale units, if needed. Select the Average aggregation type when configuring the alert rule. |
| Create alert for P2S connection count nearing limit | The maximum number of point-to-site connections allowed is also determined by the number of scale units configured on the gateway. To learn more about point-to-site gateway scale units, see the FAQ for Point-to-site (User VPN). Use the P2S Connection Count metric to monitor the number of connections. Select this metric to configure an alert rule that is triggered whenever the number of connections is nearing the maximum allowed. For example, a 1-scale unit gateway supports up to 500 concurrent connections. In this case, you could configure the alert to be triggered whenever the number of connections is greater than 450. Use this alert to determine whether an increase in the number of scale units is required or not. Choose the Total aggregation type when configuring the alert rule. |
| Create alert rule for User VPN routes count nearing limit. | The protocol used determines the maximum number of User VPN routes. IKEv2 has a protocol-level limit of 255 routes, whereas OpenVPN has a limit of 1,000 routes. To learn more about this fact, see VPN server configuration concepts. You might want to be alerted if you’re close to hitting the maximum number of User VPN routes and act proactively to avoid any downtime. Use the User VPN Route Count to monitor this situation and configure an alert rule that is triggered whenever the number of routes surpasses a value close to the limit. For example, if the limit is 255 routes, an appropriate Threshold value could be 230. Choose the Total aggregation type when configuring the alert rule. |
ExpressRoute gateway
The following section focuses on metric-based alerts. In addition to the alerts described here, which focus on the gateway component, we recommend that you use the available metrics, logs, and tools to monitor the ExpressRoute circuit. To learn more about ExpressRoute monitoring, see ExpressRoute monitoring, metrics, and alerts. To learn about how you can use the ExpressRoute Traffic Collector tool, see Configure ExpressRoute Traffic Collector for ExpressRoute Direct.
Design checklist - metric alerts
- Create alert rule for bits received per second.
- Create alert rule for CPU overutilization.
- Create alert rule for packets per second.
- Create alert rule for number of routes advertised to peer.
- Count alert rule for number of routes learned from peer.
- Create alert rule for high frequency in route changes.
| Recommendation | Description |
|---|---|
| Create alert rule for Bits Received Per Second. | Bits Received per Second monitors the total amount of traffic received by the gateway from the MSEEs. You might want to be alerted if the amount of traffic received by the gateway is at risk of hitting its maximum throughput. This situation can lead to performance and connectivity issues. This approach allows you to act proactively by investigating the root cause of the increased gateway utilization or increasing the gateway’s maximum allowed throughput. Choose the Average aggregation type and a Threshold value close to the maximum throughput provisioned for the gateway when configuring the alert rule. Additionally, we recommend that you set an alert when the number of Bits Received per Second is near zero, as it might indicate an issue with the gateway or the MSEEs. The number of scale units provisioned determines the maximum throughput of an ExpressRoute gateway. To learn more about ExpressRoute gateway performance, see About ExpressRoute connections in Azure Virtual WAN. |
| Create alert rule for CPU overutilization. | When using ExpressRoute gateways, it's important to monitor the CPU utilization. Prolonged high utilization can affect performance and connectivity. Use the CPU utilization metric to monitor utilization and create an alert for whenever the CPU utilization is greater than 80%, so you can investigate the root cause and ultimately increase the number of scale units, if needed. Choose the Average aggregation type when configuring the alert rule. To learn more about ExpressRoute gateway performance, see About ExpressRoute connections in Azure Virtual WAN. |
| Create alert rule for packets received per second. | Packets per second monitors the number of inbound packets traversing the Virtual WAN ExpressRoute gateway. You might want to be alerted if the number of packets per second is nearing the limit allowed for the number of scale units configured on the gateway. Choose the Average aggregation type when configuring the alert rule. Choose a Threshold value close to the maximum number of packets per second allowed based on the number of scale units of the gateway. To learn more about ExpressRoute performance, see About ExpressRoute connections in Azure Virtual WAN. Additionally, we recommend that you set an alert when the number of Packets per second is near zero, as it might indicate an issue with the gateway or MSEEs. |
| Create alert rule for number of routes advertised to peer. | Count of Routes Advertised to Peers monitors the number of routes advertised from the ExpressRoute gateway to the virtual hub router and to the Microsoft Enterprise Edge Devices. We recommend that you add a filter to only select the two BGP peers displayed as ExpressRoute Device and create an alert to identify when the count of advertised routes approaches the documented limit of 1000. For example, configure the alert to be triggered when the number of routes advertised is greater than 950. We also recommend that you configure an alert when the number of routes advertised to the Microsoft Edge Devices is zero in order to proactively detect any connectivity issues. To add these alerts, select the Count of Routes Advertised to Peers metric, and then select the Add filter option and the ExpressRoute devices. |
| Create alert rule for number of routes learned from peer. | Count of Routes Learned from Peers monitors the number of routes the ExpressRoute gateway learns from the virtual hub router and from the Microsoft Enterprise Edge Device. We recommend that you add a filter to only select the two BGP peers displayed as ExpressRoute Device and create an alert to identify when the count of learned routes approaches the documented limit of 4000 for Standard SKU and 10,000 for Premium SKU circuits. We also recommend that you configure an alert when the number of routes advertised to the Microsoft Edge Devices is zero. This approach can help in detecting when your on-premises stops advertising routes. |
| Create alert rule for high frequency in route changes. | Frequency of Routes changes shows the change frequency of routes being learned and advertised from and to peers, including other types of branches such as site-to-site and point-to-site VPN. This metric provides visibility when a new branch or more circuits are being connected/disconnected. This metric is a useful tool when identifying issues with BGP advertisements, such as flaplings. We recommend that you to set an alert if the environment is static and BGP changes aren't expected. Select a threshold value that is greater than 1 and an Aggregation Granularity of 15 minutes to monitor BGP behavior consistently. If the environment is dynamic and BGP changes are frequently expected, you might choose not to set an alert otherwise in order to avoid false positives. However, you can still consider this metric for observability of your network. |
Virtual hub
The following section focuses on metrics-based alerts for virtual hubs.
Design checklist - metric alerts
- Create alert rule for BGP peer status
| Recommendation | Description |
|---|---|
| Create alert rule to monitor BGP peer status. | Select the BGP Peer Status metric when creating the alert rule. Using a static threshold, choose the Average aggregation type and configure the alert to be triggered whenever the value is less than 1. This approach allows you to identify when the virtual hub router is having connectivity issues with ExpressRoute, Site-to-Site VPN, and Point-to-Site VPN gateways deployed in the hub. |
Azure Firewall
This section of the article focuses on metric-based alerts. Azure Firewall offers a comprehensive list of metrics and logs for monitoring purposes. In addition to configuring the alerts described in the following section, explore how Azure Firewall Workbook can help monitor your Azure Firewall. Also, explore the benefits of connecting Azure Firewall logs to Microsoft Sentinel using Azure Firewall connector for Microsoft Sentinel.
Design checklist - metric alerts
- Create alert rule for risk of SNAT port exhaustion.
- Create alert rule for firewall overutilization.
| Recommendation | Description |
|---|---|
| Create alert rule for risk of SNAT port exhaustion. | Azure Firewall provides 2,496 SNAT ports per public IP address configured per backend virtual machine scale instance. It’s important to estimate in advance the number of SNAT ports that can fulfill your organizational requirements for outbound traffic to the Internet. Not doing so increases the risk of exhausting the number of available SNAT ports on the Azure Firewall, potentially causing outbound connectivity failures. Use the SNAT port utilization metric to monitor the percentage of outbound SNAT ports currently in use. Create an alert rule for this metric to be triggered whenever this percentage surpasses 95% (due to an unforeseen traffic increase, for example) so you can act accordingly by configuring another public IP address on the Azure Firewall, or by using an Azure NAT Gateway instead. Use the Maximum aggregation type when configuring the alert rule. To learn more about how to interpret the SNAT port utilization metric, see Overview of Azure Firewall logs and metrics. To learn more about how to scale SNAT ports in Azure Firewall, see Scale SNAT ports with Azure NAT Gateway. |
| Create alert rule for firewall overutilization. | Azure Firewall maximum throughput differs depending on the SKU and features enabled. To learn more about Azure Firewall performance, see Azure Firewall performance. You might want to be alerted if your firewall is nearing its maximum throughput. You can troubleshoot the underlying cause, because this situation can affect the firewall’s performance. Create an alert rule to be triggered whenever the Throughput metric surpasses a value nearing the firewall’s maximum throughput – if the maximum throughput is 30 Gbps, configure 25 Gbps as the Threshold value, for example. The Throughput metric unit is bits/sec. Choose the Average aggregation type when creating the alert rule. |
Resource Health Alerts
You can also configure Resource Health Alerts via Service Health for the below resources. This approach ensures you're informed of the availability of your Virtual WAN environment. The alerts allow you to troubleshoot whether networking issues are due to your Azure resources entering an unhealthy state, as opposed to issues from your on-premises environment. We recommend that you configure alerts when the resource status becomes degraded or unavailable. If the resource status does become degraded/unavailable, you can analyze if there are any recent spikes in the amount of traffic processed by these resources, the routes advertised to these resources, or the number of branch/VNet connections created. For more information about limits supported in Virtual WAN, see Azure Virtual WAN limits.
- Microsoft.Network/vpnGateways
- Microsoft.Network/expressRouteGateways
- Microsoft.Network/azureFirewalls
- Microsoft.Network/virtualHubs
- Microsoft.Network/p2sVpnGateways
Related content
- See Azure Virtual WAN monitoring data reference for a reference of the metrics, logs, and other important values created for Virtual WAN.
- See Monitoring Azure resources with Azure Monitor for general details on monitoring Azure resources.