To verify that applications and services are performing correctly, you can use the Health Endpoint Monitoring pattern. This pattern specifies the use of functional checks in an application. External tools can access these checks at regular intervals through exposed endpoints.
Context and problem
It's a good practice to monitor web applications and back-end services. Monitoring helps ensure that applications and services are available and performing correctly. Business requirements often include monitoring.
It's sometimes more difficult to monitor cloud services than on-premises services. One reason is that you don't have full control of the hosting environment. Another is that the services typically depend on other services that platform vendors and others provide.
Many factors affect cloud-hosted applications. Examples include network latency, the performance and availability of the underlying compute and storage systems, and the network bandwidth between them. A service can fail entirely or partially due to any of these factors. To ensure a required level of availability, you must verify at regular intervals that your service performs correctly. Your service level agreement (SLA) might specify the level that you need to meet.
Solution
Implement health monitoring by sending requests to an endpoint on your application. The application should perform the necessary checks and then return an indication of its status.
A health monitoring check typically combines two factors:
- The checks (if any) that the application or service performs in response to the request to the health verification endpoint
- The analysis of the results by the tool or framework that performs the health verification check
The response code indicates the status of the application. Optionally, the response code also provides the status of components and services that the app uses. The monitoring tool or framework performs the latency or response time check.
The following figure provides an overview of the pattern.
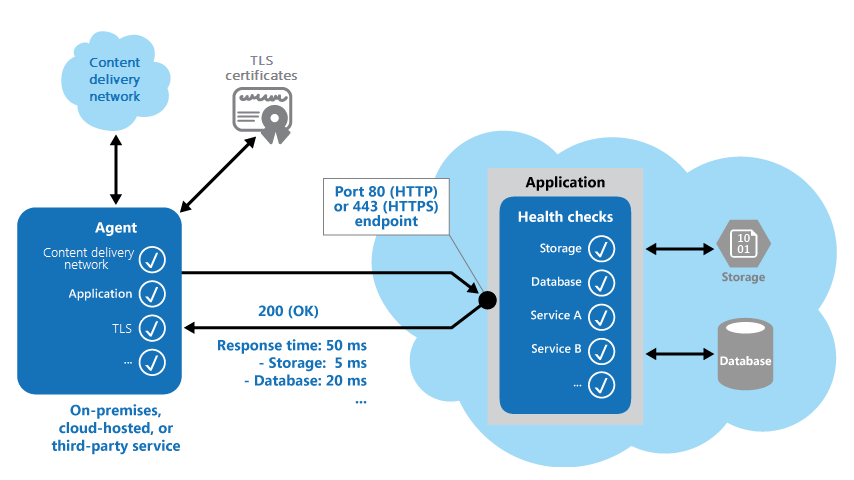
The health monitoring code in the application might also run other checks to determine:
- The availability and response time of cloud storage or a database.
- The status of other resources or services that the application uses. These resources and services might be in the application or outside it.
Services and tools are available that monitor web applications by submitting a request to a configurable set of endpoints. These services and tools then evaluate the results against a set of configurable rules. It's relatively easy to create a service endpoint for the sole purpose of performing some functional tests on a system.
Typical checks that monitoring tools perform include:
- Validating the response code. For example, an HTTP response of 200 (OK) indicates that the application responded without error. The monitoring system might also check for other response codes to give more comprehensive results.
- Checking the content of the response to detect errors, even when the status code is 200 (OK). By checking the content, you can detect errors that affect only a section of the returned web page or service response. For example, you might check the title of a page or look for a specific phrase that indicates that the app returned the correct page.
- Measuring the response time. The value includes the network latency and the time that the application took to issue the request. An increasing value can indicate an emerging problem with the application or network.
- Checking resources or services that are located outside the application. An example is a content delivery network that the application uses to deliver content from global caches.
- Checking for the expiration of TLS certificates.
- Measuring the response time of a DNS lookup for the URL of the application. This check measures DNS latency and DNS failures.
- Validating the URL that a DNS lookup returns. By validating, you can ensure that entries are correct. You can also help prevent malicious request redirection that might result after an attack on your DNS server.
Where possible, it's also useful to run these checks from different on-premises or hosted locations and then compare response times. Ideally, you should monitor applications from locations that are close to customers. Then you get an accurate view of the performance from each location. This practice provides a more robust checking mechanism. The results can also help you make the following decisions:
- Where to deploy your application
- Whether to deploy it in more than one datacenter
To ensure that your application works correctly for all customers, run tests against all the service instances that customers use. For example, if customer storage is spread across more than one storage account, the monitoring process should check each account.
Issues and considerations
Consider the following points when you decide how to implement this pattern:
Think about how to validate the response. For example, determine whether a 200 (OK) status code is sufficient to verify that the application is working correctly. Checking the status code is the minimum implementation of this pattern. A status code provides a basic measure of application availability. But a code supplies little information about the operations, trends, and possible upcoming issues in the application.
Determine the number of endpoints to expose for an application. One approach is to expose at least one endpoint for the core services that the application uses and another for lower-priority services. With this approach, you can assign different levels of importance to each monitoring result. Also consider exposing extra endpoints. You can expose one for each core service to increase monitoring granularity. For example, a health verification check might check the database, the storage, and an external geocoding service that an application uses. Each might require a different level of uptime and response time. The geocoding service or some other background task might be unavailable for a few minutes. But the application might still be healthy.
Decide whether to use the same endpoint for monitoring and for general access. You can use the same endpoint for both but design a specific path for health verification checks. For example, you can use /health on the general access endpoint. With this approach, monitoring tools can run some functional tests in the application. Examples include registering a new user, signing in, and placing a test order. At the same time, you can also verify that the general access endpoint is available.
Determine the type of information to collect in the service in response to monitoring requests. You also need to determine how to return this information. Most existing tools and frameworks look only at the HTTP status code that the endpoint returns. To return and validate additional information, you might have to create a custom monitoring utility or service.
Figure out how much information to collect. Performing excessive processing during the check can overload the application and affect other users. The processing time might also exceed the timeout of the monitoring system. As a result, the system might mark the application as unavailable. Most applications include instrumentation such as error handlers and performance counters. These tools can log performance and detailed error information, which might be sufficient. Consider using this data instead of returning additional information from a health verification check.
Consider caching the endpoint status. Running the health check frequently might be expensive. For example, if the health status is reported through a dashboard, you don't want every request to the dashboard to trigger a health check. Instead, periodically check the system health, and cache the status. Expose an endpoint that returns the cached status.
Plan how to configure security for the monitoring endpoints. By configuring security, you can help protect the endpoints from public access, which might:
- Expose the application to malicious attacks.
- Risk the exposure of sensitive information.
- Attract denial of service (DoS) attacks.
Typically, you configure security in the application configuration. Then you can update the settings easily without restarting the application. Consider using one or more of the following techniques:
Secure the endpoint by requiring authentication. If the monitoring service or tool supports authentication, you can use an authentication security key in the request header. You can also pass credentials with the request. When you use authentication, consider how to access your health check endpoints. As an example, Azure App Service has a built-in health check that integrates with App Service authentication and authorization features.
Use an obscure or hidden endpoint. For example, expose the endpoint on a different IP address than the one that the default application URL uses. Configure the endpoint on a nonstandard HTTP port. Also, consider using a complex path to your test page. You can usually specify extra endpoint addresses and ports in the application configuration. If necessary, you can add entries for these endpoints to the DNS server. Then you avoid having to specify the IP address directly.
Expose a method on an endpoint that accepts a parameter such as a key value or an operation mode value. When a request arrives, the code can run specific tests that depend on the value of the parameter. The code can return a 404 (Not Found) error if it doesn't recognize the parameter value. Make it possible to define parameter values in the application configuration.
Use a separate endpoint that performs basic functional tests without compromising the operation of the application. With this approach, you can help reduce the impact of a DoS attack. Ideally, avoid using a test that might expose sensitive information. Sometimes you must return information that might be useful to an attacker. In this case, consider how to protect the endpoint and the data from unauthorized access. Relying on obscurity isn't enough. Consider also using an HTTPS connection and encrypting sensitive data, although this approach increases the load on the server.
Decide how to ensure that the monitoring agent is performing correctly. One approach is to expose an endpoint that returns a value from the application configuration or a random value that you can use to test the agent. Also ensure that the monitoring system performs checks on itself. You can use a self-test or built-in test to prevent the monitoring system from issuing false positive results.
When to use this pattern
This pattern is useful for:
- Monitoring websites and web applications to verify availability.
- Monitoring websites and web applications to check for correct operation.
- Monitoring middle-tier or shared services to detect and isolate failures that can disrupt other applications.
- Complementing existing instrumentation in the application, such as performance counters and error handlers. Health verification checking doesn't replace application requirements for logging and auditing. Instrumentation can provide valuable information for an existing framework that monitors counters and error logs to detect failures or other issues. But instrumentation can't provide information if an application is unavailable.
Workload design
An architect should evaluate how the Health Endpoint Monitoring pattern can be used in their workload's design to address the goals and principles covered in the Azure Well-Architected Framework pillars. For example:
| Pillar | How this pattern supports pillar goals |
|---|---|
| Reliability design decisions help your workload become resilient to malfunction and to ensure that it recovers to a fully functioning state after a failure occurs. | These endpoints support a workload's reliability alerting and dashboarding efforts. They can also be used it as a signal for self-healing remediation. - RE:07 Self-healing and self-preservation - RE:10 Monitoring and alerting strategy |
| Operational Excellence helps deliver workload quality through standardized processes and team cohesion. | Standardizing which health endpoints to expose, and the level of detail in the results, across your workload will help you triage issues. - OE:07 Monitoring system |
| Performance Efficiency helps your workload efficiently meet demands through optimizations in scaling, data, code. | Health endpoints improve load balancing logic by routing traffic to only nodes that are verified as healthy. With additional configuration, you can also get metrics on available node capacity. - PE:05 Scaling and partitioning |
As with any design decision, consider any tradeoffs against the goals of the other pillars that might be introduced with this pattern.
Example
You can use the ASP.NET health checks middleware and libraries to report the health of app infrastructure components. This framework provides a way to report health checks in a consistent way. It implements many of the practices that this article describes. For instance, the ASP.NET health checks include external checks like database connectivity and specific concepts like liveness and readiness probes.
Several example implementations that use ASP.NET health checks are available on GitHub.
Monitor endpoints in Azure-hosted applications
Options for monitoring endpoints in Azure applications include:
- Use the built-in monitoring features of Azure, such as Azure Monitor.
- Use a third-party service or a framework like Microsoft System Center Operations Manager.
- Create a custom utility or a service that runs on your own server or a hosted server.
Even though Azure provides comprehensive monitoring options, you can use additional services and tools to provide extra information. Application Insights, a feature of Monitor, is designed for development teams. This feature helps you understand how your app performs and how it's used. Application Insights monitors request rates, response times, failure rates, and dependency rates. It can help you determine whether external services are slowing you down.
The conditions that you can monitor depend on the hosting mechanism that you choose for your application. All options in this section support alert rules. An alert rule uses a web endpoint that you specify in the settings for your service. This endpoint should respond in a timely way so that the alert system can detect that the application is operating correctly. For more information, see Create a new alert rule.
If there's a major outage, client traffic should be routable to an application deployment that's available across other regions or zones. This situation is a good case for cross-premises connectivity and global load balancing. The choice depends on whether the application is internal or external facing. Services such as Azure Front Door, Azure Traffic Manager, or content delivery networks can route traffic across regions based on data that health probes provide.
Traffic Manager is a routing and load-balancing service. It can use a range of rules and settings to distribute requests to specific instances of your application. Besides routing requests, Traffic Manager can regularly ping a URL, port, and relative path. You specify the ping targets with the goal of determining which instances of your application are active and responding to requests. If Traffic Manager detects a status code of 200 (OK), it marks the application as available. Any other status code causes Traffic Manager to mark the application as offline. The Traffic Manager console displays the status of each application. You can configure each rule to reroute requests to other instances of the application that are responding.
Traffic Manager waits for a certain amount of time to receive a response from the monitoring URL. Make sure that your health verification code runs in this time. Allow for network latency for the round trip from Traffic Manager to your application and back again.
Next steps
The following guidance is useful for implementing this pattern:
- Health monitoring guidance in microservices-based applications
- Monitoring application health for reliability, part of the Azure Well-Architected Framework
- Create a new alert rule