Network graph metrics
Important
This article is for the legacy Workplace Analytics app and does not reflect functionality available on the updated Viva Insights platform. Access current documentation for Viva Insights advanced insights here: advanced insights documentation.
The organizational network analysis (ONA) graphs use influence metrics to help you visualize and analyze relationships within your organization. The visual insights in the advanced insights app include some of these types of graphs.
The following is an example of an Employee empowerment graph.
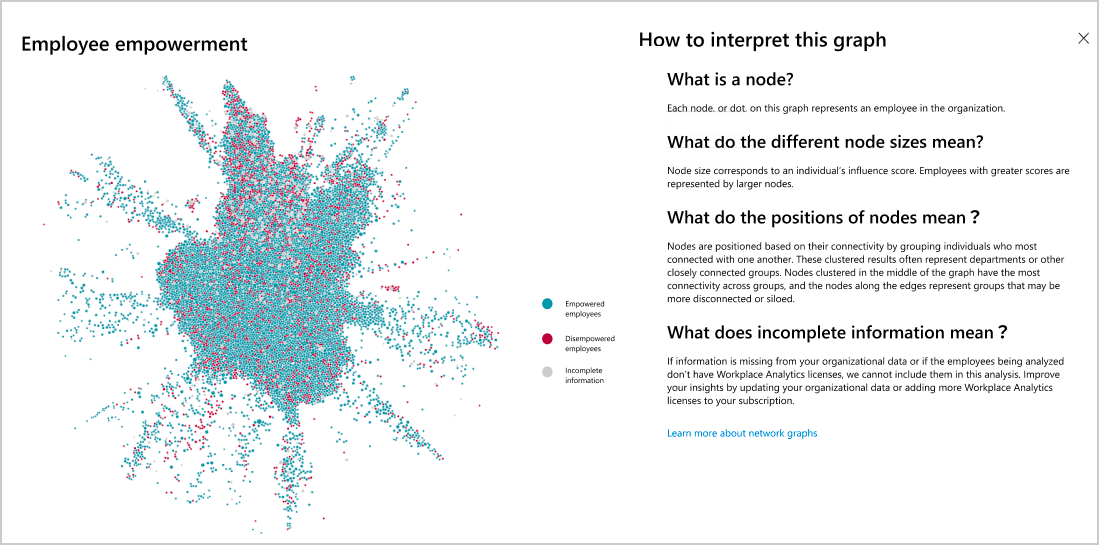
Nodes
In the ONA graphs, each dot or node represents an employee in the organization. Node size corresponds to an individual’s influence score. Employees with greater scores are represented by larger nodes in the graphs.
The node colors depend on the specific insight as indicated in the graph legends.
Available ONA graphs
For calculation information about a specific ONA graph, select the applicable behavior.
- Accelerate decision making - The Employee empowerment graph shows the general distribution of empowered employees and less empowered employees in your organization. This helps identify information sharing patterns, and where they are well represented in your organization. You can use this insight to understand at a high level which parts of your organization could benefit from better information sharing practices.
- Engage influencers - The Reach of influencers graph shows the people who have a high influence score, their connections, and how they effectively connect across your organization. This shows people who power the unobservable communication networks that you can target to effectively drive change.