Fundamentals for Office Scripts in Excel
This article will introduce you to the technical aspects of Office Scripts. You'll learn the critical parts of the TypeScript-based script code and how the Excel objects and APIs work together.
If you would prefer to get started with an interactive experience, try Tutorial: Create and format an Excel table or visit our samples.
TypeScript: The language of Office Scripts
Office Scripts are written in TypeScript, which is a superset of JavaScript. If you're familiar with JavaScript, your knowledge will carry over because much of the code is the same in both languages. We recommend you have some beginner-level programming knowledge before starting your Office Scripts coding journey. The following resources can help you understand the coding side of Office Scripts.
- Learn the basics of JavaScript. You should feel comfortable with concepts like variables, control flow, functions, and data types. Mozilla offers a good, comprehensive tutorial on JavaScript.
- Learn about types in TypeScript. TypeScript builds on JavaScript by ensuring at compile-time that the right types are used for method calls and assignments. The TypeScript documentation on object types, type inference, and type compatibility will be the most useful.
main function: The script's starting point
Each script must contain a main function with the ExcelScript.Workbook type as its first parameter. When the function runs, the Excel application invokes the main function by providing the workbook as its first parameter. An ExcelScript.Workbook should always be the first parameter.
function main(workbook: ExcelScript.Workbook) {
  // Your code goes here
}
The code inside the main function runs when the script is run. main can call other functions in your script, but code that's not contained in a function will not run. Scripts cannot invoke or call other Office Scripts.
Power Automate allows you to connect scripts in flows. Data is passed between the scripts and the flow through the parameters and returns of themain function. How to integrate Office Scripts with Power Automate is covered in detail in Run Office Scripts with Power Automate.
Object model overview
To write a script, you need to understand how the Office Scripts APIs fit together. The components of a workbook have specific relations to one another. In many ways, these relations match those of the Excel UI.
- A Workbook contains one or more Worksheets.
- A Worksheet gives access to cells through Range objects.
- A Range represents a group of contiguous cells.
- Ranges are used to create and place Tables, Charts, Shapes, and other data visualization or organization objects.
- A Worksheet contains collections of those data objects that are present in the individual sheet.
- Workbooks contain collections of some of those data objects (such as Tables) for the entire Workbook.
The complete list of Office Scripts API objects is detailed in the ExcelScript package.
Workbook
Every script is provided a workbook object of type Workbook by the main function. This represents the top level object through which your script interacts with the Excel workbook.
The following script gets the active worksheet from the workbook and logs its name.
function main(workbook: ExcelScript.Workbook) {
    // Get the active worksheet.
    let sheet = workbook.getActiveWorksheet();

    // Display the current worksheet's name.
    console.log(sheet.getName());
}
Ranges
A range is a group of contiguous cells in the workbook. Scripts typically use A1-style notation (e.g., B3 for the single cell in column B and row 3 or C2:F4 for the cells from columns C through F and rows 2 through 4) to define ranges.
Ranges have three core properties: values, formulas, and format. These properties get or set the cell values, formulas to be evaluated, and the visual formatting of the cells. They are accessed through getValues, getFormulas, and getFormat. Values and formulas can be changed with setValues and setFormulas, while the format is a RangeFormat object comprised of several smaller objects that are individually set.
Ranges use two-dimensional arrays to manage information. For more information on handling arrays in the Office Scripts framework, see Work with ranges.
Range sample
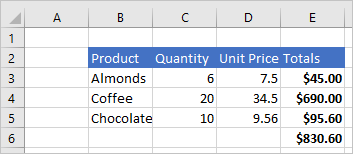
The following sample shows how to create sales records. This script uses Range objects to set the values, formulas, and parts of the format.
function main(workbook: ExcelScript.Workbook) {
    // Get the active worksheet.
    let sheet = workbook.getActiveWorksheet();

    // Create the headers and format them to stand out.
    let headers = [["Product", "Quantity", "Unit Price", "Totals"]];
    let headerRange = sheet.getRange("B2:E2");
    headerRange.setValues(headers);
    headerRange.getFormat().getFill().setColor("#4472C4");
    headerRange.getFormat().getFont().setColor("white");

    // Create the product data rows.
    let productData = [
        ["Almonds", 6, 7.5],
        ["Coffee", 20, 34.5],
        ["Chocolate", 10, 9.54],
    ];
    let dataRange = sheet.getRange("B3:D5");
    dataRange.setValues(productData);

    // Create the formulas to total the amounts sold.
    let totalFormulas = [
        ["=C3 * D3"],
        ["=C4 * D4"],
        ["=C5 * D5"],
        ["=SUM(E3:E5)"],
    ];
    let totalRange = sheet.getRange("E3:E6");
    totalRange.setFormulas(totalFormulas);
    totalRange.getFormat().getFont().setBold(true);

    // Display the totals as US dollar amounts.
    totalRange.setNumberFormat("$0.00");
}
Running this script creates the following data in the current worksheet:
The types of Range values
Each cell has value. This value is the underlying value entered into the cell, which may be different from the text displayed in Excel. For example, you might see "5/2/2021" displayed in the cell as a date, but the actual value is 44318. This display can be changed with the number format, but the actual value and type in the cell only changes when a new value is set.
When you are using the cell value, it's important to tell TypeScript what value you are expecting to get from a cell or range. A cell contains one of the following types: string, number, or boolean. In order for your script to treat the returned values as one of those types, you must declare the type.
The following script gets the average price from the table in the previous sample. Note the code priceRange.getValues() as number[][]. This asserts the type of the range values to be a number[][]. All the values in that array can then be treated as numbers in the script.
function main(workbook: ExcelScript.Workbook) {
  // Get the active worksheet.
  let sheet = workbook.getActiveWorksheet();

  // Get the "Unit Price" column.
  // The result of calling getValues is declared to be a number[][] so that we can perform arithmetic operations.
  let priceRange = sheet.getRange("D3:D5");
  let prices = priceRange.getValues() as number[][];

  // Get the average price.
  let totalPrices = 0;
  prices.forEach((price) => totalPrices += price[0]);
  let averagePrice = totalPrices / prices.length;
  console.log(averagePrice);
}
Charts, tables, and other data objects
Scripts can create and manipulate the data structures and visualizations within Excel. Tables and charts are two of the more commonly used objects, but the APIs support PivotTables, shapes, images, and more. These are stored in collections, which will be discussed later in this article.
Create a table
Create tables by using data-filled ranges. Formatting and table controls (such as filters) are automatically applied to the range.
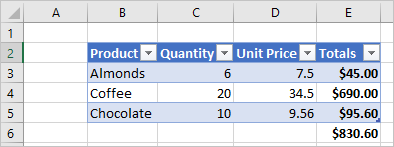
The following script creates a table using the ranges from the previous sample.
function main(workbook: ExcelScript.Workbook) {
    // Get the active worksheet.
    let sheet = workbook.getActiveWorksheet();

    // Add a table that has headers using the data from B2:E5.
    sheet.addTable("B2:E5", true);
}
Running this script on the worksheet with the previous data creates the following table:
Create a chart
Create charts to visualize the data in a range. Scripts allow for dozens of chart varieties, each of which can be customized to suit your needs.
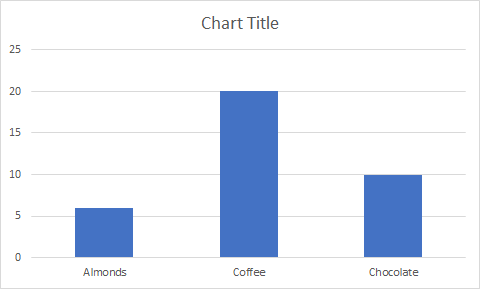
The following script creates a simple column chart for three items and places it 100 pixels below the top of the worksheet.
function main(workbook: ExcelScript.Workbook) {
    // Get the active worksheet.
    let sheet = workbook.getActiveWorksheet();

    // Create a column chart using the data from B3:C5.
    let chart = sheet.addChart(
        ExcelScript.ChartType.columnStacked,
        sheet.getRange("B3:C5")
    );

    // Set the margin of the chart to be 100 pixels from the top of the screen.
    chart.setTop(100);
}
Running this script on the worksheet with the previous table creates the following chart:
Collections
When an Excel object has a collection of one or more objects of the same type, it stores them in an array. For example, a Workbook object contains a Worksheet[]. This array is accessed by the Workbook.getWorksheets() method. get methods that are plural, such as Worksheet.getCharts(), return the entire object collection as an array. You'll see this pattern throughout the Office Scripts APIs: the Worksheet object has a getTables() method that returns a Table[], the Table object has a getColumns() method that returns a TableColumn[], as so on.
The returned array is a normal array, so all the regular array operations are available for your script. You can also access individual objects within the collection using the array index value. For example, workbook.getTables()[0] returns the first table in the collection. For more information on using the built-in array functionality with the Office Scripts framework, see Work with collections.
Individual objects are also accessed from the collection through a get method. get methods that are singular, such as Worksheet.getTable(name), return a single object and require an ID or name for the specific object. This ID or name is usually set by the script or through the Excel UI.
The following script gets all tables in the workbook. It then ensures the headers are displays, the filter buttons are visible, and the table style is set to "TableStyleLight1".
function main(workbook: ExcelScript.Workbook) {
  // Get the table collection.
  let tables = workbook.getTables();

  // Set the table formatting properties for every table.
  tables.forEach(table => {
    table.setShowHeaders(true);
    table.setShowFilterButton(true);
    table.setPredefinedTableStyle("TableStyleLight1");
  })
}
Add Excel objects with a script
You can programmatically add document objects, such as tables or charts, by calling the corresponding add method available on the parent object.
Important
Do not manually add objects to collection arrays. Use the add methods on the parent objects For example, add a Table to a Worksheet with the Worksheet.addTable method.
The following script creates a table in Excel on the first worksheet in the workbook. Note that the created table is returned by the addTable method.
function main(workbook: ExcelScript.Workbook) {
    // Get the first worksheet.
    let sheet = workbook.getWorksheets()[0];

    // Add a table that uses the data in A1:G10.
    let table = sheet.addTable(
      "A1:G10",
       true /* True because the table has headers. */
    );

    // Give the table a name for easy reference in other scripts.
    table.setName("MyTable");
}
Tip
Most Excel objects have a setName method. This gives you an easy way to access Excel objects later in the script or in other scripts for the same workbook.
Verify an object exists in the collection
Scripts often need to check if a table or similar object exists before continuing. Use the names given by scripts or through the Excel UI to identify necessary objects and act accordingly. get methods return undefined when the requested object is not in the collection.
The following script requests a table named "MyTable" and uses an if...else statement to check if the table was found.
function main(workbook: ExcelScript.Workbook) {
  // Get the table named "MyTable".
  let myTable = workbook.getTable("MyTable");

  // If the table is in the workbook, myTable will have a value.
  // Otherwise, the variable will be undefined and go to the else clause.
  if (myTable) {
    let worksheetName = myTable.getWorksheet().getName();
    console.log(`MyTable is on the ${worksheetName} worksheet`);
  } else {
    console.log(`MyTable is not in the workbook.`);
  }
}
A common pattern in Office Scripts is to recreate a table, chart, or other object every time the script is run. If you don't need the old data, it's best to delete the old object before creating the new one. This avoids name conflicts or other differences that may have been introduced by other users.
The following script removes the table named "MyTable", if it is present, then adds a new table with the same name.
function main(workbook: ExcelScript.Workbook) {
  // Get the table named "MyTable" from the first worksheet.
  let sheet = workbook.getWorksheets()[0];
  let tableName = "MyTable";
  let oldTable = sheet.getTable(tableName);

  // If the table exists, remove it.
  if (oldTable) {
    oldTable.delete();
  }

  // Add a new table with the same name.
  let newTable = sheet.addTable("A1:G10", true);
  newTable.setName(tableName);
}
Remove Excel objects with a script
To delete an object, call the object's delete method.
Note
As with adding objects, do not manually remove objects from collection arrays. Use the delete methods on the collection-type objects. For example, remove a Table from a Worksheet using Table.delete.
The following script removes the first worksheet in the workbook.
function main(workbook: ExcelScript.Workbook) {
    // Get first worksheet.
    let sheet = workbook.getWorksheets()[0];

    // Remove that worksheet from the workbook.
    sheet.delete();
}
Further reading on the object model
The Office Scripts API reference documentation is a comprehensive listing of the objects used in Office Scripts. There, you can use the table of contents to navigate to any class you'd like to learn more about. The following are several commonly viewed pages.
For information specific to the PivotTable object model, see Work with PivotTables in Office Scripts.
See also
Office Scripts
Feedback
Coming soon: Throughout 2024 we will be phasing out GitHub Issues as the feedback mechanism for content and replacing it with a new feedback system. For more information see: https://aka.ms/ContentUserFeedback.
Submit and view feedback for