Analyze and prevent deadlocks in Azure SQL Database
Applies to: ![]() Azure SQL Database
Azure SQL Database
This article teaches you how to identify deadlocks in Azure SQL Database, use deadlock graphs and Query Store to identify the queries in the deadlock, and plan and test changes to prevent deadlocks from reoccurring.
This article focuses on identifying and analyzing deadlocks due to lock contention. Learn more about other types of deadlocks in resources that can deadlock.
How deadlocks occur in Azure SQL Database
Each new database in Azure SQL Database has the read committed snapshot (RCSI) database setting enabled by default. Blocking between sessions reading data and sessions writing data is minimized under RCSI, which uses row versioning to increase concurrency. However, blocking and deadlocks may still occur in databases in Azure SQL Database because:
- Queries that modify data may block one another.
- Queries may run under isolation levels that increase blocking. Isolation levels may be specified via client library methods, query hints, or SET statements in Transact-SQL.
- RCSI may be disabled, causing the database to use shared (S) locks to protect SELECT statements run under the read committed isolation level. This may increase blocking and deadlocks.
An example deadlock
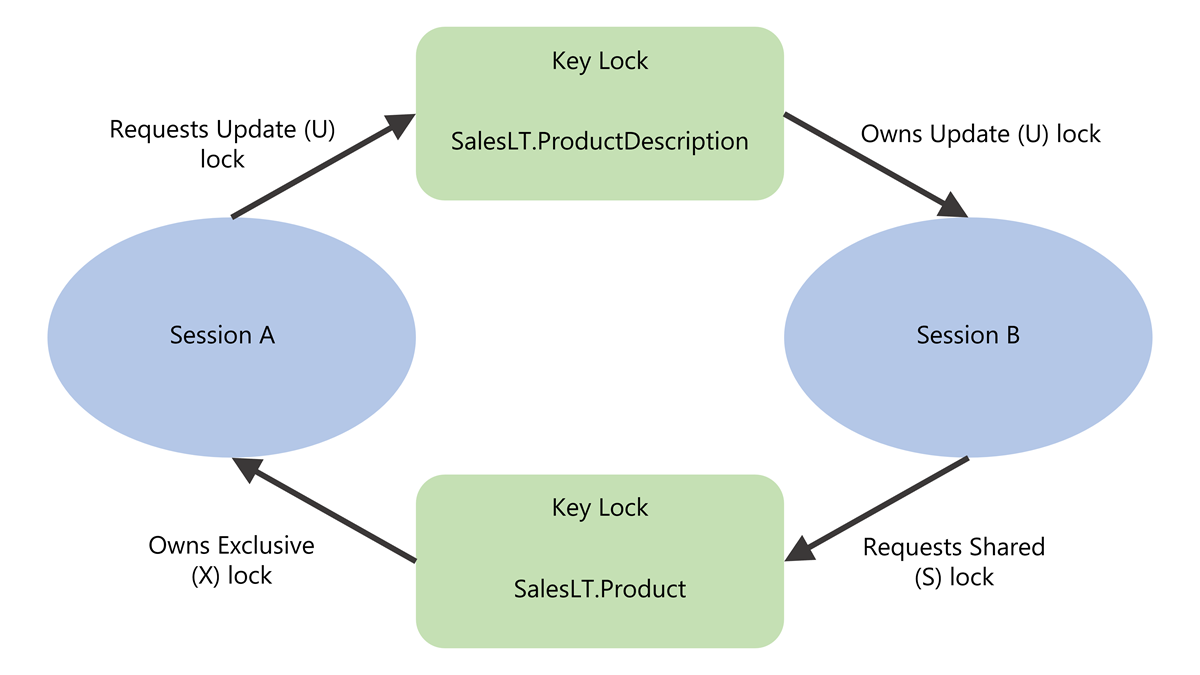
A deadlock occurs when two or more tasks permanently block one another because each task has a lock on a resource the other task is trying to lock. A deadlock is also called a cyclic dependency: in the case of a two-task deadlock, transaction A has a dependency on transaction B, and transaction B closes the circle by having a dependency on transaction A.
For example:
- Session A begins an explicit transaction and runs an update statement that acquires an update (U) lock on one row on table
SalesLT.Productthat is converted to an exclusive (X) lock. - Session B runs an update statement that modifies the
SalesLT.ProductDescriptiontable. The update statement joins to theSalesLT.Producttable to find the correct rows to update.- Session B acquires an update (U) lock on 72 rows on the
SalesLT.ProductDescriptiontable. - Session B needs a shared lock on rows on the table
SalesLT.Product, including the row that is locked by Session A. Session B is blocked onSalesLT.Product.
- Session B acquires an update (U) lock on 72 rows on the
- Session A continues its transaction, and now runs an update against the
SalesLT.ProductDescriptiontable. Session A is blocked by Session B onSalesLT.ProductDescription.
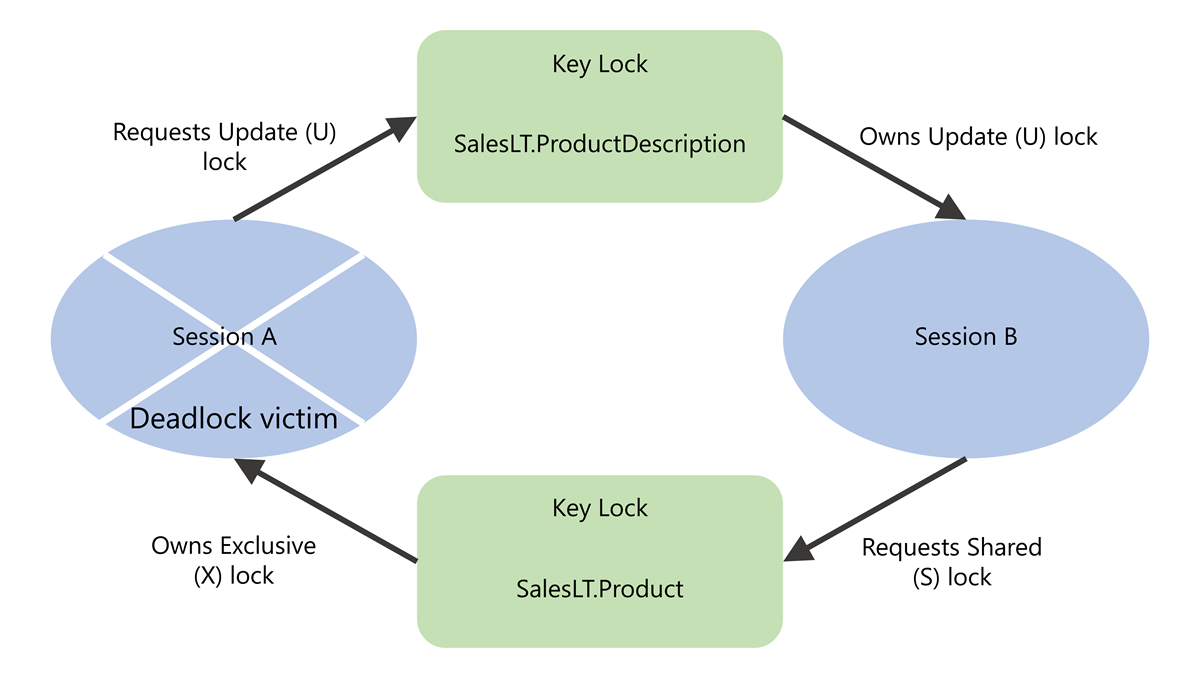
All transactions in a deadlock will wait indefinitely unless one of the participating transactions is rolled back, for example, because its session was terminated.
The database engine deadlock monitor periodically checks for tasks that are in a deadlock. If the deadlock monitor detects a cyclic dependency, it chooses one of the tasks as a victim and terminates its transaction with error 1205, "Transaction (Process ID N) was deadlocked on lock resources with another process and has been chosen as the deadlock victim. Rerun the transaction." Breaking the deadlock in this way allows the other task or tasks in the deadlock to complete their transactions.
Note
Learn more about the criteria for choosing a deadlock victim in the Deadlock process list section of this article.
The application with the transaction chosen as the deadlock victim should retry the transaction, which usually completes after the other transaction or transactions involved in the deadlock have finished.
It is a best practice to introduce a short, randomized delay before retry to avoid encountering the same deadlock again. Learn more about how to design retry logic for transient errors.
Default isolation level in Azure SQL Database
New databases in Azure SQL Database enable read committed snapshot (RCSI) by default. RCSI changes the behavior of the read committed isolation level to use row-versioning to provide statement-level consistency without the use of shared (S) locks for SELECT statements.
With RCSI enabled:
- Statements reading data do not block statements modifying data.
- Statements modifying data do not block statements reading data.
Snapshot isolation level is also enabled by default for new databases in Azure SQL Database. Snapshot isolation is an additional row-based isolation level that provides transaction-level consistency for data and which uses row versions to select rows to update. To use snapshot isolation, queries or connections must explicitly set their transaction isolation level to SNAPSHOT. This may only be done when snapshot isolation is enabled for the database.
You can identify if RCSI and/or snapshot isolation are enabled with Transact-SQL. Connect to your database in Azure SQL Database and run the following query:
SELECT name, is_read_committed_snapshot_on, snapshot_isolation_state_desc
FROM sys.databases
WHERE name = DB_NAME();
GO
If RCSI is enabled, the is_read_committed_snapshot_on column will return the value 1. If snapshot isolation is enabled, the snapshot_isolation_state_desc column will return the value ON.
If RCSI has been disabled for a database in Azure SQL Database, investigate why RCSI was disabled before re-enabling it. Application code may have been written expecting that queries reading data will be blocked by queries writing data, resulting in incorrect results from race conditions when RCSI is enabled.
Interpreting deadlock events
A deadlock event is emitted after the deadlock manager in Azure SQL Database detects a deadlock and selects a transaction as the victim. In other words, if you set up alerts for deadlocks, the notification fires after an individual deadlock has been resolved. There is no user action that needs to be taken for that deadlock. Applications should be written to include retry logic so that they automatically continue after receiving error 1205, "Transaction (Process ID N) was deadlocked on lock resources with another process and has been chosen as the deadlock victim. Rerun the transaction."
It's useful to set up alerts, however, as deadlocks may reoccur. Deadlock alerts enable you to investigate if a pattern of repeat deadlocks is happening in your database, in which case you may choose to take action to prevent deadlocks from reoccurring. Learn more about alerting in the Monitor and alert on deadlocks section of this article.
Top methods to prevent deadlocks
The lowest risk approach to preventing deadlocks from reoccurring is generally to tune nonclustered indexes to optimize queries involved in the deadlock.
- Risk is low for this approach because tuning nonclustered indexes doesn't require changes to the query code itself, reducing the risk of a user error when rewriting Transact-SQL that causes incorrect data to be returned to the user.
- Effective nonclustered index tuning helps queries find the data to read and modify more efficiently. By reducing the amount of data that a query needs to access, the likelihood of blocking is reduced and deadlocks can often be prevented.
In some cases, creating or tuning a clustered index can reduce blocking and deadlocks. Because the clustered index is included in all nonclustered index definitions, creating or modifying a clustered index can be an IO intensive and time consuming operation on larger tables with existing nonclustered indexes. Learn more about Clustered index design guidelines.
When index tuning isn't successful at preventing deadlocks, other methods are available:
- If the deadlock occurs only when a particular plan is chosen for one of the queries involved in the deadlock, forcing a query plan with Query Store may prevent deadlocks from reoccurring.
- Rewriting Transact-SQL for one or more transactions involved in the deadlock can also help prevent deadlocks. Breaking apart explicit transactions into smaller transactions requires careful coding and testing to ensure data validity when concurrent modifications occur.
Learn more about each of these approaches in the Prevent a deadlock from reoccurring section of this article.
Monitor and alert on deadlocks
In this article, we will use the AdventureWorksLT sample database to set up alerts for deadlocks, cause an example deadlock, analyze the deadlock graph for the example deadlock, and test changes to prevent the deadlock from reoccurring.
We'll use the SQL Server Management Studio (SSMS) client in this article, as it contains functionality to display deadlock graphs in an interactive visual mode. You can use other clients such as Azure Data Studio to follow along with the examples, but you may only be able to view deadlock graphs as XML.
Create the AdventureWorksLT database
To follow along with the examples, create a new database in Azure SQL Database and select Sample data as the Data source.
For detailed instructions on how to create AdventureWorksLT with the Azure portal, Azure CLI, or PowerShell, select the approach of your choice in Quickstart: Create an Azure SQL Database single database.
Set up deadlock alerts in the Azure portal
To set up alerts for deadlock events, follow the steps in the article Create alerts for Azure SQL Database and Azure Synapse Analytics using the Azure portal.
Select Deadlocks as the signal name for the alert. Configure the Action group to notify you using the method of your choice, such as the Email/SMS/Push/Voice action type.
Collect deadlock graphs in Azure SQL Database with Extended Events
Deadlock graphs are a rich source of information regarding the processes and locks involved in a deadlock. To collect deadlock graphs with Extended Events (XEvents) in Azure SQL Database, capture the sqlserver.database_xml_deadlock_report event.
You can collect deadlock graphs with XEvents using either the ring buffer target or an event file target. Considerations for selecting the appropriate target type are summarized in the following table:
| Approach | Benefits | Considerations | Usage scenarios |
|---|---|---|---|
| Ring buffer target |
|
|
|
| Event file target |
|
|
|
Select the target type you would like to use:
The ring buffer target is convenient and easy to set up, but has a limited capacity, which can cause older events to be lost. The ring buffer does not persist events to storage and the ring buffer target is cleared when the XEvents session is stopped. This means that any XEvents collected will not be available when the database engine restarts for any reason, such as a failover. The ring buffer target is best suited to learning and short-term needs if you do not have the ability to set up an XEvents session to an event file target immediately.
This sample code creates an XEvents session that captures deadlock graphs in memory using the ring buffer target. The maximum memory allowed for the ring buffer target is 4 MB, and the session will automatically run when the database comes online, such as after a failover.
To create and then start a XEvents session for the sqlserver.database_xml_deadlock_report event that writes to the ring buffer target, connect to your database and run the following Transact-SQL:
CREATE EVENT SESSION [deadlocks] ON DATABASE
ADD EVENT sqlserver.database_xml_deadlock_report
ADD TARGET package0.ring_buffer
WITH (STARTUP_STATE=ON, MAX_MEMORY=4 MB)
GO

ALTER EVENT SESSION [deadlocks] ON DATABASE
    STATE = START;
GO
Cause a deadlock in AdventureWorksLT
Note
This example works in the AdventureWorksLT database with the default schema and data when RCSI has been enabled. See Create the AdventureWorksLT database for instructions to create the database.
To cause a deadlock, you will need to connect two sessions to the AdventureWorksLT database. We'll refer to these sessions as Session A and Session B.
In Session A, run the following Transact-SQL. This code begins an explicit transaction and runs a single statement that updates the SalesLT.Product table. To do this, the transaction acquires an update (U) lock on one row on table SalesLT.Product which is converted to an exclusive (X) lock. We leave the transaction open.
BEGIN TRAN

    UPDATE SalesLT.Product SET SellEndDate = SellEndDate + 1
        WHERE Color = 'Red';
Now, in Session B, run the following Transact-SQL. This code doesn't explicitly begin a transaction. Instead, it operates in autocommit transaction mode. This statement updates the SalesLT.ProductDescription table. The update will take out an update (U) lock on 72 rows on the SalesLT.ProductDescription table. The query joins to other tables, including the SalesLT.Product table.
UPDATE SalesLT.ProductDescription SET Description = Description
    FROM SalesLT.ProductDescription as pd
    JOIN SalesLT.ProductModelProductDescription as pmpd on
        pd.ProductDescriptionID = pmpd.ProductDescriptionID
    JOIN SalesLT.ProductModel as pm on
        pmpd.ProductModelID = pm.ProductModelID
    JOIN SalesLT.Product as p on
        pm.ProductModelID=p.ProductModelID
    WHERE p.Color = 'Silver';
To complete this update, Session B needs a shared (S) lock on rows on the table SalesLT.Product, including the row that is locked by Session A. Session B will be blocked on SalesLT.Product.
Return to Session A. Run the following Transact-SQL statement. This runs a second UPDATE statement as part of the open transaction.
    UPDATE SalesLT.ProductDescription SET Description = Description
        FROM SalesLT.ProductDescription as pd
        JOIN SalesLT.ProductModelProductDescription as pmpd on
            pd.ProductDescriptionID = pmpd.ProductDescriptionID
        JOIN SalesLT.ProductModel as pm on
            pmpd.ProductModelID = pm.ProductModelID
        JOIN SalesLT.Product as p on
            pm.ProductModelID=p.ProductModelID
        WHERE p.Color = 'Red';
The second update statement in Session A will be blocked by Session B on the SalesLT.ProductDescription.
Session A and Session B are now mutually blocking one another. Neither transaction can proceed, as they each need a resource that is locked by the other.
After a few seconds, the deadlock monitor will identify that the transactions in Session A and Session B are mutually blocking one another, and that neither can make progress. You should see a deadlock occur, with Session A chosen as the deadlock victim. An error message will appear in Session A with text similar to the following:
Msg 1205, Level 13, State 51, Line 7 Transaction (Process ID 91) was deadlocked on lock resources with another process and has been chosen as the deadlock victim. Rerun the transaction.
Session B will complete successfully.
If you set up deadlock alerts in the Azure portal, you should receive a notification shortly after the deadlock occurs.
View deadlock graphs from an XEvents session
If you have set up an XEvents session to collect deadlocks and a deadlock has occurred after the session was started, you can view an interactive graphic display of the deadlock graph as well as the XML for the deadlock graph.
Different methods are available to obtain deadlock information for the ring buffer target and event file targets. Select the target you used for your XEvents session:
If you set up an XEvents session writing to the ring buffer, you can query deadlock information with the following Transact-SQL. Before running the query, replace the value of @tracename with the name of your xEvents session.
DECLARE @tracename sysname = N'deadlocks';

WITH ring_buffer AS (
    SELECT CAST(target_data AS XML) as rb
    FROM sys.dm_xe_database_sessions AS s
    JOIN sys.dm_xe_database_session_targets AS t
        ON CAST(t.event_session_address AS BINARY(8)) = CAST(s.address AS BINARY(8))
    WHERE s.name = @tracename and
    t.target_name = N'ring_buffer'
), dx AS (
    SELECT
        dxdr.evtdata.query('.') as deadlock_xml_deadlock_report
    FROM ring_buffer
    CROSS APPLY rb.nodes('/RingBufferTarget/event[@name=''database_xml_deadlock_report'']') AS dxdr(evtdata)
)
SELECT
    d.query('/event/data[@name=''deadlock_cycle_id'']/value').value('(/value)[1]', 'int') AS [deadlock_cycle_id],
    d.value('(/event/@timestamp)[1]', 'DateTime2') AS [deadlock_timestamp],
    d.query('/event/data[@name=''database_name'']/value').value('(/value)[1]', 'nvarchar(256)') AS [database_name],
    d.query('/event/data[@name=''xml_report'']/value/deadlock') AS deadlock_xml,
    LTRIM(RTRIM(REPLACE(REPLACE(d.value('.', 'nvarchar(2000)'),CHAR(10),' '),CHAR(13),' '))) as query_text
FROM dx
CROSS APPLY deadlock_xml_deadlock_report.nodes('(/event/data/value/deadlock/process-list/process/inputbuf)') AS ib(d)
ORDER BY [deadlock_timestamp] DESC;
GO
View and save a deadlock graph in XML
Viewing a deadlock graph in XML format allows you to copy the inputbuffer of Transact-SQL statements involved in the deadlock. You may also prefer to analyze deadlocks in a text-based format.
If you have used a Transact-SQL query to return deadlock graph information, to view the deadlock graph XML, select the value in the deadlock_xml column from any row to open the deadlock graph's XML in a new window in SSMS.
The XML for this example deadlock graph is:
<deadlock>
  <victim-list>
    <victimProcess id="process24756e75088" />
  </victim-list>
  <process-list>
    <process id="process24756e75088" taskpriority="0" logused="6528" waitresource="KEY: 8:72057594045202432 (98ec012aa510)" waittime="192" ownerId="1011123" transactionname="user_transaction" lasttranstarted="2022-03-08T15:44:43.490" XDES="0x2475c980428" lockMode="U" schedulerid="3" kpid="30192" status="suspended" spid="89" sbid="0" ecid="0" priority="0" trancount="2" lastbatchstarted="2022-03-08T15:44:49.250" lastbatchcompleted="2022-03-08T15:44:49.210" lastattention="1900-01-01T00:00:00.210" clientapp="Microsoft SQL Server Management Studio - Query" hostname="LAPTOP-CHRISQ" hostpid="16716" loginname="chrisqpublic" isolationlevel="read committed (2)" xactid="1011123" currentdb="8" currentdbname="AdventureWorksLT" lockTimeout="4294967295" clientoption1="671096864" clientoption2="128056">
      <executionStack>
        <frame procname="unknown" queryhash="0xef52b103e8b9b8ca" queryplanhash="0x02b0f58d7730f798" line="1" stmtstart="2" stmtend="792" sqlhandle="0x02000000c58b8f1e24e8f104a930776e21254b1771f92a520000000000000000000000000000000000000000">
unknown    </frame>
      </executionStack>
      <inputbuf>
    UPDATE SalesLT.ProductDescription SET Description = Description
        FROM SalesLT.ProductDescription as pd
        JOIN SalesLT.ProductModelProductDescription as pmpd on
            pd.ProductDescriptionID = pmpd.ProductDescriptionID
        JOIN SalesLT.ProductModel as pm on
            pmpd.ProductModelID = pm.ProductModelID
        JOIN SalesLT.Product as p on
            pm.ProductModelID=p.ProductModelID
        WHERE p.Color = 'Red'   </inputbuf>
    </process>
    <process id="process2476d07d088" taskpriority="0" logused="11360" waitresource="KEY: 8:72057594045267968 (39e18040972e)" waittime="2641" ownerId="1013536" transactionname="UPDATE" lasttranstarted="2022-03-08T15:44:46.807" XDES="0x2475ca80428" lockMode="S" schedulerid="2" kpid="94040" status="suspended" spid="95" sbid="0" ecid="0" priority="0" trancount="2" lastbatchstarted="2022-03-08T15:44:46.807" lastbatchcompleted="2022-03-08T15:44:46.760" lastattention="1900-01-01T00:00:00.760" clientapp="Microsoft SQL Server Management Studio - Query" hostname="LAPTOP-CHRISQ" hostpid="16716" loginname="chrisqpublic" isolationlevel="read committed (2)" xactid="1013536" currentdb="8" currentdbname="AdventureWorksLT" lockTimeout="4294967295" clientoption1="671088672" clientoption2="128056">
      <executionStack>
        <frame procname="unknown" queryhash="0xef52b103e8b9b8ca" queryplanhash="0x02b0f58d7730f798" line="1" stmtstart="2" stmtend="798" sqlhandle="0x020000002c85bb06327c0852c0be840fc1e30efce2b7c8090000000000000000000000000000000000000000">
unknown    </frame>
      </executionStack>
      <inputbuf>
    UPDATE SalesLT.ProductDescription SET Description = Description
        FROM SalesLT.ProductDescription as pd
        JOIN SalesLT.ProductModelProductDescription as pmpd on
            pd.ProductDescriptionID = pmpd.ProductDescriptionID
        JOIN SalesLT.ProductModel as pm on
            pmpd.ProductModelID = pm.ProductModelID
        JOIN SalesLT.Product as p on
            pm.ProductModelID=p.ProductModelID
        WHERE p.Color = 'Silver';   </inputbuf>
    </process>
  </process-list>
  <resource-list>
    <keylock hobtid="72057594045202432" dbid="8" objectname="9e011567-2446-4213-9617-bad2624ccc30.SalesLT.ProductDescription" indexname="PK_ProductDescription_ProductDescriptionID" id="lock2474df12080" mode="U" associatedObjectId="72057594045202432">
      <owner-list>
        <owner id="process2476d07d088" mode="U" />
      </owner-list>
      <waiter-list>
        <waiter id="process24756e75088" mode="U" requestType="wait" />
      </waiter-list>
    </keylock>
    <keylock hobtid="72057594045267968" dbid="8" objectname="9e011567-2446-4213-9617-bad2624ccc30.SalesLT.Product" indexname="PK_Product_ProductID" id="lock2474b588580" mode="X" associatedObjectId="72057594045267968">
      <owner-list>
        <owner id="process24756e75088" mode="X" />
      </owner-list>
      <waiter-list>
        <waiter id="process2476d07d088" mode="S" requestType="wait" />
      </waiter-list>
    </keylock>
  </resource-list>
</deadlock>
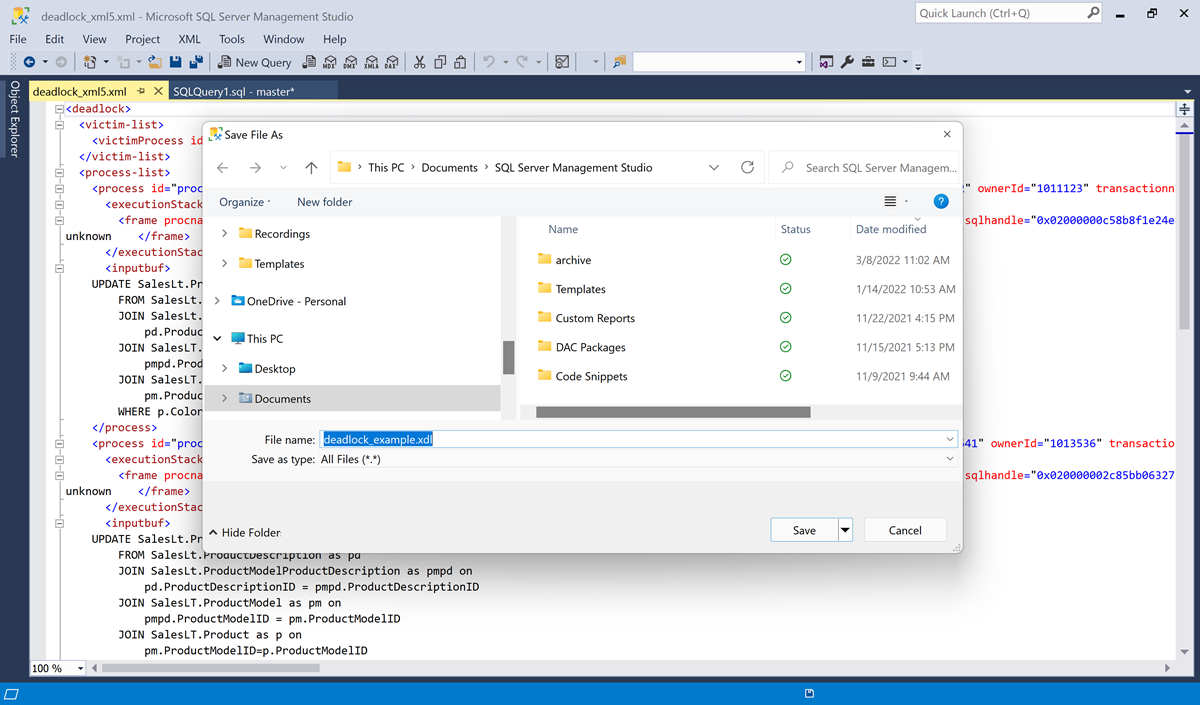
To save the deadlock graph as an XML file:
- Select File and Save As....
- Leave the Save as type value as the default XML Files (*.xml)
- Set the File name to the name of your choice.
- Select Save.
Save a deadlock graph as an XDL file that can be displayed interactively in SSMS
Viewing an interactive representation of a deadlock graph can be useful to get a quick overview of the processes and resources involved in a deadlock, and quickly identifying the deadlock victim.
To save a deadlock graph as a file that can be graphically displayed by SSMS:
Select the value in the
deadlock_xmlcolumn from any row to open the deadlock graph's XML in a new window in SSMS.Select File and Save As....
Set Save as type to All Files.
Set the File name to the name of your choice, with the extension set to .xdl.
Select Save.
Close the file by selecting the X on the tab at the top of the window, or by selecting File, then Close.
Reopen the file in SSMS by selecting File, then Open, then File. Select the file you saved with the
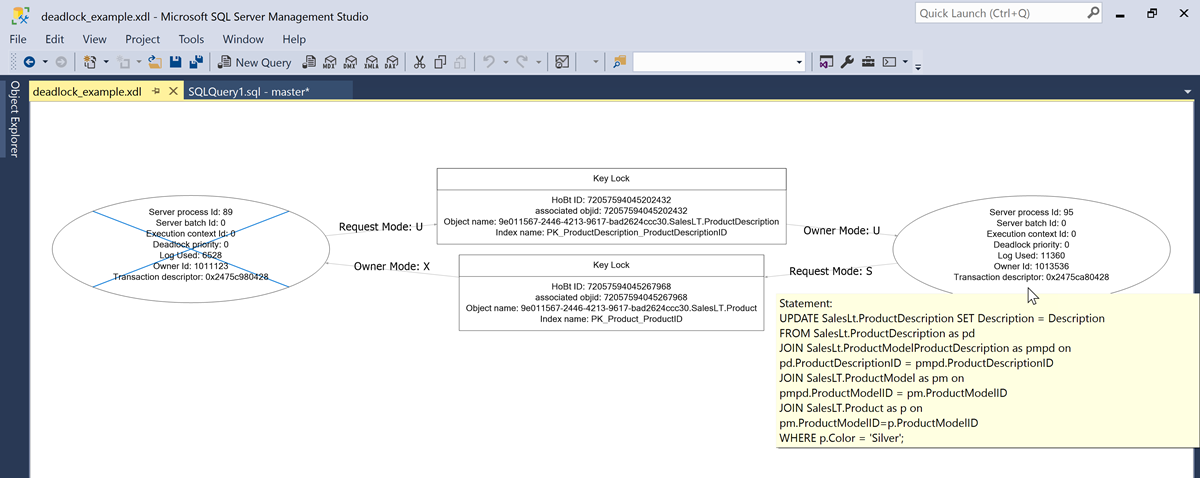
.xdlextension.The deadlock graph will now display in SSMS with a visual representation of the processes and resources involved in the deadlock.


Analyze a deadlock for Azure SQL Database
A deadlock graph typically has three nodes:
- Victim-list. The deadlock victim process identifier.
- Process-list. Information on all the processes involved in the deadlock. Deadlock graphs use the term 'process' to represent a session running a transaction.
- Resource-list. Information about the resources involved in the deadlock.
When analyzing a deadlock, it is useful to step through these nodes.
Deadlock victim list
The deadlock victim list shows the process that was chosen as the deadlock victim. In the visual representation of a deadlock graph, processes are represented by ovals. The deadlock victim process has an "X" drawn over the oval.

In the XML view of a deadlock graph, the victim-list node gives an ID for the process that was the victim of the deadlock.
In our example deadlock, the victim process ID is process24756e75088. We can use this ID when examining the process-list and resource-list nodes to learn more about the victim process and the resources it was locking or requesting to lock.
Deadlock process list
The deadlock process list is a rich source of information about the transactions involved in the deadlock.
The graphic representation of the deadlock graph shows only a subset of information contained in the deadlock graph XML. The ovals in the deadlock graph represent the process, and show information including the:
Server process ID, also known as the session ID or SPID.
Deadlock priority of the session. If two sessions have different deadlock priorities, the session with the lower priority is chosen as the deadlock victim. In this example, both sessions have the same deadlock priority.
The amount of transaction log used by the session in bytes. If both sessions have the same deadlock priority, the deadlock monitor chooses the session that is less expensive to roll back as the deadlock victim. The cost is determined by comparing the number of log bytes written to that point in each transaction.
In our example deadlock, session_id 89 had used a lower amount of transaction log, and was selected as the deadlock victim.
Additionally, you can view the input buffer for the last statement run in each session prior to the deadlock by hovering the mouse over each process. The input buffer will appear in a tooltip.

Additional information is available for processes in the XML view of the deadlock graph, including:
- Identifying information for the session, such as the client name, host name, and login name.
- The query plan hash for the last statement run by each session prior to the deadlock. The query plan hash is useful for retrieving more information about the query from Query Store.
In our example deadlock:
- We can see that both sessions were run using the SSMS client under the chrisqpublic login.
- The query plan hash of the last statement run prior to the deadlock by our deadlock victim is 0x02b0f58d7730f798. We can see the text of this statement in the input buffer.
- The query plan hash of the last statement run by the other session in our deadlock is also 0x02b0f58d7730f798. We can see the text of this statement in the input buffer. In this case, both queries have the same query plan hash because the queries are identical, except for a literal value used as an equality predicate.
We'll use these values later in this article to find additional information in Query Store.
Limitations of the input buffer in the deadlock process list
There are some limitations to be aware of regarding input buffer information in the deadlock process list.
Query text may be truncated in the input buffer. The input buffer is limited to the first 4,000 characters of the statement being executed.
Additionally, some statements involved in the deadlock may not be included in the deadlock graph. In our example, Session A ran two update statements within a single transaction. Only the second update statement, the update that caused the deadlock, is included in the deadlock graph. The first update statement run by Session A played a part in the deadlock by blocking Session B. The input buffer, query_hash, and related information for the first statement run by Session A is not included in the deadlock graph.
To identify the full Transact-SQL run in a multi-statement transaction involved in a deadlock, you will need to either find the relevant information in the stored procedure or application code that ran the query, or run a trace using Extended Events to capture full statements run by sessions involved in a deadlock while it occurs. If a statement involved in the deadlock has been truncated and only partial Transact-SQL appears in the input buffer, you can find the Transact-SQL for the statement in Query Store with the Execution Plan.
Deadlock resource list
The deadlock resource list shows which lock resources are owned and waited on by the processes in the deadlock.
Resources are represented by rectangles in the visual representation of the deadlock:

Note
You may notice that database names are represented as uniquedientifers in deadlock graphs for databases in Azure SQL Database. This is the physical_database_name for the database listed in the sys.databases and sys.dm_user_db_resource_governance dynamic management views.
In this example deadlock:
The deadlock victim, which we have referred to as Session A:
- Owns an exclusive (X) lock on a key on the
PK_Product_ProductIDindex on theSalesLT.Producttable. - Requests an update (U) lock on a key on the
PK_ProductDescription_ProductDescriptionIDindex on theSalesLT.ProductDescriptiontable.
- Owns an exclusive (X) lock on a key on the
The other process, which we have referred to as Session B:
- Owns an update (U) lock on a key on the
PK_ProductDescription_ProductDescriptionIDindex on theSalesLT.ProductDescriptiontable. - Requests a shared (S) lock on a key on the
PK_ProductDescription_ProductDescriptionIDindex on theSalesLT.ProductDescriptiontable.
- Owns an update (U) lock on a key on the
We can see the same information in the XML of the deadlock graph in the resource-list node.
Find query execution plans in Query Store
It is often useful to examine the query execution plans for statements involved in the deadlock. These execution plans can often be found in Query Store using the query plan hash from the XML view of the deadlock graph's process list.
This Transact-SQL query looks for query plans matching the query plan hash we found for our example deadlock. Connect to the user database in Azure SQL Database to run the query.
DECLARE @query_plan_hash binary(8) = 0x02b0f58d7730f798

SELECT
    qrsi.end_time as interval_end_time,
    qs.query_id,
    qp.plan_id,
    qt.query_sql_text,
    TRY_CAST(qp.query_plan as XML) as query_plan,
    qrs.count_executions
FROM sys.query_store_query as qs
JOIN sys.query_store_query_text as qt on qs.query_text_id=qt.query_text_id
JOIN sys.query_store_plan as qp on qs.query_id=qp.query_id
JOIN sys.query_store_runtime_stats qrs on qp.plan_id = qrs.plan_id
JOIN sys.query_store_runtime_stats_interval qrsi on qrs.runtime_stats_interval_id=qrsi.runtime_stats_interval_id
WHERE query_plan_hash =  @query_plan_hash
ORDER BY interval_end_time, query_id;
GO
You may not be able to obtain a query execution plan from Query Store, depending on your Query Store CLEANUP_POLICY or QUERY_CAPTURE_MODE settings. In this case, you can often get needed information by displaying the estimated execution plan for the query.
Look for patterns that increase blocking
When examining query execution plans involved in deadlocks, look out for patterns that may contribute to blocking and deadlocks.
Table or index scans. When queries modifying data are run under RCSI, the selection of rows to update is done using a blocking scan where an update (U) lock is taken on the data row as data values are read. If the data row does not meet the update criteria, the update lock is released and the next row is locked and scanned.
Tuning indexes to help modification queries find rows more efficiently reduces the number of update locks issued. This reduces the chances of blocking and deadlocks.
Indexed views referencing more than one table. When you modify a table that is referenced in an indexed view, the database engine must also maintain the indexed view. This requires taking out more locks and can lead to increased blocking and deadlocks. Indexed views may also cause update operations to internally execute under the read committed isolation level.
Modifications to columns referenced in foreign key constraints. When you modify columns in a table that are referenced in a FOREIGN KEY constraint, the database engine must look for related rows in the referencing table. Row versions cannot be used for these reads. In cases where cascading updates or deletes are enabled, the isolation level may be escalated to serializable for the duration of the statement to protect against phantom inserts.
Lock hints. Look for table hints that specify isolation levels requiring more locks. These hints include
HOLDLOCK(which is equivalent to serializable),SERIALIZABLE,READCOMMITTEDLOCK(which disables RCSI), andREPEATABLEREAD. Additionally, hints such asPAGLOCK,TABLOCK,UPDLOCK, andXLOCKcan increase the risks of blocking and deadlocks.If these hints are in place, research why the hints were implemented. These hints may prevent race conditions and ensure data validity. It may be possible to leave these hints in place and prevent future deadlocks using an alternate method in the Prevent a deadlock from reoccurring section of this article if necessary.
Note
Learn more about behavior when modifying data using row versioning in the Transaction locking and row versioning guide.
When examining the full code for a transaction, either in an execution plan or in application query code, look for additional problematic patterns:
User interaction in transactions. User interaction inside an explicit multi-statement transaction significantly increases the duration of transactions. This makes it more likely for these transactions to overlap and for blocking and deadlocks to occur.
Similarly, holding an open transaction and querying an unrelated database or system mid-transaction significantly increases the chances of blocking and deadlocks.
Transactions accessing objects in different orders. Deadlocks are less likely to occur when concurrent explicit multi-statement transactions follow the same patterns and access objects in the same order.
Prevent a deadlock from reoccurring
There are multiple techniques available to prevent deadlocks from reoccurring, including index tuning, forcing plans with Query Store, and modifying Transact-SQL queries.
Review the table's clustered index. Most tables benefit from clustered indexes, but often, tables are implemented as heaps by accident.
One way to check for a clustered index is by using the sp_helpindex system stored procedure. For example, we can view a summary of the indexes on the
SalesLT.Producttable by executing the following statement:exec sp_helpindex 'SalesLT.Product'; GOReview the index_description column. A table can have only one clustered index. If a clustered index has been implemented for the table, the index_description will contain the word 'clustered'.
If no clustered index is present, the table is a heap. In this case, review if the table was intentionally created as a heap to solve a specific performance problem. Consider implementing a clustered index based on the clustered index design guidelines.
In some cases, creating or tuning a clustered index may reduce or eliminate blocking in deadlocks. In other cases, you may need to employ an additional technique such as the others in this list.
Create or modify nonclustered indexes. Tuning nonclustered indexes can help your modification queries find the data to update more quickly, which reduces the number of update locks required.
In our example deadlock, the query execution plan found in Query Store contains a clustered index scan against the
PK_Product_ProductIDindex. The deadlock graph indicates that a shared (S) lock wait on this index is a component in the deadlock.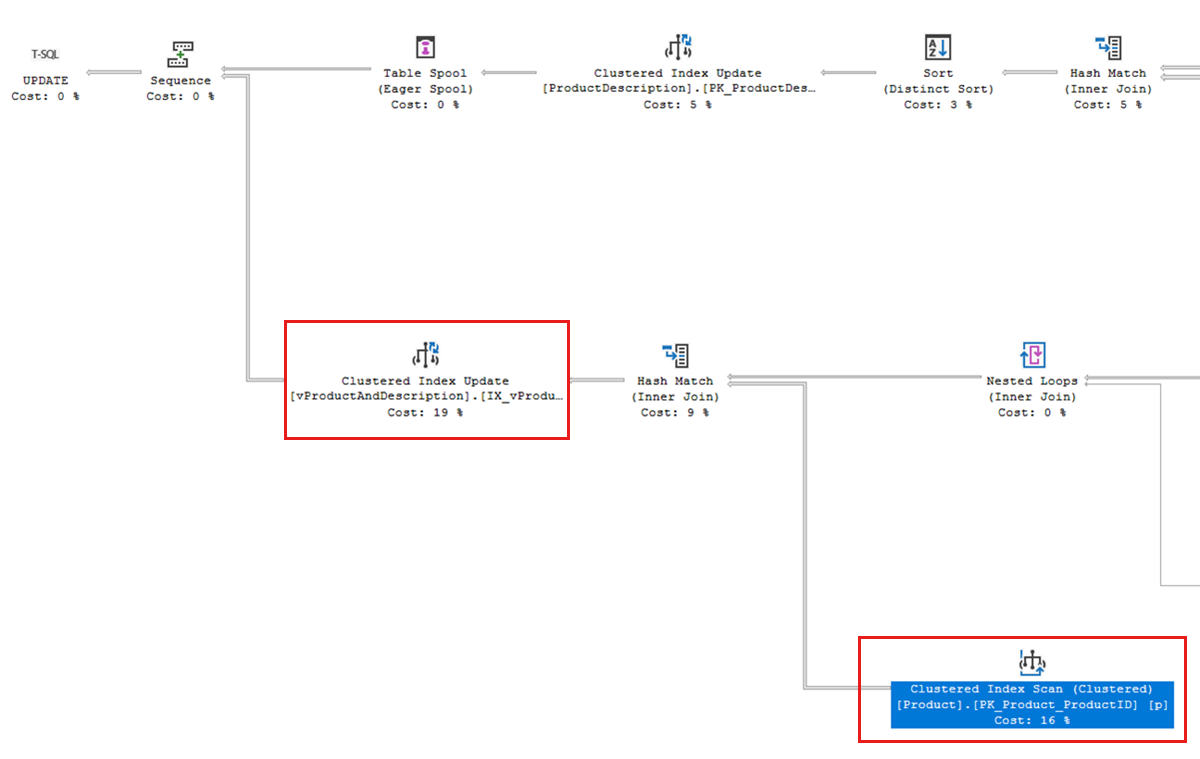
This index scan is being performed because our update query needs to modify an indexed view named
vProductAndDescription. As mentioned in the Look for patterns that increase blocking section of this article, indexed views referencing multiple tables may increase blocking and the likelihood of deadlocks.If we create the following nonclustered index in the
AdventureWorksLTdatabase that "covers" the columns fromSalesLT.Productreferenced by the indexed view, this helps the query find rows much more efficiently:CREATE INDEX ix_Product_ProductID_Name_ProductModelID on SalesLT.Product (ProductID, Name, ProductModelID); GOAfter creating this index, the deadlock no longer reoccurs.
When deadlocks involve modifications to columns referenced in foreign key constraints, ensure that indexes on the referencing table of the FOREIGN KEY support efficiently finding related rows.
While indexes can dramatically improve query performance in some cases, indexes also have overhead and management costs. Review general index design guidelines to help assess the benefit of indexes before creating indexes, especially wide indexes and indexes on large tables.
Assess the value of indexed views. Another option to prevent our example deadlock from reoccurring is to drop the
SalesLT.vProductAndDescriptionindexed view. If that indexed view is not being used, this will reduce the overhead of maintaining the indexed view over time.Use Snapshot isolation. In some cases, setting the transaction isolation level to snapshot for one or more of the transactions involved in a deadlock may prevent blocking and deadlocks from reoccurring.
This technique is most likely to be successful when used on SELECT statements when read committed snapshot is disabled in a database. When read committed snapshot is disabled, SELECT queries using the read committed isolation level require shared (S) locks. Using snapshot isolation on these transactions removes the need for shared locks, which can prevent blocking and deadlocks.
In databases where read committed snapshot isolation has been enabled, SELECT queries do not require shared (S) locks, so deadlocks are more likely to occur between transactions that are modifying data. In cases where deadlocks occur between multiple transactions modifying data, snapshot isolation may result in an update conflict instead of a deadlock. This similarly requires one of the transactions to retry its operation.
Force a plan with Query Store. You may find that one of the queries in the deadlock has multiple execution plans, and the deadlock only occurs when a specific plan is used. You can prevent the deadlock from reoccurring by forcing a plan in Query Store.
Modify the Transact-SQL. You may need to modify Transact-SQL to prevent the deadlock from reoccurring. Modifying Transact-SQL should be done carefully and changes should be rigorously tested to ensure that data is correct when modifications run concurrently. When rewriting Transact-SQL, consider:
- Ordering statements in transactions so that they access objects in the same order.
- Breaking apart transactions into smaller transactions when possible.
- Using query hints, if necessary, to optimize performance. You can apply hints without changing application code using Query Store.
Find more ways to minimize deadlocks in the Deadlocks guide.
Note
In some cases, you may wish to adjust the deadlock priority of one or more sessions involved in a deadlock if it is important for one of the sessions to complete successfully without retrying, or when one of the queries involved in the deadlock is not critical and should be always chosen as the victim. While this does not prevent the deadlock from reoccurring, it may reduce the impact of future deadlocks.
Drop an XEvents session
You may wish to leave an XEvents session collecting deadlock information running on critical databases for long periods. Be aware that if you use an event file target, this may result in large files if multiple deadlocks occur. You may delete blob files from Azure Storage for an active trace, except for the file that is currently being written to.
When you wish to remove an XEvents session, the Transact-SQL drop the session is the same, regardless of the target type selected.
To remove an XEvents session, run the following Transact-SQL. Before running the code, replace the name of the session with the appropriate value.
ALTER EVENT SESSION [deadlocks] ON DATABASE
    STATE = STOP;
GO

DROP EVENT SESSION [deadlocks] ON DATABASE;
GO
Use Azure Storage Explorer
Azure Storage Explorer is a standalone application that simplifies working with event file targets stored in blobs in Azure Storage. You can use Storage Explorer to:
- Create a blob container to hold XEvent session data.
- Get the shared access signature (SAS) for a blob container.
- As mentioned in Collect deadlock graphs in Azure SQL Database with Extended Events, the read, write, and list permissions are required.
- Remove any leading
?character from theQuery stringto use the value as the secret when creating a database scoped credential.
- View and download extended event files from a blob container.
Download Azure Storage Explorer..
Next steps
Learn more about performance in Azure SQL Database:
- Understand and resolve Azure SQL Database blocking problems
- Transaction Locking and Row Versioning Guide
- Deadlocks guide
- SET TRANSACTION ISOLATION LEVEL
- Azure SQL Database: improving performance tuning with automatic tuning
- Deliver consistent performance with Azure SQL
- Retry logic for transient errors.
Feedback
Coming soon: Throughout 2024 we will be phasing out GitHub Issues as the feedback mechanism for content and replacing it with a new feedback system. For more information see: https://aka.ms/ContentUserFeedback.
Submit and view feedback for