Overview dashboard reports available in Partner Center Insights
Appropriate roles: Global admin | Admin agent | Report viewer | Executive report viewer
The Insights Overview dashboard provides a snapshot view of the Key Performance Indicators (KPIs) such as Customers, Subscriptions, Azure Consumption Revenue, and Licenses. You can visualize the following charts in the Overview report.
- Geographical spread of your customers, subscriptions, and licenses
- Top 25 customers by revenue
- Top 25 resellers by revenue
- Product performance with respect to
- Subscriptions
- Revenue
- Licenses
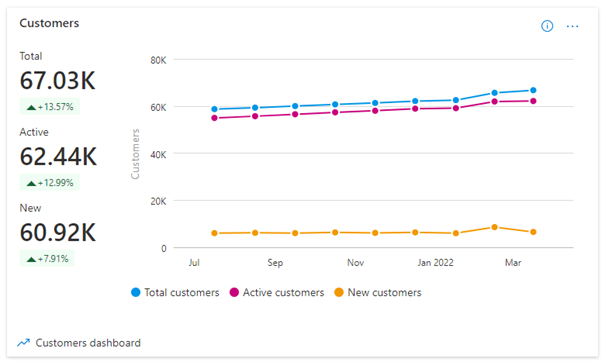
Customers
The Customers area includes:
- The current count of all customers with at least one active subscription associated to your company through different attribution types and across all cloud products.
- The percentage growth of customers during the selected date range.
- The line chart presents the month-over-month trend of the customer count within the selected date range.
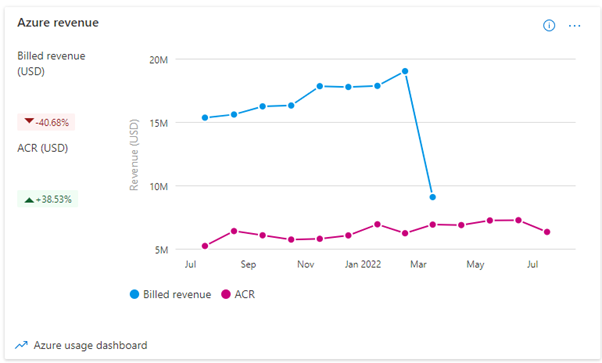
Azure Consumed Revenue (ACR)
The Azure Consumed Revenue (ACR) area on the Summary includes:
- The total ACR (in US dollars) attributed to you over the selected date range.
- The percentage growth or decline in attributed ACR (in US dollars) during the selected date range.
- The micro chart presents a monthly trend of ACR in US dollars attributed to you over the selected date range
Note
ACR data is available to users who have been assigned the Executive report viewer role. CSP Resellers will not be able to access the revenue related information on this page. Hence, this widget will not be visible to the Resellers. We apologize for any inconvenience this may cause. Thank you for your understanding and cooperation.
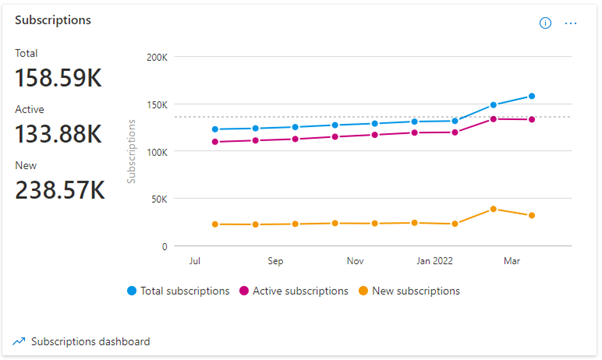
Subscriptions sold
The Subscriptions sold area on the Summary includes:
- The total current count of Cloud product subscriptions (active and inactive) sold or managed by you.
- The percentage growth or decline in subscriptions during the selected date range.
- The micro chart presents the month-over-month trend of total subscriptions over the selected date range.
Active subscriptions
The Active subscriptions area on the Summary includes:
- The current count of Cloud product subscriptions with active usage measured based on product telemetry. This excludes all trial Azure subscriptions.
- The percentage growth of active subscriptions over the selected date range.
- The line chart presents the month-over-month trend of active subscriptions over the selected date range.
Licenses deployed
The Licenses deployed area on the Summary includes:
- The count of all Cloud product licenses deployed in your customer subscriptions over the selected time period.
- The percentage growth or decline in these licenses during the selected date range.
- The micro chart shows the month-over month trend of these assigned licenses count over the selected date range.
Geographical spread of your customers, subscriptions, and licenses
This view is a geographical distribution of total customers, subscriptions, and licenses by customer country/region. Select the different tabs to view each of these insights in the table. You can search and select a country/region in the table. Clicking each tab (for example, Customers, Subscriptions) shows the value of the metric for each country/region and the percent of Total for the country/region.

Customers growth trend
Monthly trend of total customers counts for the selected date range. X-axis represents months of the selected date range and Y-axis represents total customer count for that month.
Subscriptions growth trend
This indicates the trend of your customer subscriptions count for the selected date range. X-axis represents months of the selected date range and Y-axis represents subscriptions count of the product have selected. Scroll through the slider on top of the chart to zoom the chart to specific time period.
Azure Consumed Revenue growth trend
Monthly trend of Azure consumed revenue in US dollars attributed to you over the selected date range. X-axis represents months of the selected date range and Y-axis represents total Azure consumed revenue in US dollars attributed to you during the month.
Note
ACR will only be visible to users who have been assigned the Executive report viewer role. CSP Resellers will not be able to access the revenue related information on this page. Hence, this widget will not be visible to the Resellers. We apologize for any inconvenience this may cause. Thank you for your understanding and cooperation.

Licenses growth trend
Trend of licenses assigned by all customers during the selected date range. X-axis represents months of the selected date range and Y-axis represents licenses count of the product you've selected. Scroll through the slider on top of the chart to zoom the chart to specific time period.

Top 25 customers by revenue
Trend of revenue for the top 25 customers during the selected date range. X-axis represents months of the selected date range and Y-axis represents revenue for the customer you've selected. You can choose any of the product in the product families for example, Office 365, Dynamics 365, Azure, EMS, or Power BI.

Note
CSP Resellers will not be able to access the revenue related information on this page. Hence, this widget will not be visible to the Resellers. We apologize for any inconvenience this may cause. Thank you for your understanding and cooperation.
Top 25 resellers by revenue
Trend of revenue for the top 25 resellers during the selected date range. X-axis represents months of the selected date range and Y-axis represents revenue for the reseller you've selected. You can choose any of the products in the product families for example, Office 365, Dynamics 365, Azure, EMS, or Power BI.

Note
CSP Resellers will not be able to access the revenue related information on this page. Hence, this widget will not be visible to the Resellers. We apologize for any inconvenience this may cause. Thank you for your understanding and cooperation.
Next steps
- For more reports, see Partner Center Insights.
Feedback
Coming soon: Throughout 2024 we will be phasing out GitHub Issues as the feedback mechanism for content and replacing it with a new feedback system. For more information see: https://aka.ms/ContentUserFeedback.
Submit and view feedback for