Troubleshoot high-CPU-usage issues in SQL Server
Applies to: SQL Server
This article provides procedures to diagnose and fix issues that are caused by high CPU usage on a computer that's running Microsoft SQL Server. Although there are many possible causes of high CPU usage that occur in SQL Server, the following ones are the most common causes:
- High logical reads that are caused by table or index scans because of the following conditions:
- Out-of-date statistics
- Missing indexes
- Parameter sensitive plan (PSP) issues
- Poorly designed queries
- Increase in workload
You can use the following steps to troubleshoot high-CPU-usage issues in SQL Server.
Step 1: Verify that SQL Server is causing high CPU usage
Use one of the following tools to check whether the SQL Server process is actually contributing to high CPU usage:
Task Manager: On the Process tab, check whether the CPU column value for SQL Server Windows NT-64 Bit is close to 100 percent.
Performance and Resource Monitor (perfmon)
- Counter:
Process/%User Time,% Privileged Time - Instance: sqlservr
- Counter:
You can use the following PowerShell script to collect the counter data over a 60-second span:
$serverName = $env:COMPUTERNAME
$Counters = @(
    ("\\$serverName" + "\Process(sqlservr*)\% User Time"), ("\\$serverName" + "\Process(sqlservr*)\% Privileged Time")
)
Get-Counter -Counter $Counters -MaxSamples 30 | ForEach {
    $_.CounterSamples | ForEach {
        [pscustomobject]@{
            TimeStamp = $_.TimeStamp
            Path = $_.Path
            Value = ([Math]::Round($_.CookedValue, 3))
        }
        Start-Sleep -s 2
    }
}
If % User Time is consistently greater than 90 percent (% User Time is the sum of processor time on each processor, its maximum value is 100% * (no of CPUs)), the SQL Server process is causing high CPU usage. However, if % Privileged time is consistently greater than 90 percent, your antivirus software, other drivers, or another OS component on the computer is contributing to high CPU usage. You should work with your system administrator to analyze the root cause of this behavior.
Step 2: Identify queries contributing to CPU usage
If the Sqlservr.exe process is causing high CPU usage, by far, the most common reason is SQL Server queries that perform table or index scans, followed by sort, hash operations and loops (nested loop operator or WHILE (T-SQL)). To get an idea of how much CPU the queries are currently using, out of overall CPU capacity, run the following statement:
DECLARE @init_sum_cpu_time int,
        @utilizedCpuCount int
--get CPU count used by SQL Server
SELECT @utilizedCpuCount = COUNT( * )
FROM sys.dm_os_schedulers
WHERE status = 'VISIBLE ONLINE'
--calculate the CPU usage by queries OVER a 5 sec interval
SELECT @init_sum_cpu_time = SUM(cpu_time) FROM sys.dm_exec_requests
WAITFOR DELAY '00:00:05'
SELECT CONVERT(DECIMAL(5,2), ((SUM(cpu_time) - @init_sum_cpu_time) / (@utilizedCpuCount * 5000.00)) * 100) AS [CPU from Queries as Percent of Total CPU Capacity]
FROM sys.dm_exec_requests
To identify the queries that are responsible for high-CPU activity currently, run the following statement:
SELECT TOP 10 s.session_id,
           r.status,
           r.cpu_time,
           r.logical_reads,
           r.reads,
           r.writes,
           r.total_elapsed_time / (1000 * 60) 'Elaps M',
           SUBSTRING(st.TEXT, (r.statement_start_offset / 2) + 1,
           ((CASE r.statement_end_offset
                WHEN -1 THEN DATALENGTH(st.TEXT)
                ELSE r.statement_end_offset
            END - r.statement_start_offset) / 2) + 1) AS statement_text,
           COALESCE(QUOTENAME(DB_NAME(st.dbid)) + N'.' + QUOTENAME(OBJECT_SCHEMA_NAME(st.objectid, st.dbid))
           + N'.' + QUOTENAME(OBJECT_NAME(st.objectid, st.dbid)), '') AS command_text,
           r.command,
           s.login_name,
           s.host_name,
           s.program_name,
           s.last_request_end_time,
           s.login_time,
           r.open_transaction_count
FROM sys.dm_exec_sessions AS s
JOIN sys.dm_exec_requests AS r ON r.session_id = s.session_id CROSS APPLY sys.Dm_exec_sql_text(r.sql_handle) AS st
WHERE r.session_id != @@SPID
ORDER BY r.cpu_time DESC
If queries aren't driving the CPU at this moment, you can run the following statement to look for historical CPU-bound queries:
SELECT TOP 10  qs.last_execution_time, st.text AS batch_text,
    SUBSTRING(st.TEXT, (qs.statement_start_offset / 2) + 1, ((CASE qs.statement_end_offset WHEN - 1 THEN DATALENGTH(st.TEXT) ELSE qs.statement_end_offset END - qs.statement_start_offset) / 2) + 1) AS statement_text,
    (qs.total_worker_time / 1000) / qs.execution_count AS avg_cpu_time_ms,
    (qs.total_elapsed_time / 1000) / qs.execution_count AS avg_elapsed_time_ms,
    qs.total_logical_reads / qs.execution_count AS avg_logical_reads,
    (qs.total_worker_time / 1000) AS cumulative_cpu_time_all_executions_ms,
    (qs.total_elapsed_time / 1000) AS cumulative_elapsed_time_all_executions_ms
FROM sys.dm_exec_query_stats qs
CROSS APPLY sys.dm_exec_sql_text(sql_handle) st
ORDER BY(qs.total_worker_time / qs.execution_count) DESC
Step 3: Update statistics
After you identify the queries that have the highest CPU consumption, update statistics of the tables that are used by these queries. You can use the sp_updatestats system stored procedure to update the statistics of all user-defined and internal tables in the current database. For example:
exec sp_updatestats
Note
The sp_updatestats system stored procedure runs UPDATE STATISTICS against all user-defined and internal tables in the current database. For regular maintenance, ensure that regularly schedule maintenance is keeping statistics up to date. Use solutions such as Adaptive Index Defrag to automatically manage index defragmentation and statistics updates for one or more databases. This procedure automatically chooses whether to rebuild or reorganize an index according to its fragmentation level, among other parameters, and update statistics with a linear threshold.
For more information about sp_updatestats, see sp_updatestats.
If SQL Server is still using excessive CPU capacity, go to the next step.
Step 4: Add missing indexes
Missing indexes can lead to slower running queries and high CPU usage. You can identify missing indexes and create them to help improve this performance impact.
Run the following query to identify queries that cause high CPU usage and that contain at least one missing index in the query plan:
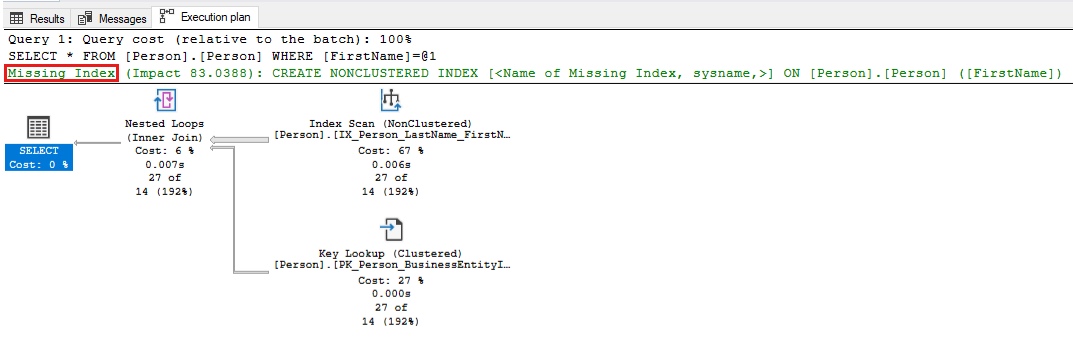
-- Captures the Total CPU time spent by a query along with the query plan and total executions
SELECT
    qs_cpu.total_worker_time / 1000 AS total_cpu_time_ms,
    q.[text],
    p.query_plan,
    qs_cpu.execution_count,
    q.dbid,
    q.objectid,
    q.encrypted AS text_encrypted
FROM
    (SELECT TOP 500 qs.plan_handle,
     qs.total_worker_time,
     qs.execution_count FROM sys.dm_exec_query_stats qs ORDER BY qs.total_worker_time DESC) AS qs_cpu
CROSS APPLY sys.dm_exec_sql_text(plan_handle) AS q
CROSS APPLY sys.dm_exec_query_plan(plan_handle) p
WHERE p.query_plan.exist('declare namespace
        qplan = "http://schemas.microsoft.com/sqlserver/2004/07/showplan";
        //qplan:MissingIndexes')=1
Review the execution plans for the queries that are identified, and tune the query by making the required changes. The following screenshot shows an example in which SQL Server will point out a missing index for your query. Right-click the Missing index portion of the query plan, and then select Missing Index Details to create the index in another window in SQL Server Management Studio.
Use the following query to check for missing indexes and apply any recommended indexes that have high improvement measure values. Start with the top 5 or 10 recommendations from the output that have the highest improvement_measure value. Those indexes have the most significant positive effect on performance. Decide whether you want to apply these indexes and make sure that performance testing is done for the application. Then, continue to apply missing-index recommendations until you achieve the desired application performance results. For more information on this topic, see Tune nonclustered indexes with missing index suggestions.
SELECT CONVERT(VARCHAR(30), GETDATE(), 126) AS runtime,
    mig.index_group_handle,
    mid.index_handle,
    CONVERT(DECIMAL(28, 1), migs.avg_total_user_cost * migs.avg_user_impact * (migs.user_seeks + migs.user_scans)) AS improvement_measure,
    'CREATE INDEX missing_index_' + CONVERT(VARCHAR, mig.index_group_handle) + '_' + CONVERT(VARCHAR, mid.index_handle) + ' ON ' + mid.statement + ' (' + ISNULL(mid.equality_columns,
        '') + CASE WHEN mid.equality_columns IS NOT NULL
AND mid.inequality_columns IS NOT NULL THEN ','
ELSE ''
END + ISNULL(mid.inequality_columns,
        '') + ')' + ISNULL(' INCLUDE (' + mid.included_columns + ')',
        '') AS create_index_statement,
    migs.*,
    mid.database_id,
    mid.[object_id]
FROM sys.dm_db_missing_index_groups mig
INNER JOIN sys.dm_db_missing_index_group_stats migs ON migs.group_handle = mig.index_group_handle
INNER JOIN sys.dm_db_missing_index_details mid ON mig.index_handle = mid.index_handle
WHERE CONVERT (DECIMAL (28, 1),
               migs.avg_total_user_cost * migs.avg_user_impact * (migs.user_seeks + migs.user_scans)) > 10
ORDER BY migs.avg_total_user_cost * migs.avg_user_impact * (migs.user_seeks + migs.user_scans) DESC

Step 5: Investigate and resolve parameter-sensitive issues
You can use the DBCC FREEPROCCACHE command to free plan cache and check whether this resolves the high-CPU-usage issue. If the issue is fixed, it's an indication of a parameter-sensitive problem (PSP, also known as "parameter sniffing issue").
Note
Using the DBCC FREEPROCCACHE without parameters removes all compiled plans from plan cache. This will cause new query executions to be compiled again, which will lead to one-time longer duration for each new query. The best approach is to use DBCC FREEPROCCACHE ( plan_handle | sql_handle ) to identify which query may be causing the issue and then address that individual query or queries.
To mitigate the parameter-sensitive issues, use the following methods. Each method has associated tradeoffs and drawbacks.
Use the RECOMPILE query hint. You can add a
RECOMPILEquery hint to one or more of the high-CPU queries that are identified in step 2. This hint helps balance the slight increase in compilation CPU usage with a more optimal performance for each query execution. For more information, see Parameters and Execution Plan Reuse, Parameter Sensitivity and RECOMPILE query hint.Here's an example of how you can apply this hint to your query.
SELECT * FROM Person.Person
WHERE LastName = 'Wood'
OPTION (RECOMPILE)
Use the OPTIMIZE FOR query hint to override the actual parameter value with a more typical parameter value that covers most values in the data. This option requires a full understanding of optimal parameter values and associated plan characteristics. Here's an example of how to use this hint in your query.
DECLARE @LastName Name = 'Frintu'
SELECT FirstName, LastName FROM Person.Person
WHERE LastName = @LastName
OPTION (OPTIMIZE FOR (@LastName = 'Wood'))
Use the OPTIMIZE FOR UNKNOWN query hint to override the actual parameter value with the density vector average. You can also do this by capturing the incoming parameter values in local variables, and then using the local variables within the predicates instead of using the parameters themselves. For this fix, the average density may be sufficient to provide acceptable performance.
Use the DISABLE_PARAMETER_SNIFFING query hint to disable parameter sniffing completely. Here's an example of how to use it in a query:
SELECT * FROM Person.Address
WHERE City = 'SEATTLE' AND PostalCode = 98104
OPTION (USE HINT ('DISABLE_PARAMETER_SNIFFING'))
Use the KEEPFIXED PLAN query hint to prevent recompilations in cache. This workaround assumes that the "good enough" common plan is the one that's already in cache. You can also disable automatic statistics updates to reduce the chances that the good plan will be evicted and a new bad plan will be compiled.
Use the DBCC FREEPROCCACHE command as a temporary solution until the application code is fixed. You can use the
DBCC FREEPROCCACHE (plan_handle)command to remove only the plan that is causing the issue. For example, to find query plans that reference thePerson.Persontable in AdventureWorks, you can use this query to find the query handle. Then you can release the specific query plan from cache by using theDBCC FREEPROCCACHE (plan_handle)that is produced in the second column of the query results.SELECT text, 'DBCC FREEPROCCACHE (0x' + CONVERT(VARCHAR (512), plan_handle, 2) + ')' AS dbcc_freeproc_command FROM sys.dm_exec_cached_plans CROSS APPLY sys.dm_exec_query_plan(plan_handle) CROSS APPLY sys.dm_exec_sql_text(plan_handle) WHERE text LIKE '%person.person%'
Step 6: Investigate and resolve SARGability issues
A predicate in a query is considered SARGable (Search ARGument-able) when SQL Server engine can use an index seek to speed up the execution of the query. Many query designs prevent SARGability and lead to table or index scans and high-CPU usage. Consider the following query against the AdventureWorks database where every ProductNumber must be retrieved and the SUBSTRING() function applied to it, before it's compared to a string literal value. As you can see, you have to fetch all the rows of the table first, and then apply the function before you can make a comparison. Fetching all rows from the table means a table or index scan, which leads to higher CPU usage.
SELECT ProductID, Name, ProductNumber
FROM [Production].[Product]
WHERE SUBSTRING(ProductNumber, 0, 4) =  'HN-'
Applying any function or computation on the column(s) in the search predicate generally makes the query non-sargable and leads to higher CPU consumption. Solutions typically involve rewriting the queries in a creative way to make the SARGable. A possible solution to this example is this rewrite where the function is removed from the query predicate, another column is searched and the same results are achieved:
SELECT ProductID, Name, ProductNumber
FROM [Production].[Product]
WHERE Name LIKE  'Hex%'
Here's another example, where a sales manager may want to give 10% sales commission on large orders and wants to see which orders will have commission greater than $300. Here's the logical, but non-sargable way to do it.
SELECT DISTINCT SalesOrderID, UnitPrice, UnitPrice * 0.10 [10% Commission]
FROM [Sales].[SalesOrderDetail]
WHERE UnitPrice * 0.10 > 300
Here's a possible less-intuitive but SARGable rewrite of the query, in which the computation is moved to the other side of the predicate.
SELECT DISTINCT SalesOrderID, UnitPrice, UnitPrice * 0.10 [10% Commission]
FROM [Sales].[SalesOrderDetail]
WHERE UnitPrice > 300/0.10
SARGability applies not only to WHERE clauses, but also to JOINs, HAVING, GROUP BY and ORDER BY clauses. Frequent occurrences of SARGability prevention in queries involve CONVERT(), CAST(), ISNULL(), COALESCE() functions used in WHERE or JOIN clauses that lead to scan of columns. In the data-type conversion cases (CONVERT or CAST), the solution may be to ensure you're comparing the same data types. Here's an example where the T1.ProdID column is explicitly converted to the INT data type in a JOIN. The conversion defeats the use of an index on the join column. The same issue occurs with implicit conversion where the data types are different and SQL Server converts one of them to perform the join.
SELECT T1.ProdID, T1.ProdDesc
FROM T1 JOIN T2
ON CONVERT(int, T1.ProdID) = T2.ProductID
WHERE t2.ProductID BETWEEN 200 AND 300
To avoid a scan of the T1 table, you can change the underlying data type of the ProdID column after proper planning and design, and then join the two columns without using the convert function ON T1.ProdID = T2.ProductID.
Another solution is to create a computed column in T1 that uses the same CONVERT() function and then create an index on it. This will allow the query optimizer to use that index without the need for you to change your query.
ALTER TABLE dbo.T1  ADD IntProdID AS CONVERT (INT, ProdID);
CREATE INDEX IndProdID_int ON dbo.T1 (IntProdID);
In some cases, queries can't be rewritten easily to allow for SARGability. In those cases, see if the computed column with an index on it can help, or else keep the query as it was with the awareness that it can lead to higher CPU scenarios.
Step 7: Disable heavy tracing
Check for SQL Trace or XEvent tracing that affects the performance of SQL Server and causes high CPU usage. For example, using the following events may cause high CPU usage if you trace heavy SQL Server activity:
- Query plan XML events (
query_plan_profile,query_post_compilation_showplan,query_post_execution_plan_profile,query_post_execution_showplan,query_pre_execution_showplan) - Statement-level events (
sql_statement_completed,sql_statement_starting,sp_statement_starting,sp_statement_completed) - Log-in and log-out events (
login,process_login_finish,login_event,logout) - Lock events (
lock_acquired,lock_cancel,lock_released) - Wait events (
wait_info,wait_info_external) - SQL Audit events (depending on the group audited and SQL Server activity in that group)
Run the following queries to identify active XEvent or Server traces:
PRINT '--Profiler trace summary--'
SELECT traceid, property, CONVERT(VARCHAR(1024), value) AS value FROM::fn_trace_getinfo(
    default)
GO
PRINT '--Trace event details--'
SELECT trace_id,
    status,
    CASE WHEN row_number = 1 THEN path ELSE NULL end AS path,
    CASE WHEN row_number = 1 THEN max_size ELSE NULL end AS max_size,
    CASE WHEN row_number = 1 THEN start_time ELSE NULL end AS start_time,
    CASE WHEN row_number = 1 THEN stop_time ELSE NULL end AS stop_time,
    max_files,
    is_rowset,
    is_rollover,
    is_shutdown,
    is_default,
    buffer_count,
    buffer_size,
    last_event_time,
    event_count,
    trace_event_id,
    trace_event_name,
    trace_column_id,
    trace_column_name,
    expensive_event
FROM
    (SELECT t.id AS trace_id,
     row_number() over(PARTITION BY t.id order by te.trace_event_id, tc.trace_column_id) AS row_number,
     t.status,
     t.path,
     t.max_size,
     t.start_time,
     t.stop_time,
     t.max_files,
     t.is_rowset,
     t.is_rollover,
     t.is_shutdown,
     t.is_default,
     t.buffer_count,
     t.buffer_size,
     t.last_event_time,
     t.event_count,
     te.trace_event_id,
     te.name AS trace_event_name,
     tc.trace_column_id,
     tc.name AS trace_column_name,
     CASE WHEN te.trace_event_id in (23, 24, 40, 41, 44, 45, 51, 52, 54, 68, 96, 97, 98, 113, 114, 122, 146, 180) THEN CAST(1 as bit) ELSE CAST(0 AS BIT) END AS expensive_event FROM sys.traces t CROSS APPLY::fn_trace_geteventinfo(t.id) AS e JOIN sys.trace_events te ON te.trace_event_id = e.eventid JOIN sys.trace_columns tc ON e.columnid = trace_column_id) AS x
GO
PRINT '--XEvent Session Details--'
SELECT sess.NAME 'session_name', event_name, xe_event_name, trace_event_id,
    CASE WHEN xemap.trace_event_id IN(23, 24, 40, 41, 44, 45, 51, 52, 54, 68, 96, 97, 98, 113, 114, 122, 146, 180)
    THEN Cast(1 AS BIT)
ELSE Cast(0 AS BIT)
END AS expensive_event
FROM sys.dm_xe_sessions sess
JOIN sys.dm_xe_session_events evt
ON sess.address = evt.event_session_address
INNER JOIN sys.trace_xe_event_map xemap
ON evt.event_name = xemap.xe_event_name
GO
Step 8: Fix high CPU usage caused by spinlock contention
To solve common high CPU usage caused by spinlock contention, see the following sections.
SOS_CACHESTORE spinlock contention
If your SQL Server instance experiences heavy SOS_CACHESTORE spinlock contention or you notice that your query plans are often removed on unplanned query workloads, see the following article and enable trace flag T174 by using the DBCC TRACEON (174, -1) command:
If the high-CPU condition is resolved by using T174, enable it as a startup parameter by using SQL Server Configuration Manager.
Random high CPU usage due to SOS_BLOCKALLOCPARTIALLIST spinlock contention on large-memory machines
If your SQL Server instance experiences random high CPU usage due to SOS_BLOCKALLOCPARTIALLIST spinlock contention, we recommend that you apply Cumulative Update 21 for SQL Server 2019. For more information on how to solve the issue, see bug reference 2410400 and DBCC DROPCLEANBUFFERS that provides temporary mitigation.
High CPU usage due to spinlock contention on XVB_list on high-end machines
If your SQL Server instance experiences a high CPU scenario caused by spinlock contention on the XVB_LIST spinlock on high configuration machines (high-end systems with a large number of newer generation processors (CPUs)), enable the trace flag TF8102 together with TF8101.
Note
High CPU usage may result from spinlock contention on many other spinlock types. For more information on spinlocks, see Diagnose and resolve spinlock contention on SQL Server.
Step 9: Configure your virtual machine
If you're using a virtual machine, ensure that you aren't overprovisioning CPUs and that they're configured correctly. For more information, see Troubleshooting ESX/ESXi virtual machine performance issues (2001003).
Step 10: Scale up system to use more CPUs
If individual query instances are using little CPU capacity, but the overall workload of all queries together causes high CPU consumption, consider scaling up your computer by adding more CPUs. Use the following query to find the number of queries that have exceeded a certain threshold of average and maximum CPU consumption per execution and have run many times on the system (make sure that you modify the values of the two variables to match your environment):
-- Shows queries where Max and average CPU time exceeds 200 ms and executed more than 1000 times
DECLARE @cputime_threshold_microsec INT = 200*1000
DECLARE @execution_count INT = 1000
SELECT qs.total_worker_time/1000 total_cpu_time_ms,
       qs.max_worker_time/1000 max_cpu_time_ms,
       (qs.total_worker_time/1000)/execution_count average_cpu_time_ms,
       qs.execution_count,
       q.[text]
FROM sys.dm_exec_query_stats qs CROSS APPLY sys.dm_exec_sql_text(plan_handle) AS q
WHERE (qs.total_worker_time/execution_count > @cputime_threshold_microsec
        OR qs.max_worker_time > @cputime_threshold_microsec )
        AND execution_count > @execution_count
ORDER BY  qs.total_worker_time DESC
See also
Feedback
Coming soon: Throughout 2024 we will be phasing out GitHub Issues as the feedback mechanism for content and replacing it with a new feedback system. For more information see: https://aka.ms/ContentUserFeedback.
Submit and view feedback for