Troubleshoot a query that shows a significant performance difference between two servers
Applies to: SQL Server
This article provides troubleshooting steps for a performance issue where a query runs slower on one server than on another server.
Symptoms
Assume there are two servers with SQL Server installed. One of the SQL Server instances contains a copy of a database in the other SQL Server instance. When you run a query against the databases on both servers, the query runs slower on one server than the other.
The following steps can help troubleshoot this issue.
Step 1: Determine whether it's a common issue with multiple queries
Use one of the following two methods to compare the performance for two or more queries on the two servers:
Manually test the queries on both servers:
- Choose several queries for testing with priority placed on queries that are:
- Significantly faster on one server than on the other.
- Important to the user/application.
- Frequently executed or designed to reproduce the issue on demand.
- Sufficiently long to capture data on it (for example, instead of a 5-milliseconds query, choose a 10-seconds query).
- Run the queries on the two servers.
- Compare the elapsed time (duration) on two servers for each query.
- Choose several queries for testing with priority placed on queries that are:
Analyze performance data with SQL Nexus.
- Collect PSSDiag/SQLdiag or SQL LogScout data for the queries on the two servers.
- Import the collected data files with SQL Nexus and compare the queries from the two servers. For more information, see Performance Comparison between two log collections (Slow and Fast for example).
Scenario 1: Only one single query performs differently on the two servers
If only one query performs differently, the issue is more likely specific to the individual query rather than to the environment. In this case, go to Step 2: Collect data and determine the type of performance issue.
Scenario 2: Multiple queries perform differently on the two servers
If multiple queries run slower on one server than the other, the most probable cause is the differences in server or data environment. Go to Diagnose environment differences and see if the comparison between the two servers is valid.
Step 2: Collect data and determine the type of performance issue
Collect Elapsed time, CPU time, and Logical Reads
To collect elapsed time and CPU time of the query on both servers, use one of the following methods that best fits your situation:
For currently executing statements, check total_elapsed_time and cpu_time columns in sys.dm_exec_requests. Run the following query to get the data:
SELECT
    req.session_id
    , req.total_elapsed_time AS duration_ms
    , req.cpu_time AS cpu_time_ms
    , req.total_elapsed_time - req.cpu_time AS wait_time
    , req.logical_reads
    , SUBSTRING (REPLACE (REPLACE (SUBSTRING (ST.text, (req.statement_start_offset/2) + 1,
       ((CASE statement_end_offset
           WHEN -1
           THEN DATALENGTH(ST.text)
           ELSE req.statement_end_offset
         END - req.statement_start_offset)/2) + 1) , CHAR(10), ' '), CHAR(13), ' '),
      1, 512)  AS statement_text
FROM sys.dm_exec_requests AS req
    CROSS APPLY sys.dm_exec_sql_text(req.sql_handle) AS ST
ORDER BY total_elapsed_time DESC;
For past executions of the query, check last_elapsed_time and last_worker_time columns in sys.dm_exec_query_stats. Run the following query to get the data:
SELECT t.text,
     (qs.total_elapsed_time/1000) / qs.execution_count AS avg_elapsed_time,
     (qs.total_worker_time/1000) / qs.execution_count AS avg_cpu_time,
     ((qs.total_elapsed_time/1000) / qs.execution_count ) - ((qs.total_worker_time/1000) / qs.execution_count) AS avg_wait_time,
     qs.total_logical_reads / qs.execution_count AS avg_logical_reads,
     qs.total_logical_writes / qs.execution_count AS avg_writes,
     (qs.total_elapsed_time/1000) AS cumulative_elapsed_time_all_executions
FROM sys.dm_exec_query_stats qs
     CROSS apply sys.Dm_exec_sql_text (sql_handle) t
WHERE t.text like '<Your Query>%'
-- Replace <Your Query> with your query or the beginning part of your query. The special chars like '[','_','%','^' in the query should be escaped.
ORDER BY (qs.total_elapsed_time / qs.execution_count) DESC
Note
If
avg_wait_timeshows a negative value, it's a parallel query.If you can execute the query on demand in SQL Server Management Studio (SSMS) or Azure Data Studio, run it with SET STATISTICS TIME
ONand SET STATISTICS IOON.SET STATISTICS TIME ON SET STATISTICS IO ON <YourQuery> SET STATISTICS IO OFF SET STATISTICS TIME OFFThen from Messages, you'll see the CPU time, elapsed time, and logical reads like this:
  Table 'tblTest'. Scan count 1, logical reads 3, physical reads 0, page server reads 0, read-ahead reads 0, page server read-ahead reads 0, lob logical reads 0, lob physical reads 0, lob page server reads 0, lob read-ahead reads 0, lob page server read-ahead reads 0.

  SQL Server Execution Times:
    CPU time = 460 ms,  elapsed time = 470 ms.
If you can collect a query plan, check the data from the Execution plan properties.
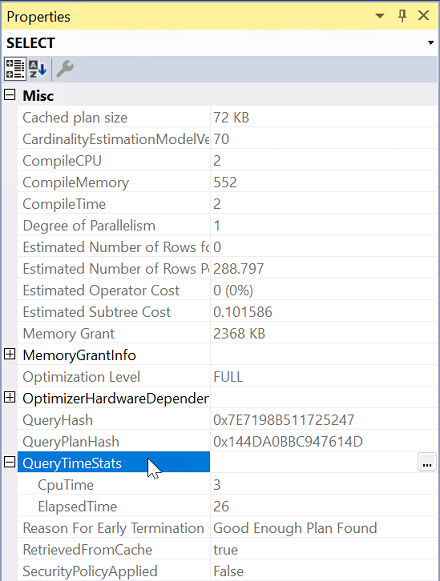
Run the query with Include Actual Execution Plan on.
Select the left-most operator from Execution plan.
From Properties, expand QueryTimeStats property.
Check ElapsedTime and CpuTime.
Compare the elapsed time and CPU time of the query to determine the issue type for both servers.
Type 1: CPU-bound (runner)
If the CPU time is close, equal to, or higher than the elapsed time, you can treat it as a CPU-bound query. For example, if the elapsed time is 3000 milliseconds (ms) and the CPU time is 2900 ms, that means most of the elapsed time is spent on the CPU. Then we can say it's a CPU-bound query.
Examples of running (CPU-bound) queries:
| Elapsed Time (ms) | CPU Time (ms) | Reads (logical) |
|---|---|---|
| 3200 | 3000 | 300000 |
| 1080 | 1000 | 20 |
Logical reads - reading data/index pages in cache - are most frequently the drivers of CPU utilization in SQL Server. There could be scenarios where CPU use comes from other sources: a while loop (in T-SQL or other code like XProcs or SQL CRL objects). The second example in the table illustrates such a scenario, where the majority of the CPU is not from reads.
Note
If the CPU time is greater than the duration, this indicates a parallel query is executed; multiple threads are using the CPU at the same time. For more information, see Parallel queries - runner or waiter.
Type 2: Waiting on a bottleneck (waiter)
A query is waiting on a bottleneck if the elapsed time is significantly greater than the CPU time. The elapsed time includes the time executing the query on the CPU (CPU time) and the time waiting for a resource to be released (wait time). For example, if the elapsed time is 2000 ms and the CPU time is 300 ms, the wait time is 1700 ms (2000 - 300 = 1700). For more information, see Types of Waits.
Examples of waiting queries:
| Elapsed Time (ms) | CPU Time (ms) | Reads (logical) |
|---|---|---|
| 2000 | 300 | 28000 |
| 10080 | 700 | 80000 |
Parallel queries - runner or waiter
Parallel queries may use more CPU time than the overall duration. The goal of parallelism is to allow multiple threads to run parts of a query simultaneously. In one second of clock time, a query may use eight seconds of CPU time by executing eight parallel threads. Therefore, it becomes challenging to determine a CPU-bound or a waiting query based on the elapsed time and CPU time difference. However, as a general rule, follow the principles listed in the above two sections. The summary is:
- If the elapsed time is much greater than the CPU time, consider it a waiter.
- If the CPU time is much greater than the elapsed time, consider it a runner.
Examples of Parallel queries:
| Elapsed Time (ms) | CPU Time (ms) | Reads (logical) |
|---|---|---|
| 1200 | 8100 | 850000 |
| 3080 | 12300 | 1500000 |
Step 3: Compare data from both servers, figure out the scenario, and troubleshoot the issue
Let's assume that there are two machines named Server1 and Server2. And the query runs slower on Server1 than on Server2. Compare the times from both servers and then follow the actions of the scenario that best matches yours from the following sections.
Scenario 1: The query on Server1 uses more CPU time, and the logical reads are higher on Server1 than on Server2
If the CPU time on Server1 is much greater than on Server2 and the elapsed time matches the CPU time closely on both servers, there are no major waits or bottlenecks. The increase in CPU time on Server1 is most likely caused by an increase in logical reads. A significant change in logical reads typically indicates a difference in query plans. For example:
| Server | Elapsed Time (ms) | CPU Time (ms) | Reads (logical) |
|---|---|---|---|
| Server1 | 3100 | 3000 | 300000 |
| Server2 | 1100 | 1000 | 90200 |
Action: Check execution plans and environments
- Compare execution plans of the query on both servers. To do this, use one of the two methods:
- Compare execution plans visually. For more information, see Display an Actual Execution Plan.
- Save the execution plans and compare them by using SQL Server Management Studio Plan Comparison feature.
- Compare environments. Different environments may lead to query plan differences or direct differences in CPU usage. Environments include server versions, database or server configuration settings, trace flags, CPU count or clock speed, and Virtual Machine versus Physical Machine. See Diagnose query plan differences for details.
Scenario 2: The query is a waiter on Server1 but not on Server2
If the CPU times for the query on both servers are similar but the elapsed time on Server1 is much greater than on Server2, the query on Server1 spends a much longer time waiting on a bottleneck. For example:
| Server | Elapsed Time (ms) | CPU Time (ms) | Reads (logical) |
|---|---|---|---|
| Server1 | 4500 | 1000 | 90200 |
| Server2 | 1100 | 1000 | 90200 |
- Waiting time on Server1: 4500 - 1000 = 3500 ms
- Waiting time on Server2: 1100 - 1000 = 100 ms
Action: Check wait types on Server1
Identify and eliminate the bottleneck on Server1. Examples of waits are blocking (lock waits), latch waits, disk I/O waits, network waits, and memory waits. To troubleshoot common bottleneck issues, proceed to Diagnose waits or bottlenecks.
Scenario 3: The queries on both servers are waiters, but the wait types or times are different
For example:
| Server | Elapsed Time (ms) | CPU Time (ms) | Reads (logical) |
|---|---|---|---|
| Server1 | 8000 | 1000 | 90200 |
| Server2 | 3000 | 1000 | 90200 |
- Waiting time on Server1: 8000 - 1000 = 7000 ms
- Waiting time on Server2: 3000 - 1000 = 2000 ms
In this case, the CPU times are similar on both servers, which indicates query plans are likely the same. The queries would perform equally on both servers if they don't wait for the bottlenecks. So the duration differences come from the different amounts of wait time. For example, the query waits on locks on Server1 for 7000 ms while it waits on I/O on Server2 for 2000 ms.
Action: Check wait types on both servers
Address each bottleneck wait individually on each server and speed up executions on both servers. Troubleshooting this issue is labor-intensive because you need to eliminate bottlenecks on both servers and make the performance comparable. To troubleshoot common bottleneck issues, proceed to Diagnose waits or bottlenecks.
Scenario 4: The query on Server1 uses more CPU time than on Server2, but the logical reads are close
For example:
| Server | Elapsed Time (ms) | CPU Time (ms) | Reads (logical) |
|---|---|---|---|
| Server1 | 3000 | 3000 | 90200 |
| Server2 | 1000 | 1000 | 90200 |
If the data matches the following conditions:
- The CPU time on Server1 is much greater than on Server2.
- The elapsed time matches the CPU time closely on each server, which indicates no waits.
- The logical reads, typically the highest driver of CPU time, are similar on both servers.
Then the additional CPU time comes from some other CPU-bound activities. This scenario is the rarest of all the scenarios.
Causes: Tracing, UDFs and CLR integration
This issue may be caused by:
- XEvents/SQL Server tracing, especially with filtering on text columns (database name, login name, query text, and so on). If tracing is enabled on one server but not on the other, this could be the reason for the difference.
- User-defined functions (UDFs) or other T-SQL code that performs CPU-bound operations. This would typically be the cause when other conditions are different on Server1 and Server2, such as data size, CPU clock speed, or Power plan.
- SQL Server CLR integration or Extended Stored procedures (XPs) that may drive CPU but don't perform logical reads. Differences in the DLLs may lead to different CPU times.
- Difference in SQL Server functionality that is CPU-bound (e.g., string-manipulation code).
Action: Check traces and queries
Check traces on both servers for the following:
- If there's any trace enabled on Server1 but not on Server2.
- If any trace is enabled, disable the trace and run the query again on Server1.
- If the query runs faster this time, enable the trace back but remove text filters from it, if there are any.
Check if the query uses UDFs that do string manipulations or do extensive processing on data columns in the
SELECTlist.Check if the query contains loops, function recursions, or nestings.
Diagnose environment differences
Check the following questions and determine whether the comparison between the two servers is valid.
Are the two SQL Server instances the same version or build?
If not, there could be some fixes that caused the differences. Run the following query to get version information on both servers:
SELECT @@VERSIONIs the amount of physical memory similar on both servers?
If one server has 64 GB of memory while the other has 256 GB of memory, that would be a significant difference. With more memory available to cache data/index pages and query plans, the query could be optimized differently based on hardware resource availability.
Are CPU-related hardware configurations similar on both servers? For example:
Number of CPUs varies between machines (24 CPUs on one machine versus 96 CPUs on the other).
Power plans—balanced versus high performance.
Virtual Machine (VM) versus physical (bare metal) machine.
Hyper-V versus VMware—difference in configuration.
Clock speed difference (lower clock speed versus higher clock speed). For example, 2 GHz versus 3.5 GHz can make a difference. To get the clock speed on a server, run the following PowerShell command:
Get-CimInstance Win32_Processor | Select-Object -Expand MaxClockSpeed
Use one of the following two ways to test the CPU speed of the servers. If they don't produce comparable results, the issue is outside of SQL Server. It could be a power plan difference, fewer CPUs, VM-software issue, or clock speed difference.
Run the following PowerShell script on both servers and compare the outputs.
$bf = [System.DateTime]::Now
for ($i = 0; $i -le 20000000; $i++) {}
$af = [System.DateTime]::Now
Write-Host ($af - $bf).Milliseconds " milliseconds"
Write-Host ($af - $bf).Seconds " Seconds"
Run the following Transact-SQL code on both servers and compare the outputs.
SET NOCOUNT ON
DECLARE @spins INT = 0
DECLARE @start_time DATETIME = GETDATE(), @time_millisecond INT

WHILE (@spins < 20000000)
BEGIN
   SET @spins = @spins +1
END

SELECT @time_millisecond = DATEDIFF(millisecond, @start_time, getdate())

SELECT @spins Spins, @time_millisecond Time_ms,  @spins / @time_millisecond Spins_Per_ms
Diagnose waits or bottlenecks
To optimize a query that's waiting on bottlenecks, identify how long the wait is and where the bottleneck is (the wait type). Once the wait type is confirmed, reduce the wait time or eliminate the wait completely.
To calculate the approximate wait time, subtract the CPU time (worker time) from the elapsed time of a query. Typically, the CPU time is the actual execution time, and the remaining part of the lifetime of the query is waiting.
Examples of how to calculate approximate wait duration:
| Elapsed Time (ms) | CPU Time (ms) | Wait time (ms) |
|---|---|---|
| 3200 | 3000 | 200 |
| 7080 | 1000 | 6080 |
Identify the bottleneck or wait
To identify historical long-waiting queries (for example, >20% of the overall elapsed time is wait time), run the following query. This query uses performance statistics for cached query plans since the start of SQL Server.
SELECT t.text,
         qs.total_elapsed_time / qs.execution_count
         AS avg_elapsed_time,
         qs.total_worker_time / qs.execution_count
         AS avg_cpu_time,
         (qs.total_elapsed_time - qs.total_worker_time) / qs.execution_count
         AS avg_wait_time,
         qs.total_logical_reads / qs.execution_count
         AS avg_logical_reads,
         qs.total_logical_writes / qs.execution_count
         AS avg_writes,
         qs.total_elapsed_time
         AS cumulative_elapsed_time
FROM sys.dm_exec_query_stats qs
         CROSS apply sys.Dm_exec_sql_text (sql_handle) t
WHERE (qs.total_elapsed_time - qs.total_worker_time) / qs.total_elapsed_time
         > 0.2
ORDER BY qs.total_elapsed_time / qs.execution_count DESC
To identify currently executing queries with waits longer than 500 ms, run the following query:
SELECT r.session_id, r.wait_type, r.wait_time AS wait_time_ms
FROM sys.dm_exec_requests r
   JOIN sys.dm_exec_sessions s ON r.session_id = s.session_id
WHERE wait_time > 500
AND is_user_process = 1
If you can collect a query plan, check the WaitStats from the execution plan properties in SSMS:
- Run the query with Include Actual Execution Plan on.
- Right-click the left-most operator in the Execution plan tab
- Select Properties and then WaitStats property.
- Check the WaitTimeMs and WaitType.
If you're familiar with PSSDiag/SQLdiag or SQL LogScout LightPerf/GeneralPerf scenarios, consider using either of them to collect performance statistics and identify waiting queries on your SQL Server instance. You can import the collected data files and analyze the performance data with SQL Nexus.
References to help eliminate or reduce waits
The causes and resolutions for each wait type vary. There's no one general method to resolve all wait types. Here are articles to troubleshoot and resolve common wait type issues:
- Understand and resolve blocking issues (LCK_M_*)
- Understand and resolve Azure SQL Database blocking problems
- Troubleshoot slow SQL Server performance caused by I/O issues (PAGEIOLATCH_*, WRITELOG, IO_COMPLETION, BACKUPIO)
- Resolve last-page insert PAGELATCH_EX contention in SQL Server
- Memory grants explanations and solutions (RESOURCE_SEMAPHORE)
- Troubleshoot slow queries that result from ASYNC_NETWORK_IO wait type
- Troubleshooting High HADR_SYNC_COMMIT wait type with Always On Availability Groups
- How It Works: CMEMTHREAD and Debugging Them
- Making parallelism waits actionable (CXPACKET and CXCONSUMER)
- THREADPOOL wait
For descriptions of many Wait types and what they indicate, see the table in Types of Waits.
Diagnose query plan differences
Here are some common causes for differences in query plans:
Data size or data values differences
Is the same database being used on both servers—using the same database backup? Has the data been modified on one server compared to the other? Data differences can lead to different query plans. For example, joining table T1 (1000 rows) with table T2 (2,000,000 rows) is different from joining table T1 (100 rows) with table T2 (2,000,000 rows). The type and speed of the
JOINoperation can be significantly different.Statistics differences
Have statistics been updated on one database and not on the other? Have statistics been updated with a different sample rate (for example, 30% versus 100% full scan)? Ensure that you update statistics on both sides with the same sample rate.
Database compatibility level differences
Check if the compatibility levels of the databases are different between the two servers. To get the database compatibility level, run the following query:
SELECT name, compatibility_level
FROM sys.databases
WHERE name = '<YourDatabase>'
Server version/build differences
Are the versions or builds of SQL Server different between the two servers? For example, is one server SQL Server version 2014 and the other SQL Server version 2016? There could be product changes that can lead to changes in how a query plan is selected. Make sure you compare the same version and build of SQL Server.
SELECT ServerProperty('ProductVersion')Cardinality Estimator (CE) version differences
Check if the legacy cardinality estimator is activated at the database level. For more information about CE, see Cardinality Estimation (SQL Server).
SELECT name, value, is_value_default
FROM sys.database_scoped_configurations
WHERE name = 'LEGACY_CARDINALITY_ESTIMATION'
Optimizer hotfixes enabled/disabled
If the query optimizer hotfixes are enabled on one server but disabled on the other, then different query plans can be generated. For more information, see SQL Server query optimizer hotfix trace flag 4199 servicing model.
To get the state of query optimizer hotfixes, run the following query:
-- Check at server level for TF 4199
DBCC TRACESTATUS (-1)
-- Check at database level
USE <YourDatabase>
SELECT name, value, is_value_default
FROM sys.database_scoped_configurations
WHERE name = 'QUERY_OPTIMIZER_HOTFIXES'
Trace flags differences
Some trace flags affect query plan selection. Check if there are trace flags enabled on one server that aren't enabled on the other. Run the following query on both servers and compare the results:
-- Check at server level for trace flags
DBCC TRACESTATUS (-1)
Hardware differences (CPU count, Memory size)
To get the hardware information, run the following query:
SELECT cpu_count, physical_memory_kb/1024/1024 PhysicalMemory_GB
FROM sys.dm_os_sys_info
Hardware differences according to the query optimizer
Check the
OptimizerHardwareDependentPropertiesof a query plan and see if hardware differences are considered significant for different plans.WITH xmlnamespaces(DEFAULT 'http://schemas.microsoft.com/sqlserver/2004/07/showplan') SELECT txt.text, t.OptHardw.value('@EstimatedAvailableMemoryGrant', 'INT') AS EstimatedAvailableMemoryGrant , t.OptHardw.value('@EstimatedPagesCached', 'INT') AS EstimatedPagesCached, t.OptHardw.value('@EstimatedAvailableDegreeOfParallelism', 'INT') AS EstimatedAvailDegreeOfParallelism, t.OptHardw.value('@MaxCompileMemory', 'INT') AS MaxCompileMemory FROM sys.dm_exec_cached_plans AS cp CROSS APPLY sys.dm_exec_query_plan(cp.plan_handle) AS qp CROSS APPLY qp.query_plan.nodes('//OptimizerHardwareDependentProperties') AS t(OptHardw) CROSS APPLY sys.dm_exec_sql_text (CP.plan_handle) txt WHERE text Like '%<Part of Your Query>%'Optimizer timeout
Is there an optimizer timeout issue? The query optimizer can stop evaluating plan options if the query being executed is too complex. When it stops, it picks the plan with the lowest cost available at the time. This can lead to what seems like an arbitrary plan choice on one server versus another.
SET options
Some SET options are plan-affecting, such as SET ARITHABORT. For more information, see SET Options.
Query Hint differences
Does one query use query hints and the other not? Check the query text manually to establish the presence of query hints.
Parameter-sensitive plans (parameter sniffing issue)
Are you testing the query with the exact same parameter values? If not, then you may start there. Was the plan compiled earlier on one server based on a different parameter value? Test the two queries by using the RECOMPILE query hint to ensure there's no plan reuse taking place. For more information, see Investigate and resolve parameter-sensitive issues.
Different database options/scoped configuration settings
Are the same database options or scoped configuration settings used on both servers? Some database options may influence plan choices. For example, database compatibility, legacy CE versus default CE, and parameter sniffing. Run the following query from one server to compare the database options used on the two servers:
-- On Server1 add a linked server to Server2
EXEC master.dbo.sp_addlinkedserver @server = N'Server2', @srvproduct=N'SQL Server'

-- Run a join between the two servers to compare settings side by side
SELECT
   s1.name AS srv1_config_name,
   s2.name AS srv2_config_name,
   s1.value_in_use AS srv1_value_in_use,
   s2.value_in_use AS srv2_value_in_use,
   Variance = CASE WHEN ISNULL(s1.value_in_use, '##') != ISNULL(s2.value_in_use,'##') THEN 'Different' ELSE '' END
FROM sys.configurations s1
FULL OUTER JOIN [server2].master.sys.configurations s2 ON s1.name = s2.name


SELECT
   s1.name AS srv1_config_name,
   s2.name AS srv2_config_name,
   s1.value srv1_value_in_use,
   s2.value srv2_value_in_use,
   s1.is_value_default,
   s2.is_value_default,
   Variance = CASE WHEN ISNULL(s1.value, '##') != ISNULL(s2.value, '##') THEN 'Different' ELSE '' END
FROM sys.database_scoped_configurations s1
FULL OUTER JOIN [server2].master.sys.database_scoped_configurations s2 ON s1.name = s2.name
Plan guides
Are any plan guides used for your queries on one server but not on the other? Run the following query to establish differences:
SELECT * FROM sys.plan_guides
Feedback
Coming soon: Throughout 2024 we will be phasing out GitHub Issues as the feedback mechanism for content and replacing it with a new feedback system. For more information see: https://aka.ms/ContentUserFeedback.
Submit and view feedback for