Troubleshoot the sensor
This article describes basic troubleshooting tools for the sensor. In addition to the items described here, you can check the health of your system in the following ways:
- Alerts: An alert is created when the sensor interface that monitors the traffic is down.
- SNMP: Sensor health is monitored through SNMP. Microsoft Defender for IoT responds to SNMP queries sent from an authorized monitoring server.
- System notifications: When a management console controls the sensor, you can forward alerts about failed sensor backups and disconnected sensors.
For any other issues, contact Microsoft Support.
Prerequisites
To perform the procedures in this article, make sure that you have:
- Access to the OT network sensor as the default admin user. For more information, see Default privileged on-premises users.
Check sensor - cloud connectivity issues
OT sensors automatically run connectivity checks to ensure that your sensor has access to all required endpoints. If a sensor isn't connected, an error is indicated in the Azure portal, on the Sites and sensors page, and on the sensor's Overview page. For example:
 ```
```
Use the Cloud connectivity troubleshooting page in your OT sensor to learn more about the error that occurred and recommended mitigation actions you can take.
To troubleshoot connectivity errors, sign into your OT sensor and do one of the following:
- From the sensor's Overview page, select the Troubleshoot* link in the error at the top of the page
- Select System settings > Sensor management > Health and troubleshooting > Cloud connectivity troubleshooting
The Cloud connectivity troubleshooting pane opens on the right. If the sensor is connected to the Azure portal, the pane indicates that The sensor is connected to cloud successfully. If the sensor isn't connected, a description of the issue and any mitigation instructions are listed instead. For example:
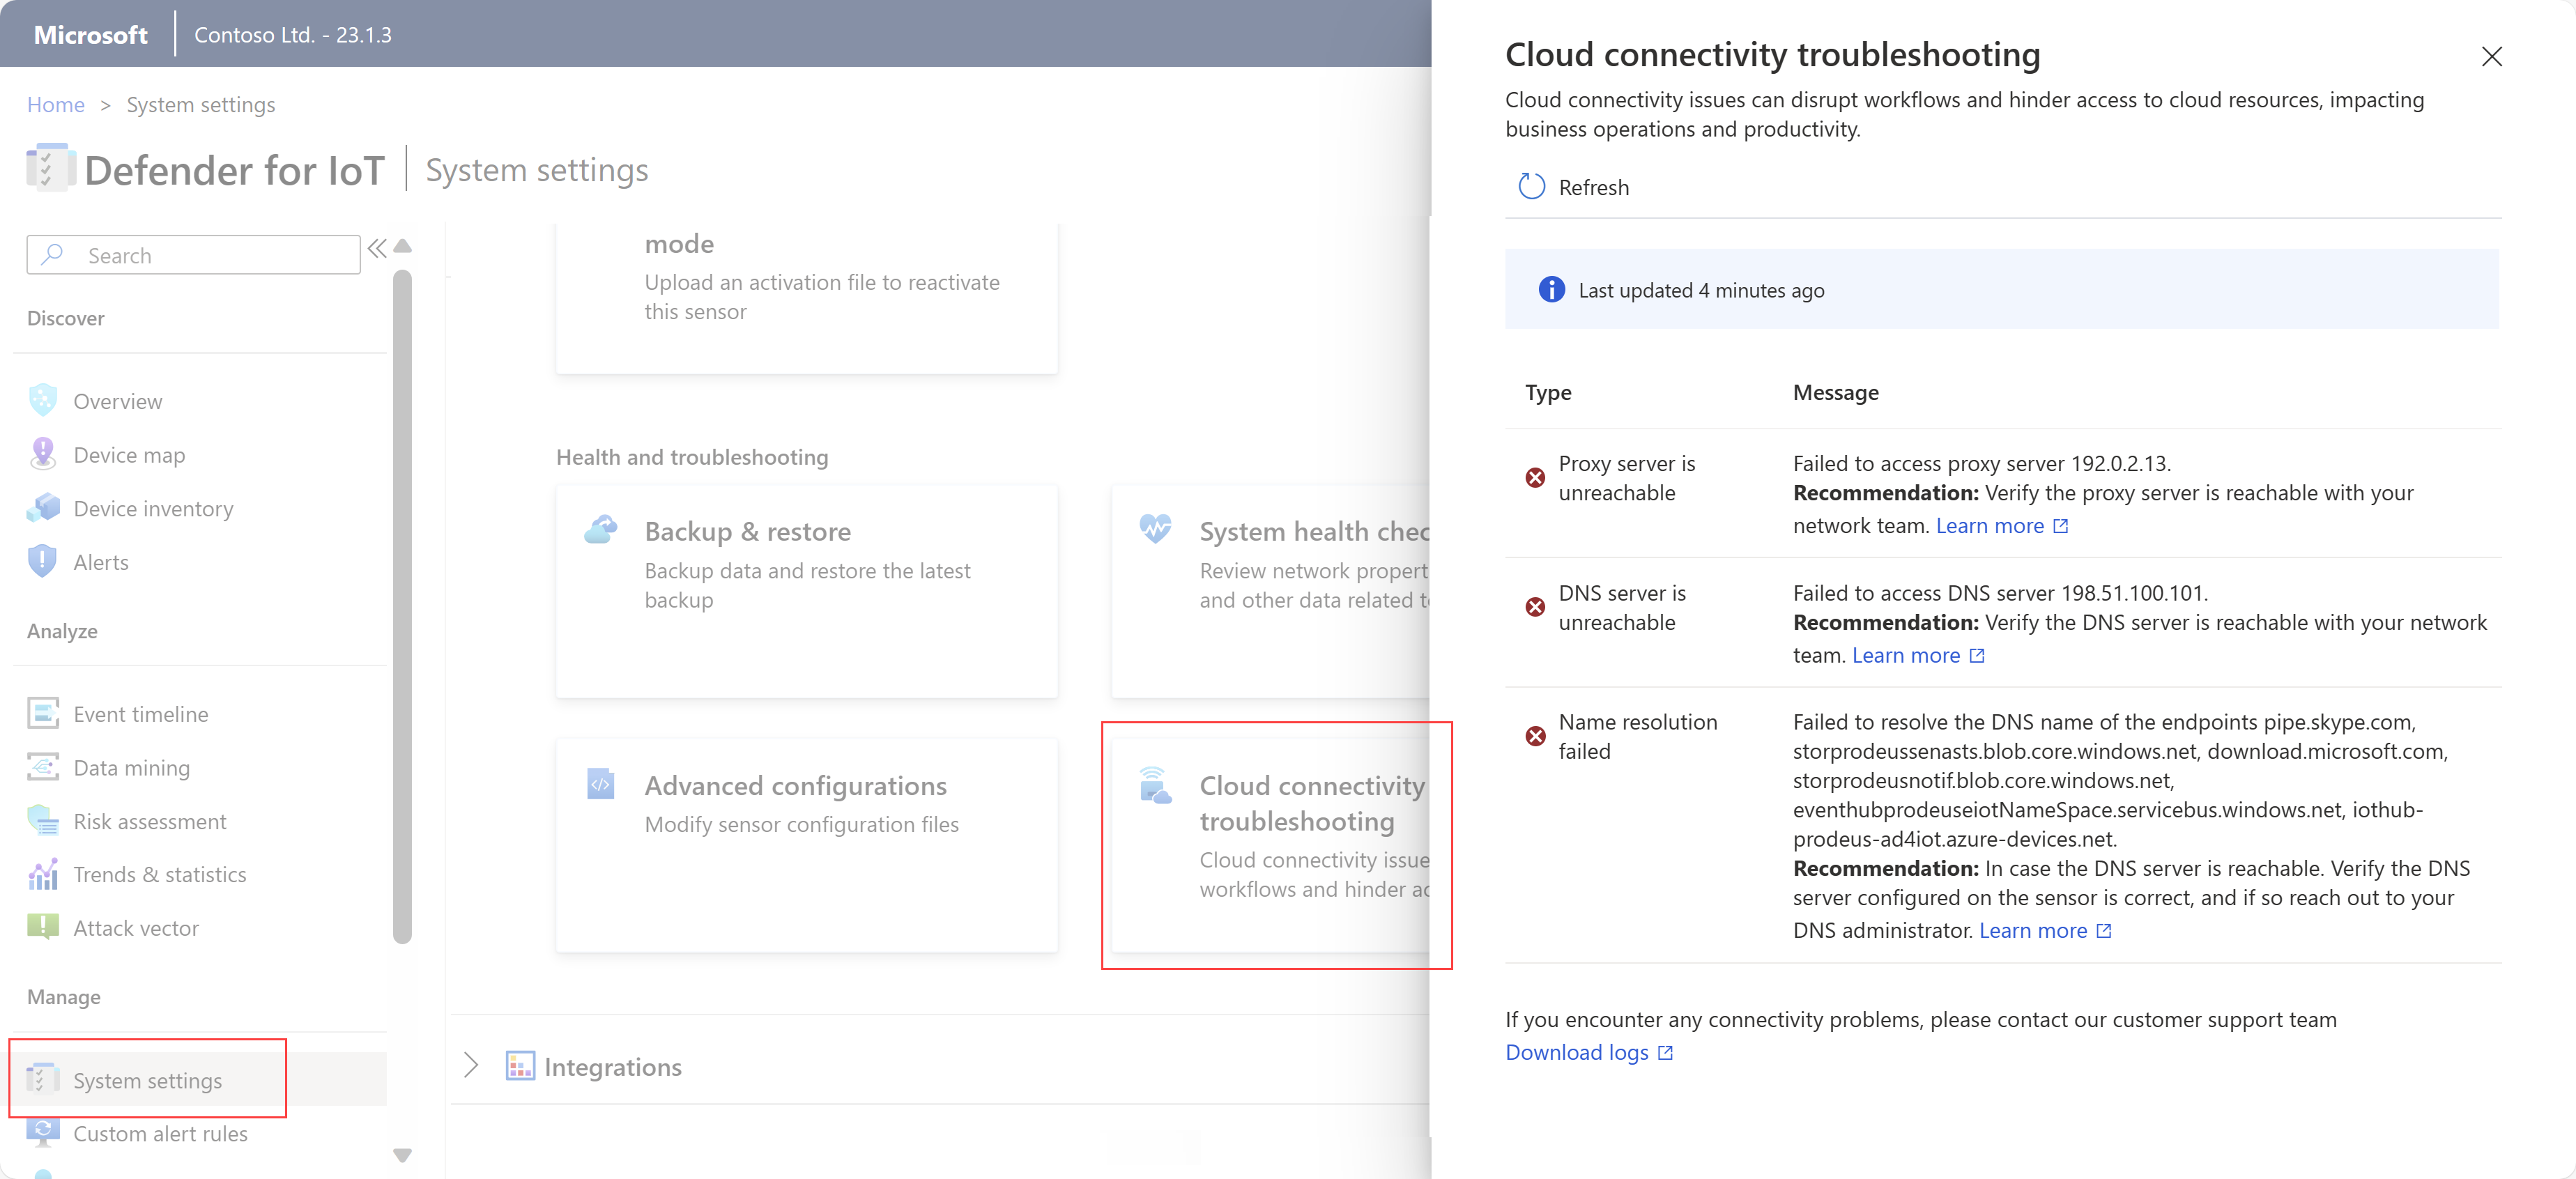
The Cloud connectivity troubleshooting pane covers the following types of issues:
| Issue | Description |
|---|---|
| Errors establishing secure connections | Occurs for SSL errors, which typically means that the sensor doesn't trust the certificate found. This might occur due to an incorrect sensor time configuration, or using an SSL inspection service. SSL inspection services are often found in proxies and can lead to potential certificate errors. For more information, see Manage SSL/TLS certificates and Synchronize time zones on an OT sensor. |
| General connection errors | Occurs when the sensor can't connect with one or more required endpoints. In such cases, ensure that all required endpoints are accessible from your sensor, and consider configuring more endpoints in your firewall. For more information, see Provision sensors for cloud management. |
| Unreachable DNS server errors | Occurs when the sensor can't perform name resolution due to an unreachable DNS server. In such cases, verify that your sensor can access the DNS server. For more information, see Update the OT sensor network configuration |
| Proxy authentication issues | Occurs when a proxy demands authentication, but no credentials, or incorrect credentials, are provided. In such cases, make sure that you've configured the proxy credentials correctly. For more information, see Update the OT sensor network configuration. |
| Name resolution failures | Occurs when the sensor can't perform name resolution for a specific endpoint. In such cases, if your DNS server is reachable, make sure that the DNS server is configured on your sensor correctly. If the configuration is correct, we recommend reaching out to your DNS administrator. For more information, see Update the OT sensor network configuration. |
| Unreachable proxy server errors | Occurs when the sensor can't establish a connection with the proxy server. In such cases, confirm the reachability of your proxy server with your network team. For more information, see Update the OT sensor network configuration. |
| Time drift detected | Occurs when the UTC time of the sensor isn't synchronized with Defender for IoT on the Azure portal. In this case, configure a Network Time Protocol (NTP) server to synchronize the sensor in UTC time. For more information, see Configure OT sensor settings from the Azure portal. |
Check system health
Check your system health from the sensor.
To access the system health tool:
Sign in to the sensor with the admin user credentials and select System Settings >
 System health check.
In the System health check pane, select a command from the menu to view more details in the box. For example:
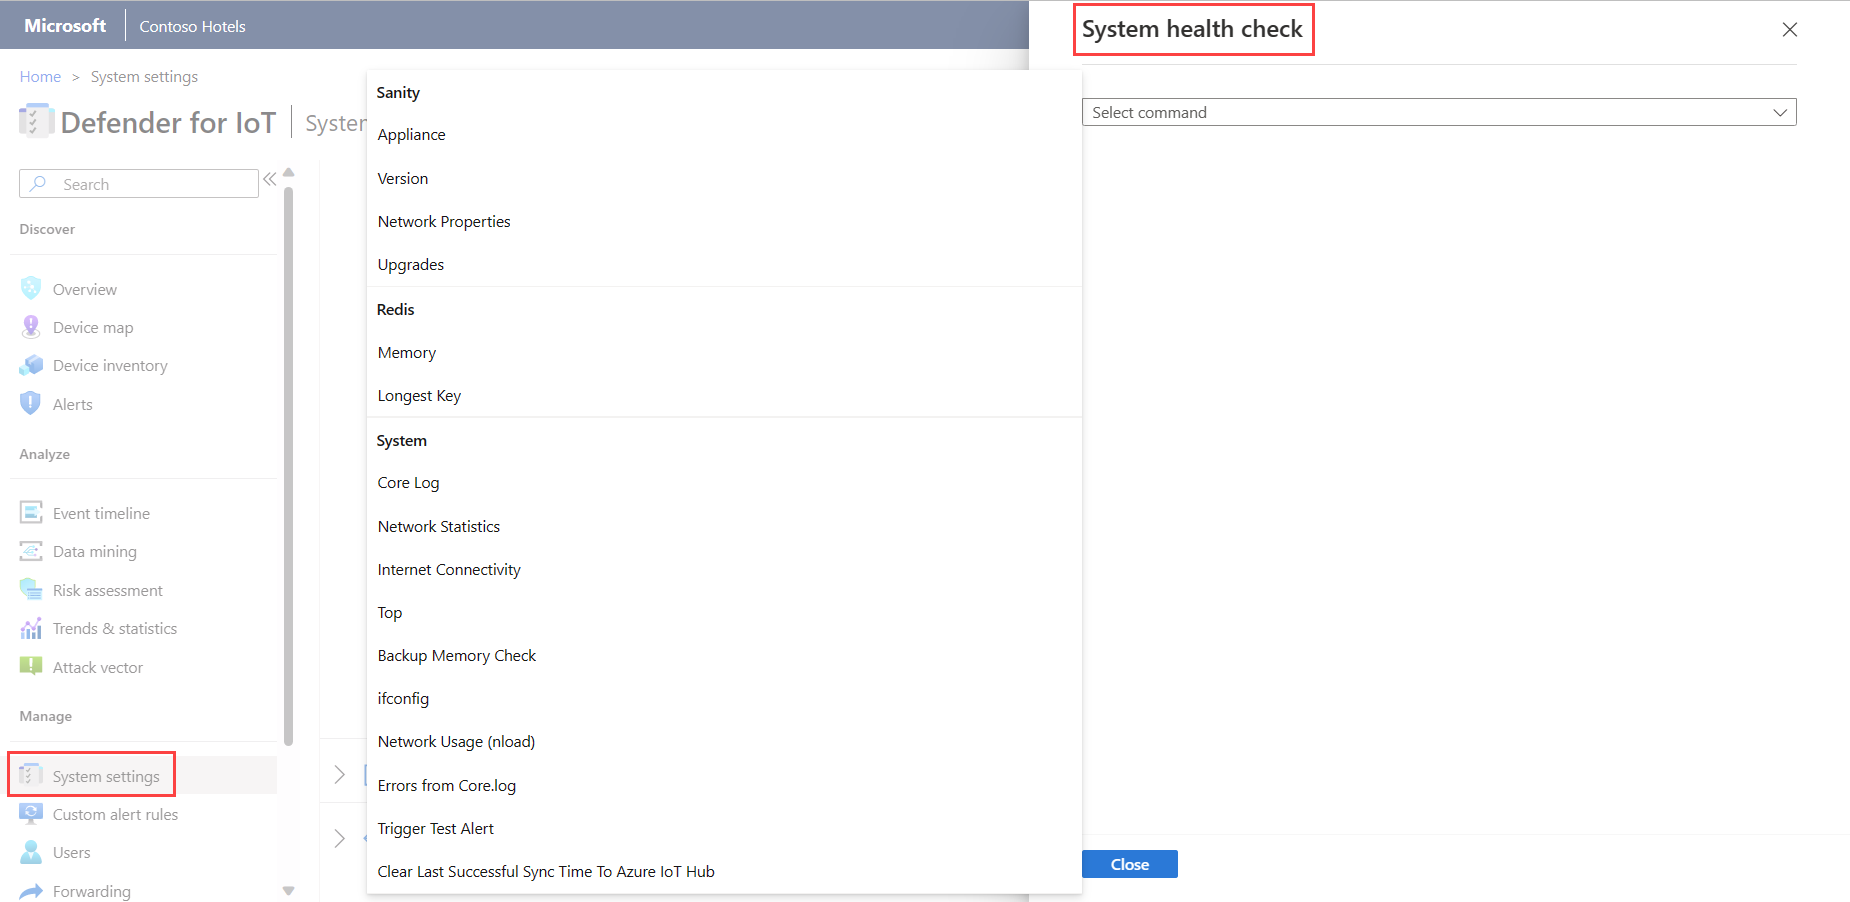
System health checks include the following:
| Name | Description |
|---|---|
| Sanity | |
| - Appliance | Runs the appliance sanity check. You can perform the same check by using the CLI command system-sanity. |
| - Version | Displays the appliance version. |
| - Network Properties | Displays the sensor network parameters. |
| Redis | |
| - Memory | Provides the overall picture of memory usage, such as how much memory was used and how much remained. |
| - Longest Key | Displays the longest keys that might cause extensive memory usage. |
| System | |
| - Core Log | Provides the last 500 rows of the core log, so that you can view the recent log rows without exporting the entire system log. |
| - Task Manager | Translates the tasks that appear in the table of processes to the following layers: - Persistent layer (Redis) - Cache layer (SQL) |
| - Network Statistics | Displays your network statistics. |
| - TOP | Shows the table of processes. It's a Linux command that provides a dynamic real-time view of the running system. |
| - Backup Memory Check | Provides the status of the backup memory, checking the following: - The location of the backup folder - The size of the backup folder - The limitations of the backup folder - When the last backup happened - How much space there is for the extra backup files |
| - ifconfig | Displays the parameters for the appliance's physical interfaces. |
| - CyberX nload | Displays network traffic and bandwidth by using the six-second tests. |
| - Errors from core log | Displays errors from the core log file. |
Check system health by using the CLI
Verify that the system is up and running prior to testing the system's sanity.
For more information, see CLI command reference from OT network sensors.
To test the system's sanity:
Connect to the CLI with the Linux terminal (for example, PuTTY) and the user admin.
Enter
system sanity.Check that all the services are green (running).
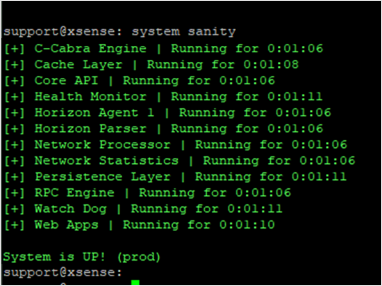
Verify that System is UP! (prod) appears at the bottom.
Verify that the correct version is used:
To check the system's version:
Connect to the CLI with the Linux terminal (for example, PuTTY) and the user admin.
Enter
system version.Check that the correct version appears.
Verify that all the input interfaces configured during the installation process are running:
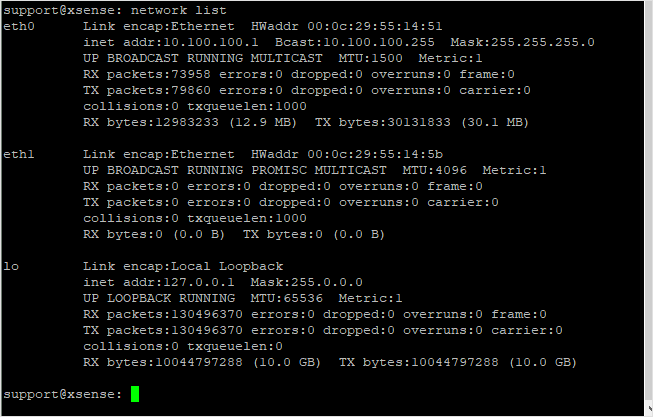
To validate the system's network status:
Connect to the CLI with the Linux terminal (for example, PuTTY) and the admin user.
Enter
network list(the equivalent of the Linux commandifconfig).Validate that the required input interfaces appear. For example, if two quad Copper NICs are installed, there should be 10 interfaces in the list.
Verify that you can access the console web GUI:
To check that management has access to the UI:
Connect a laptop with an Ethernet cable to the management port (Gb1).
Define the laptop NIC address to be in the same range as the appliance.
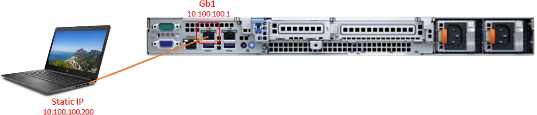
Ping the appliance's IP address from the laptop to verify connectivity (default: 10.100.10.1).
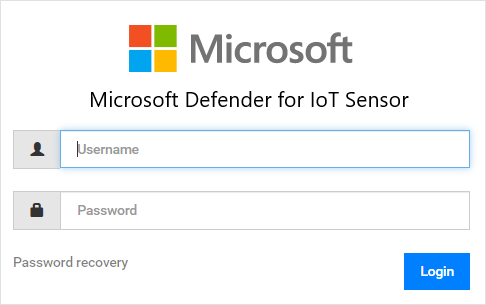
Open the Chrome browser in the laptop and enter the appliance's IP address.
In the Your connection is not private window, select Advanced and proceed.
The test is successful when the Defender for IoT sign-in screen appears.
Download a diagnostics log for support
This procedure describes how to download a diagnostics log to send to support in connection with a specific support ticket.
This feature is supported for the following sensor versions:
- 22.1.1 - Download a diagnostic log from the sensor console.
- 22.1.3 and higher - For locally managed sensors, upload a diagnostics log from the Sites and sensors page in the Azure portal. This file is automatically sent to support when you open a ticket on a cloud-connected sensor.
All files downloaded from the Azure portal are signed by root of trust so that your machines use signed assets only.
To download a diagnostics log:
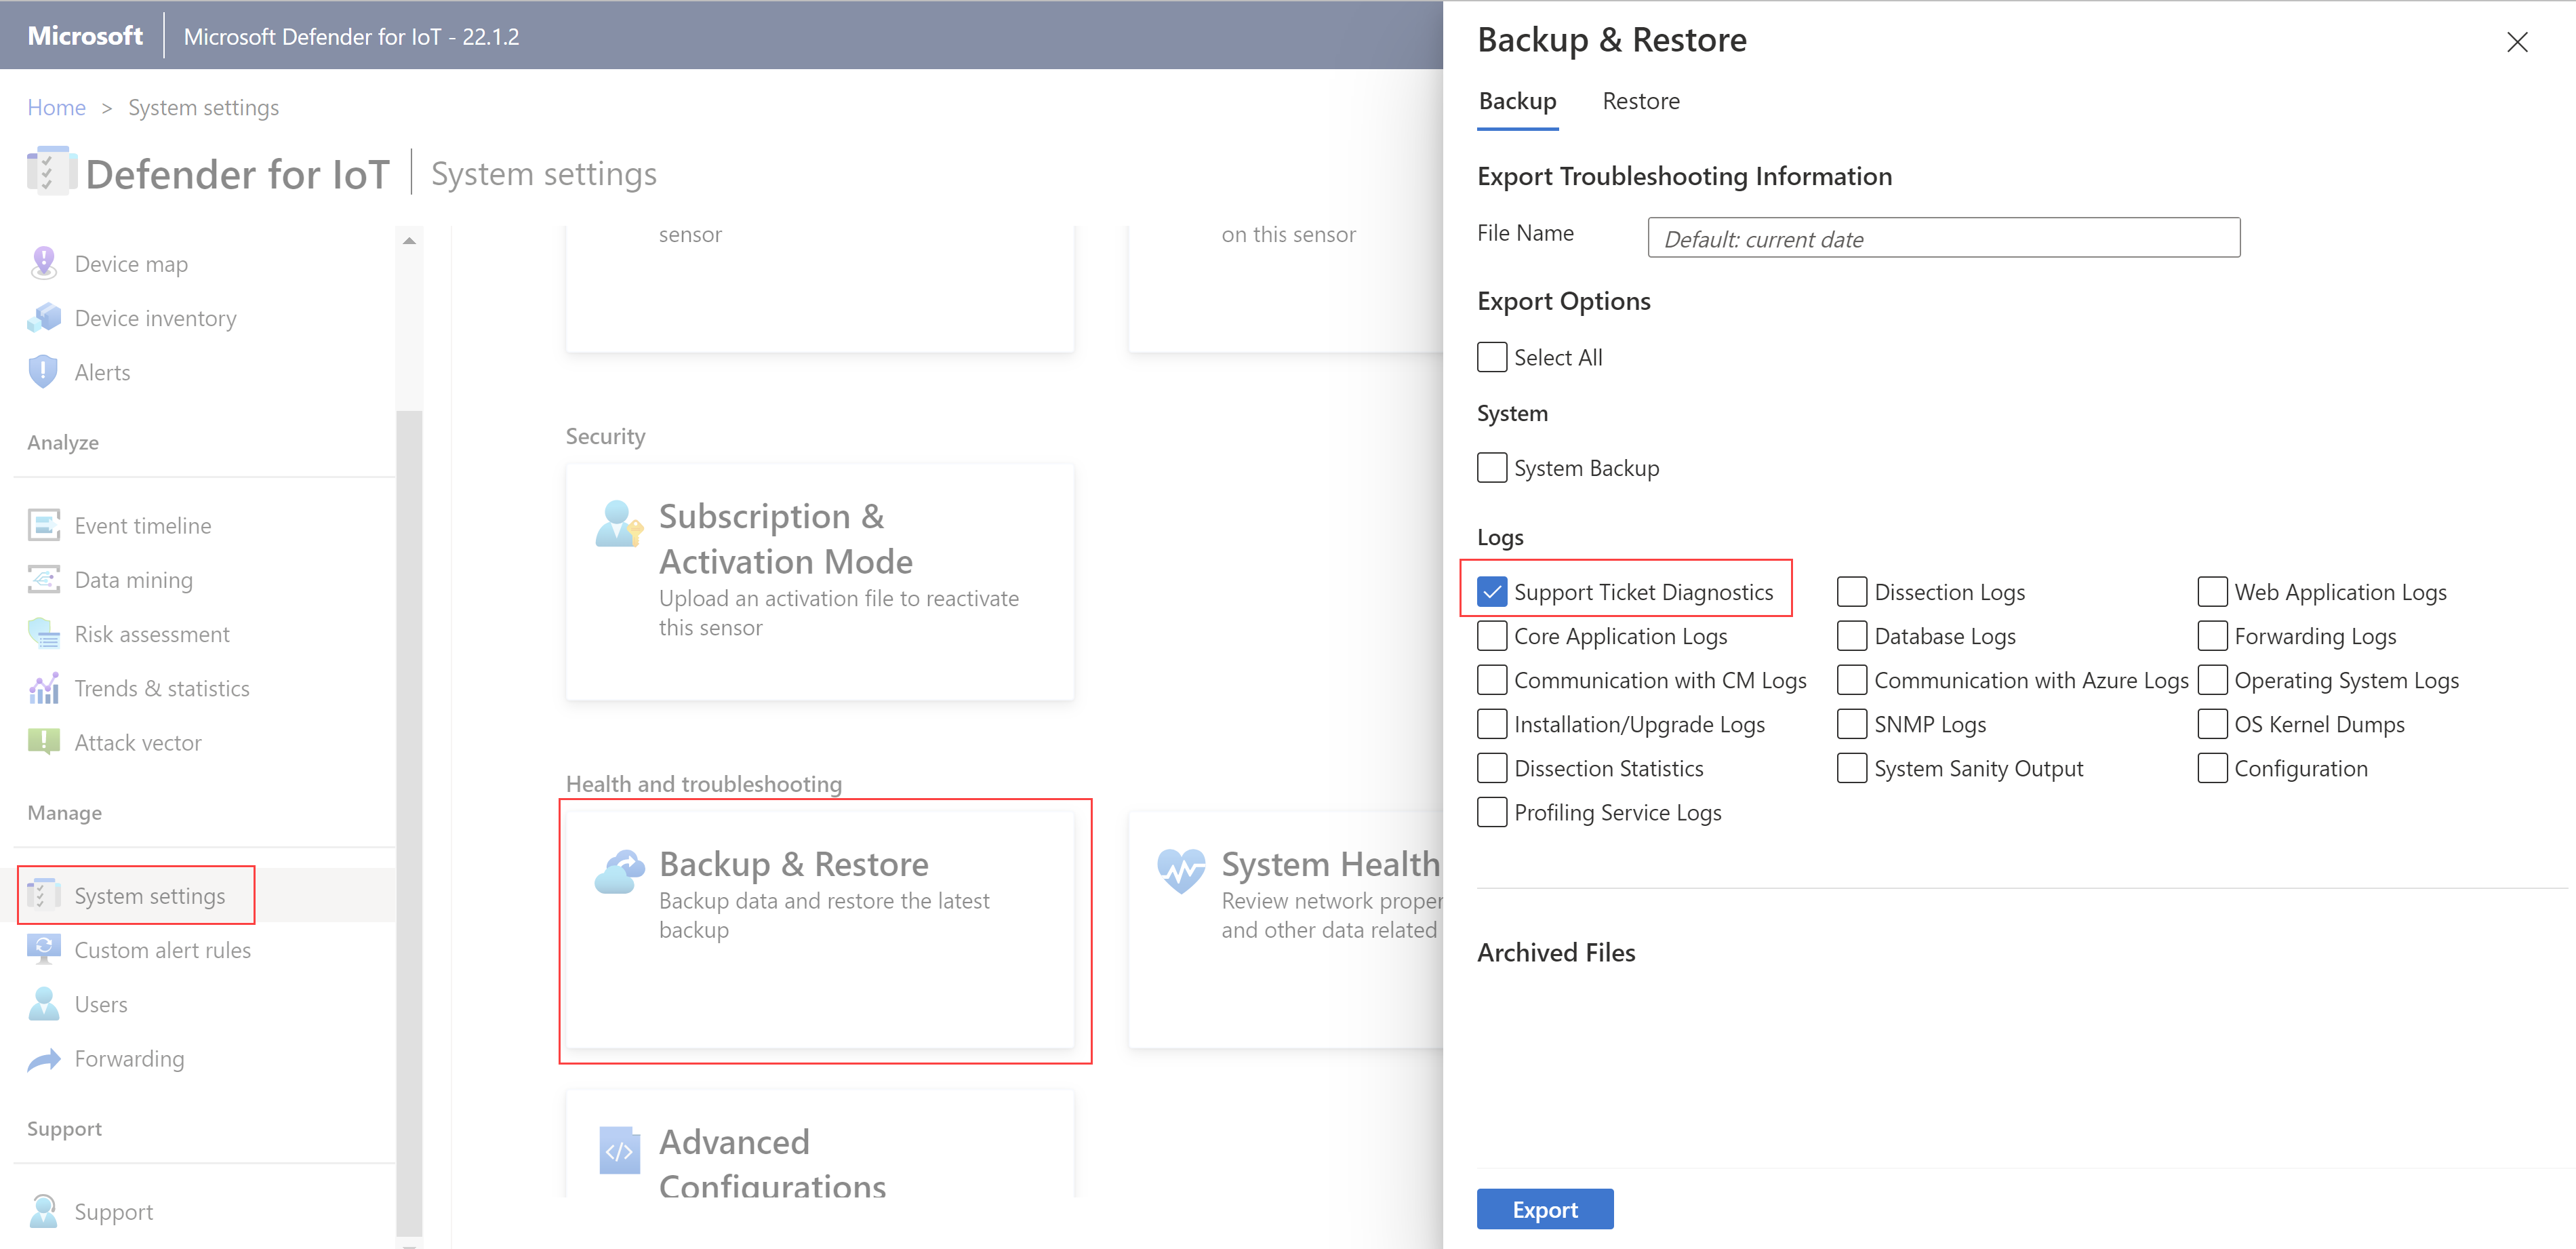
On the sensor console, select System settings > Sensor management > Health and troubleshooting > Backup & restore > Backup.
Under Logs, select Support Ticket Diagnostics, and then select Export.
For a locally managed sensor, version 22.1.3 or higher, continue with Upload a diagnostics log for support.

Retrieve forensics data
The following types of forensic data are stored locally on OT sensors, for devices detected by that sensor:
- Device data
- Alert data
- Alert PCAP files
- Event timeline data
- Log files
Use the OT sensor's data mining reports or Azure Monitor workbooks on an OT network sensor to retrieve forensic data from that sensor’s storage. Each type of data has a different retention period and maximum capacity.
For more information, see Data retention across Microsoft Defender for IoT.
You can't connect by using a web interface
Verify that the computer that you're trying to connect is on the same network as the appliance.
Verify that the GUI network is connected to the management port.
Ping the appliance's IP address. If there's no ping:
Connect a monitor and a keyboard to the appliance.
Use the admin user and password to sign in.
Use the command
network listto see the current IP address.
If the network parameters are misconfigured, use the following procedure to change them:
Use the command
network edit-settings.To change the management network IP address, select Y.
To change the subnet mask, select Y.
To change the DNS, select Y.
To change the default gateway IP address, select Y.
For the input interface change (sensor only), select N.
To apply the settings, select Y.
After restart, connect with the admin user credentials and use the
network listcommand to verify that the parameters were changed.Try to ping and connect from the GUI again.
The appliance isn't responding
Connect a monitor and keyboard to the appliance, or use PuTTY to connect remotely to the CLI.
Use the admin user credentials to sign in.
Use the
system sanitycommand and check that all processes are running. For example: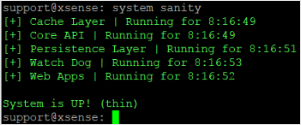
For any other issues, contact Microsoft Support.
Investigate password failure at initial sign-in
When signing into a pre-configured sensor for the first time, you'll need to perform password recovery as follows:
On the Defender for IoT sign in screen, select Password recovery. The Password recovery screen opens.
Select either Admin or CyberX, and copy the unique identifier.
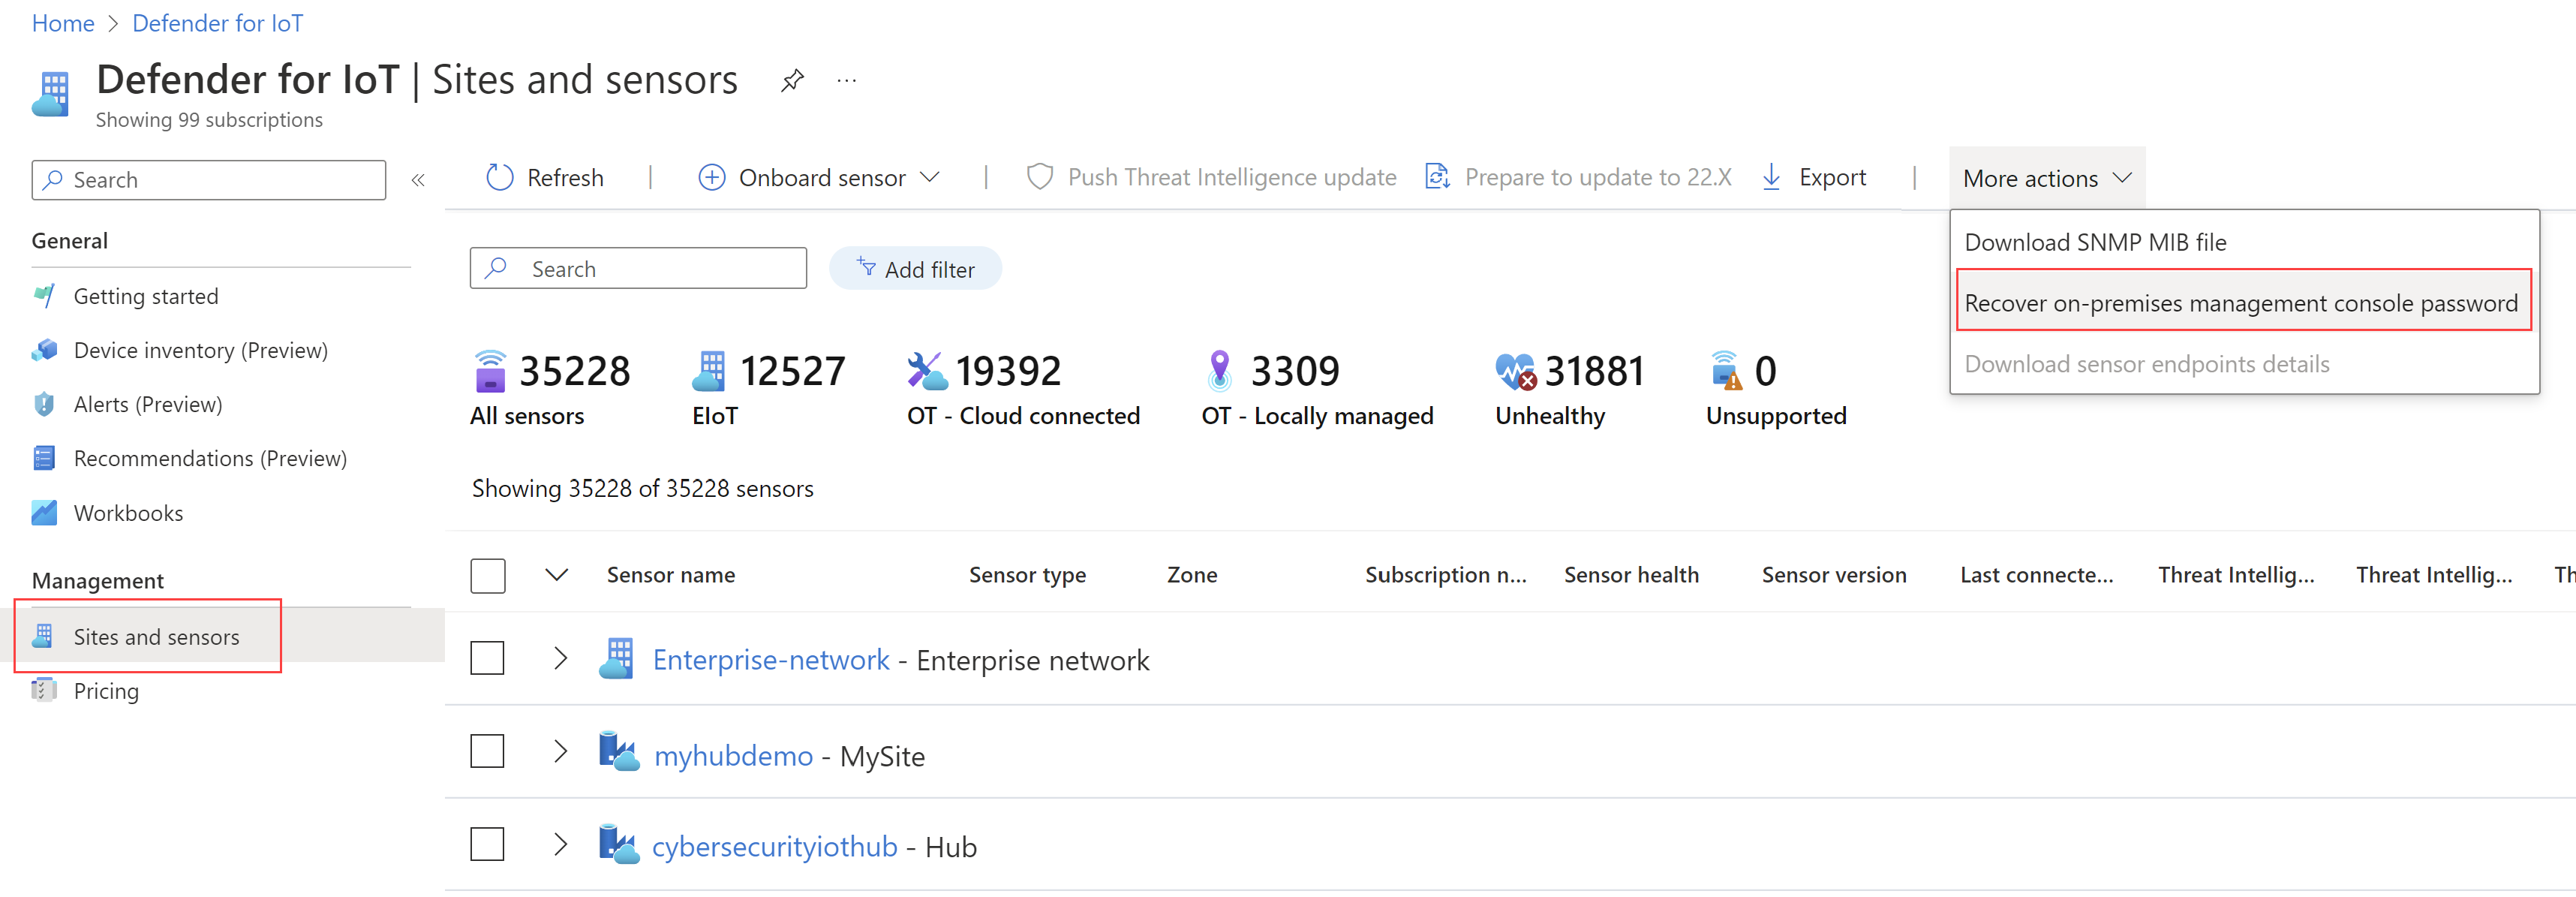
Navigate to the Azure portal and select Sites and sensors.
Select the More Actions drop down menu and select Recover on-premises management console password.
Enter the unique identifier that you received on the Password recovery screen and select Recover. The
password_recovery.zipfile is downloaded. Don't extract or modify the zip file.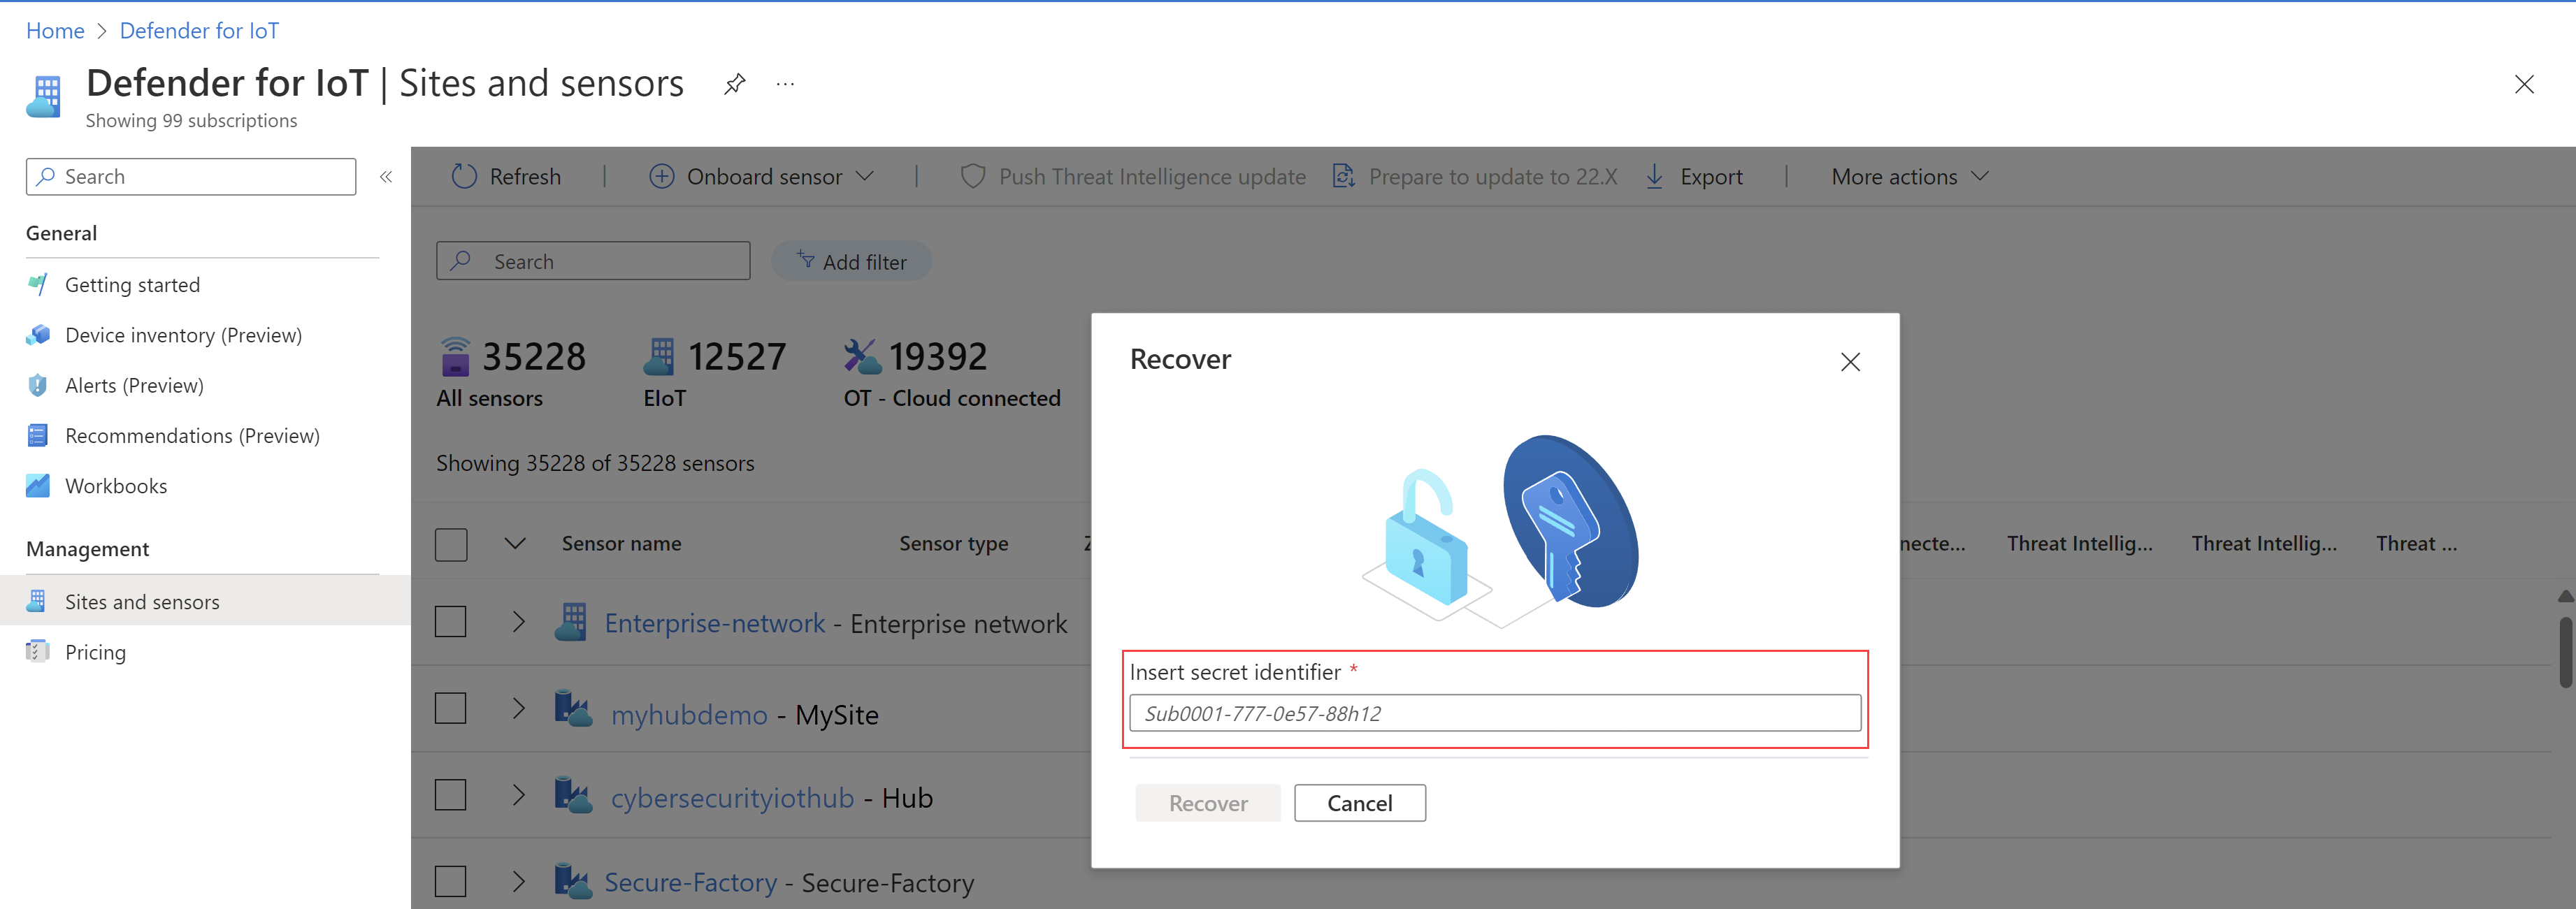
On the Password recovery screen, select Upload. The Upload Password Recovery File window will open.
Select Browse to locate your
password_recovery.zipfile, or drag thepassword_recovery.zipto the window.Select Next, and your user, and a system-generated password for your management console will then appear.
Note
When you sign in to a sensor for the first time, it's linked to your Azure subscription, which you'll need if you need to recover the password for the admin user. For more information, see Recover privileged access to a sensor.
Investigate a lack of traffic
An indicator appears at the top of the console when the sensor recognizes that there's no traffic on one of the configured ports. This indicator is visible to all users. When this message appears, you can investigate where there's no traffic. Make sure the span cable is connected and there was no change in the span architecture.
Check system performance
When a new sensor is deployed or a sensor is working slowly or not showing any alerts, you can check system performance.
- Sign in to the sensor and select Overview. Make sure that PPS is greater than 0, and that Devices are being discovered.
- In the Data Mining page, generate a report.
- In the Trends & Statistics page, create a dashboard.
- In the Alerts page, check that the alert was created.
Investigate a lack of expected alerts
If the Alerts window doesn't show an alert that you expected, verify the following:
- Check if the same alert already appears in the Alerts window as a reaction to a different security instance. If yes, and this alert hasn't been handled yet, the sensor console doesn't show a new alert.
- Make sure you didn't exclude this alert by using the Alert Exclusion rules in the management console.
Investigate dashboard that shows no data
When the dashboards in the Trends & Statistics window show no data, do the following:
- Check system performance.
- Make sure the time and region settings are properly configured and not set to a future time.
Investigate a device map that shows only broadcasting devices
When devices shown on the device map appear not connected to each other, something might be wrong with the SPAN port configuration. That is, you might be seeing only broadcasting devices and no unicast traffic.
- Validate that you're only seeing the broadcast traffic. To do this, in Data Mining, select Create report. In Create new report, specify the report fields. In Choose Category, choose Select all.
- Save the report, and review it to see if only broadcast and multicast traffic (and no unicast traffic) appears. If so, contact your networking team to fix the SPAN port configuration so that you can see the unicast traffic as well. Alternately, you can record a PCAP directly from the switch, or connect a laptop by using Wireshark.
For more information, see:
Connect the sensor to NTP
You can configure a standalone sensor and a management console, with the sensors related to it, to connect to NTP.
Tip
When you're ready to start managing your OT sensor settings at scale, define NTP settings from the Azure portal. Once you apply settings from the Azure portal, settings on the sensor console are read-only. For more information, see Configure OT sensor settings from the Azure portal (Public preview).
To connect a standalone sensor to NTP:
To connect a sensor controlled by the management console to NTP:
- The connection to NTP is configured on the management console. All the sensors that the management console controls get the NTP connection automatically.
Investigate when devices aren't shown on the map, or you have multiple internet-related alerts
Sometimes ICS devices are configured with external IP addresses. These ICS devices aren't shown on the map. Instead of the devices, an internet cloud appears on the map. The IP addresses of these devices are included in the cloud image. Another indication of the same problem is when multiple internet-related alerts appear. Fix the issue as follows:
- Right-click the cloud icon on the device map and select Export IP Addresses.
- Copy the public ranges that are private, and add them to the subnet list. For more information, see Fine tune your subnet list.
- Generate a new data-mining report for internet connections.
- In the data-mining report, enter the administrator mode and delete the IP addresses of your ICS devices.
Clearing sensor data
In cases where the sensor needs to be relocated or erased, all learned data can be cleared from the sensor.
For more information on how to clear system data, see Clear OT sensor data.
Export logs from the sensor console for troubleshooting
For further troubleshooting, you may want to export logs to send to the support team, such as database or operating system logs.
To export log data:
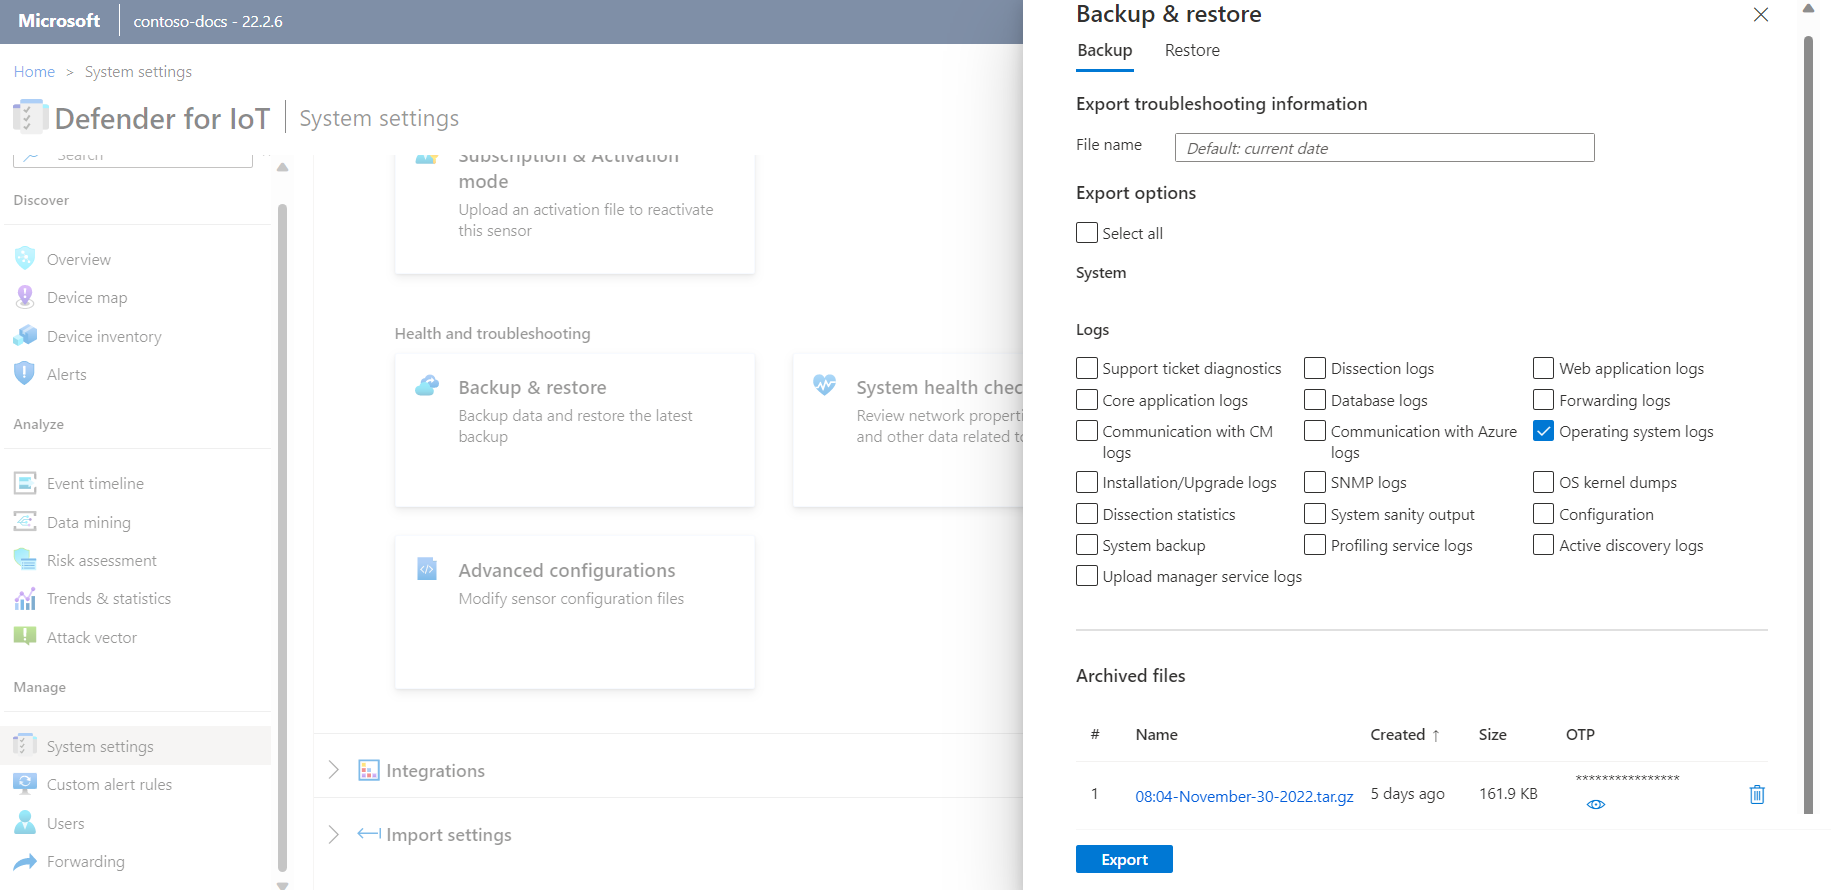
In the sensor console, go to System settings > Sensor management > Backup & restore > Backup.
In the Export Troubleshooting Information dialog:
In the File Name field, enter a meaningful name for the exported log. The default filename uses the current date, such as 13:10-June-14-2022.tar.gz.
Select the logs you would like to export.
Select Export.
The file is exported and is linked from the Archived Files list at the bottom of the Export Troubleshooting Information dialog.
For example:
Select the file link to download the exported log, and also select the
 button to view its one-time password.
To open the exported logs, forward the downloaded file and the one-time password to the support team. Exported logs can be opened only together with the Microsoft support team.
To keep your logs secure, make sure to forward the password separately from the downloaded log.

Note
Support ticket diagnostics can be downloaded from the sensor console and then uploaded directly to the support team in the Azure portal. For more information on downloading diagnostic logs, see Download a diagnostics log for support.
Next steps
Feedback
Coming soon: Throughout 2024 we will be phasing out GitHub Issues as the feedback mechanism for content and replacing it with a new feedback system. For more information see: https://aka.ms/ContentUserFeedback.
Submit and view feedback for