Tutorial: Monitor network communication between two virtual machines using the Azure portal
Successful communication between a virtual machine (VM) and an endpoint such as another VM, can be critical for your organization. Sometimes, configuration changes break communication.
In this tutorial, you learn how to:
- Create a virtual network
- Create two virtual machines
- Monitor communication between the two virtual machines
- Diagnose a communication problem between the two virtual machines
If you don't have an Azure subscription, create a free account before you begin.
Prerequisites
- An Azure account with an active subscription.
Create a virtual network
In this section, you create myVNet virtual network with two subnets and an Azure Bastion host. The first subnet is used for the virtual machine, and the second subnet is used for the Bastion host.
Sign in to the Azure portal.
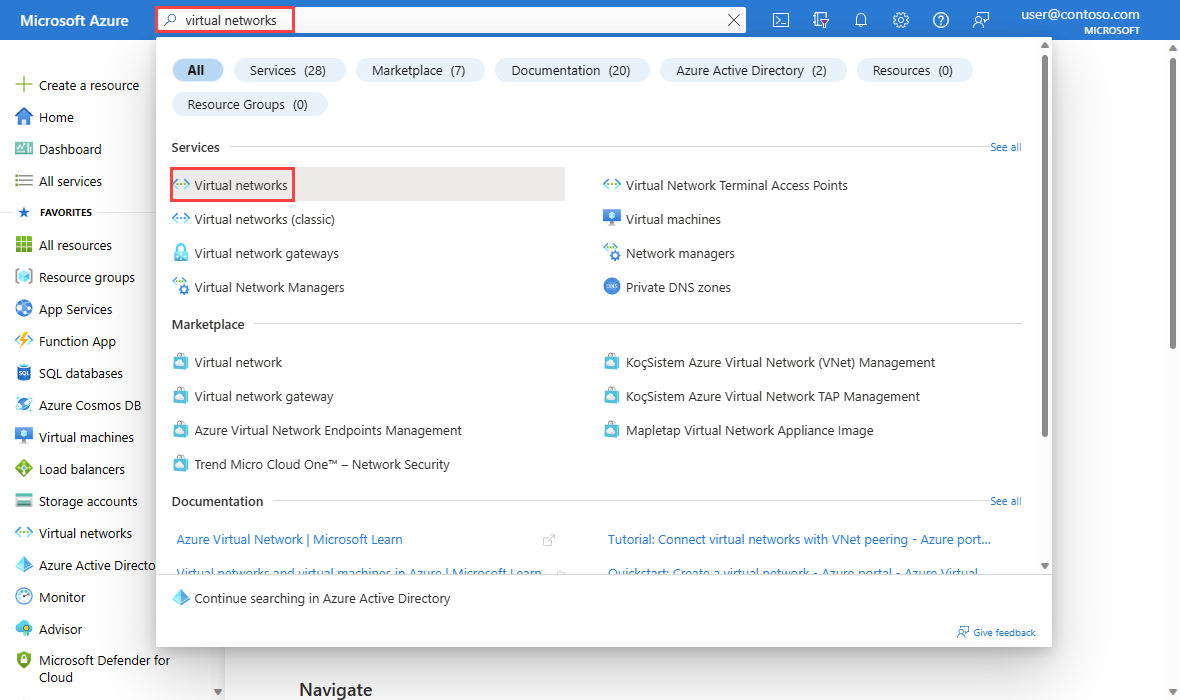
In the search box at the top of the portal, enter virtual networks. Select Virtual networks from the search results.
Select + Create. In Create virtual network, enter or select the following values in the Basics tab:
Setting Value Project details Subscription Select your Azure subscription. Resource Group Select Create new. Enter myResourceGroup in Name. Select OK. Instance details Virtual network name Enter myVNet. Region Select (US) East US. Select the IP Addresses tab, or select the Next button at the bottom of the page twice.
Accept the default IP address space 10.0.0.0/16.
Select the pencil icon next to default subnet to rename it. Under Subnet details in the Edit subnet page, enter mySubnet for the Name and then select Save.
Select Review + create.
Review the settings, and then select Create.
Create two virtual machines
In this section, you create two virtual machines: myVM1 and myVM2 to test the connection between them.
Create the first virtual machine
In the search box at the top of the portal, enter virtual machine. Select Virtual machines in the search results.
In Virtual machines, select + Create then + Azure virtual machine.
Enter or select the following information in the Basics tab of Create a virtual machine.
Setting Value Project details Subscription Select your subscription. Resource group Select myResourceGroup. Instance details Virtual machine name Enter myVM1. Region Select (US) East US. Availability options Select No infrastructure redundancy required. Security type Leave the default of Standard. Image Select Ubuntu Server 20.04 LTS - x64 Gen2. Size Choose a size or leave the default setting. Administrator account Authentication type Select Password. Username Enter a username. Password Enter a password. Confirm password Reenter password. Select the Networking tab, or select Next: Disks, then Next: Networking.
In the Networking tab, select the following values:
Setting Value Network interface Virtual network Select myVNet. Subnet Select mySubnet. Public IP Select None. NIC network security group Select None. Select Review + create.
Review the settings, and then select Create.
Create the second virtual machine
Repeat the steps in the previous section to create the second virtual machine and enter myVM2 for the virtual machine name.
Create a connection monitor
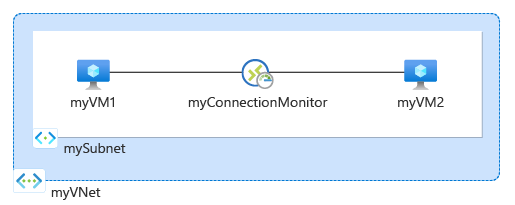
In this section, you create a connection monitor to monitor communication over TCP port 3389 from myVm1 to myVm2.
In the search box at the top of the portal, enter network watcher. Select Network Watcher.
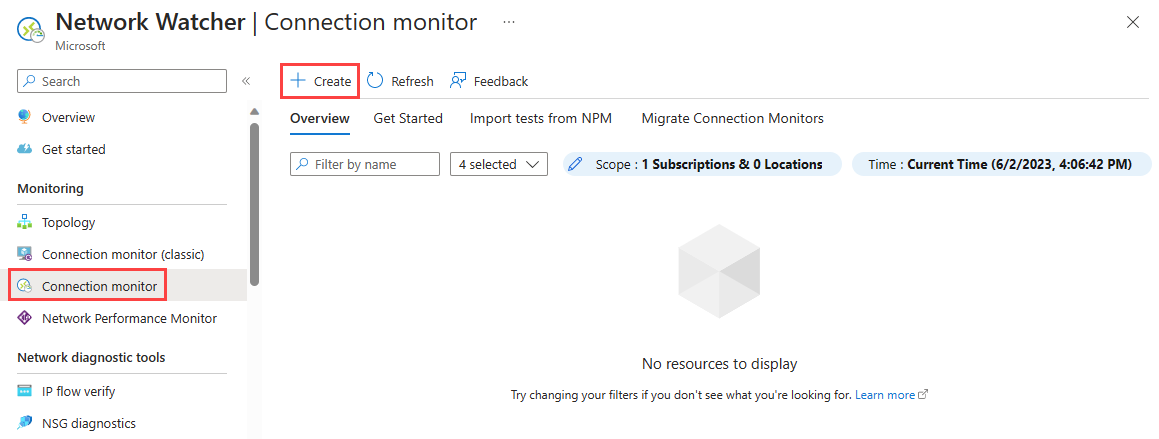
Under Monitoring, select Connection monitor.
Select + Create.
Enter or select the following information in the Basics tab of Create Connection Monitor:
Setting Value Connection Monitor Name Enter myConnectionMonitor. Subscription Select your subscription. Region Select East US. Workspace configuration Virtual machine name Enter myVM1. Region Select (US) East US. Workspace configuration Leave the default. 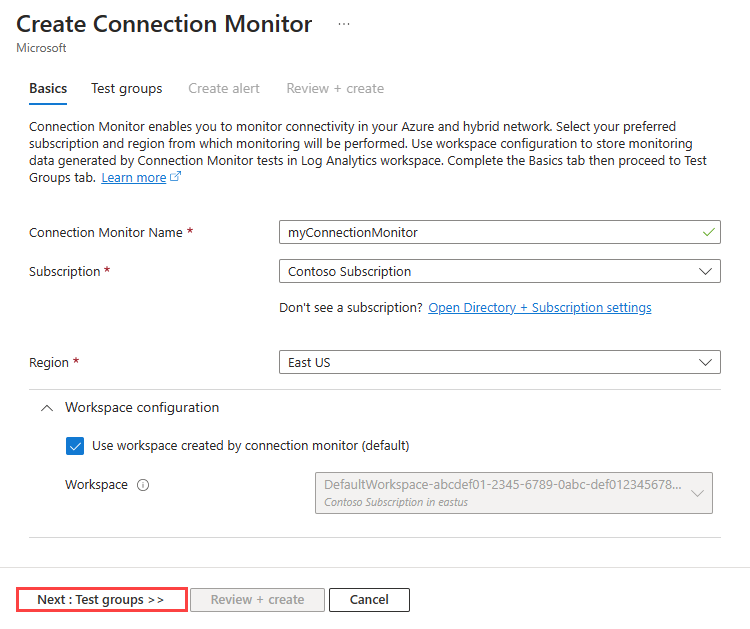
Select the Test groups tab, or select Next: Test groups button.
Enter myTestGroup in Test group name.
In the Add test group details page, select + Add sources to add the source virtual machine.
In the Add sources page, select myVM1 as the source endpoint, and then select Add endpoints.
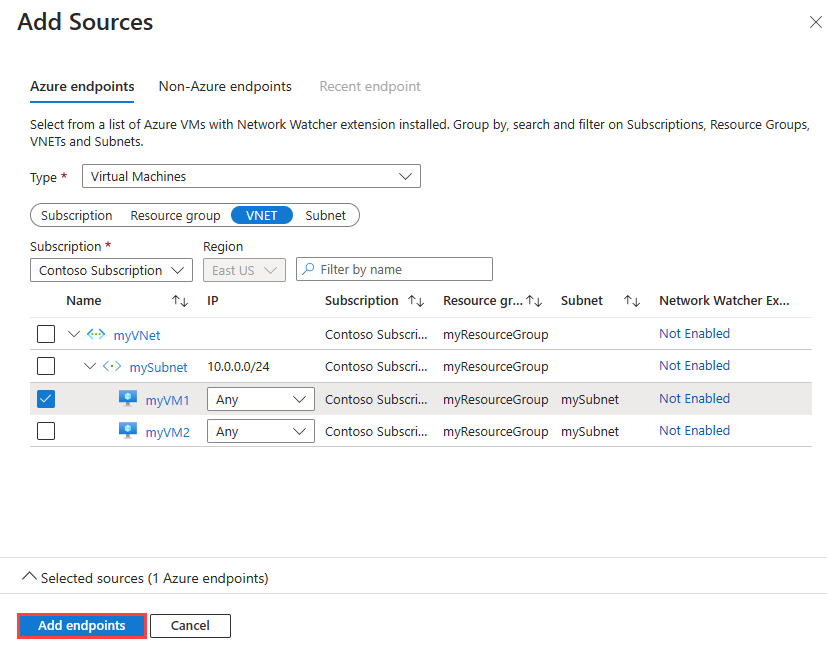
Note
You can use Subscription, Resource group, VNET, or Subnet filters to narrow down the list of virtual machines.
In the Add test group details page, select Add Test configuration, and then enter or select the following information:
Setting Value Test configuration name Enter SSH-from-myVM1-to-myVM2. Protocol Select TCP. Destination port Enter 22. Test frequency Select the default Every 30 seconds. 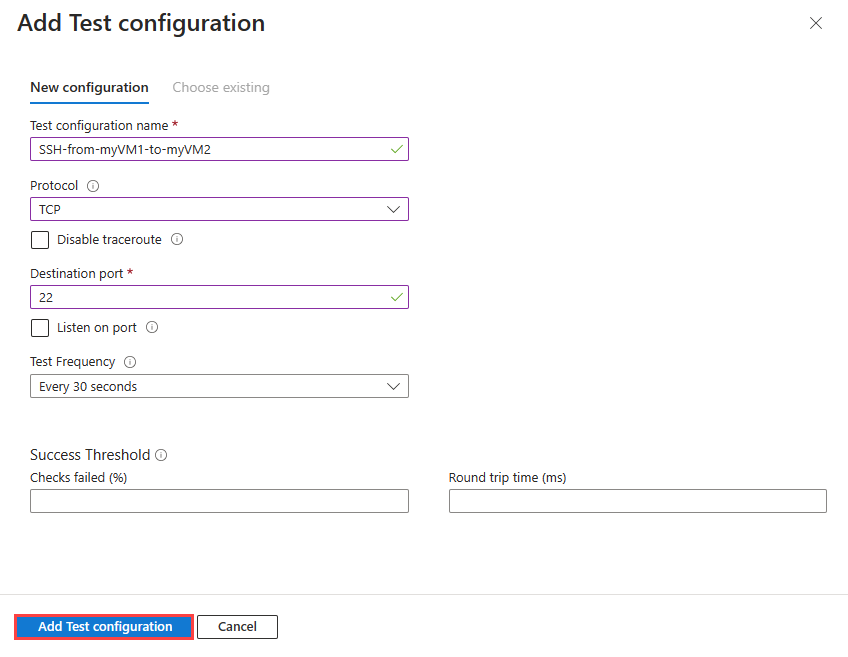
Select Add test configuration.
In the Add test group details page, select Add destinations to add the destination virtual machine.
In the Add Destinations page, select myVM2 as the destination endpoint, and then select Add endpoints.
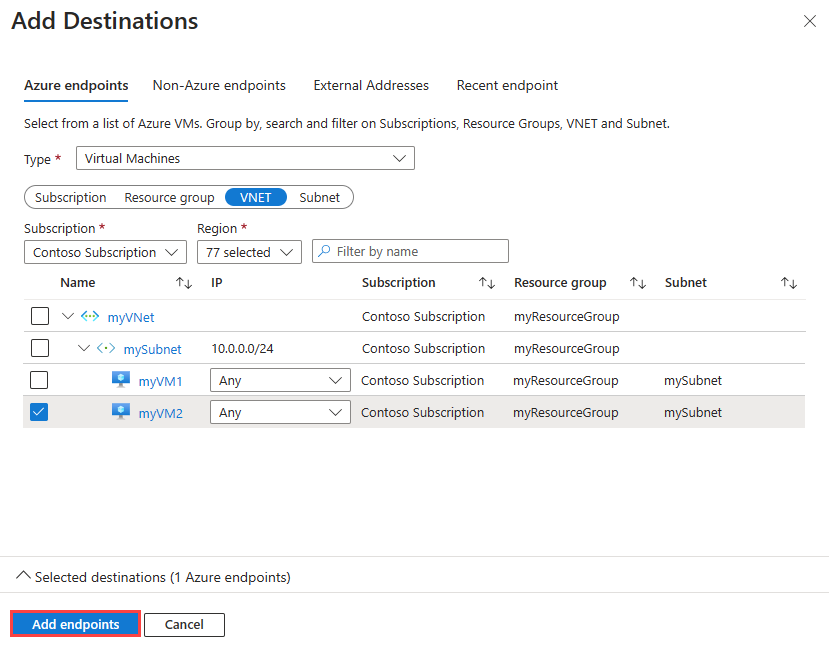
Note
In addition to the Subscription, Resource group, VNET, and Subnet filters, you can use the Region filter to narrow down the list of virtual machines.
In the Add test group details page, select Add Test Group button.
Select Review + create, and then select Create.
View the connection monitor
In this section, you view all the details of the connection monitor that you created in the previous section.
Go to the Connection monitor page. If you don't see myConnectionMonitor in the list of connection monitors, wait a few minutes, then select Refresh.
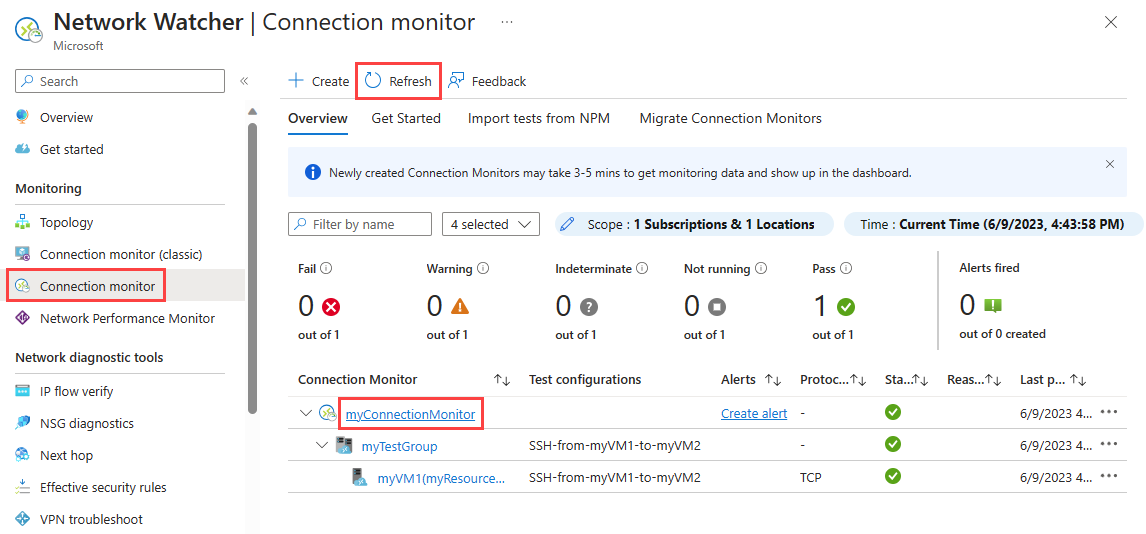
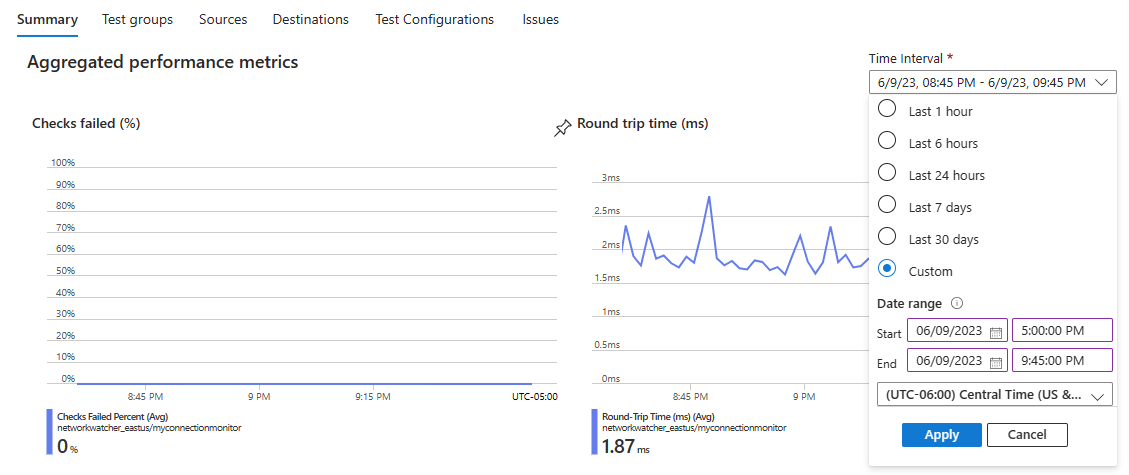
Select myConnectionMonitor to see the performance metrics of the connection monitor like round trip time and percentage of failed checks

Select Time Intervals to adjust the time range to see the performance metrics for a specific time period. Available time intervals are Last 1 hour, Last 6 hours, Last 24 hours, Last 7 days, and Last 30 days. You can also select Custom to specify a custom time range.


View a problem
The connection monitor you created in the previous section monitors the connection between myVM1 and port 22 on myVM2. If the connection fails for any reason, connection monitor detects and logs the failure. In this section, you simulate a problem by stopping myVM2.
In the search box at the top of the portal, enter virtual machine. Select Virtual machines in the search results.
In Virtual machines, select myVM2.
In the Overview, select Stop to stop (deallocate) myVM2 virtual machine.
Go to the Connection monitor page. If you don't see the failure in the dashboard, select Refresh.

You can see that the number of Fail connection monitors became 1 out of 1 after stopping myVM2, and under Reason, you can see ChecksFailedPercent as the reason for this failure.

Clean up resources
When no longer needed, delete myResourceGroup resource group and all of the resources it contains:
In the search box at the top of the portal, enter myResourceGroup. Select myResourceGroup from the search results.
Select Delete resource group.
In Delete a resource group, enter myResourceGroup, and then select Delete.
Select Delete to confirm the deletion of the resource group and all its resources.
Next step
To learn how to monitor virtual machine scale set network communication, advance to the next tutorial:
Feedback
Coming soon: Throughout 2024 we will be phasing out GitHub Issues as the feedback mechanism for content and replacing it with a new feedback system. For more information see: https://aka.ms/ContentUserFeedback.
Submit and view feedback for