Work with charts on the report
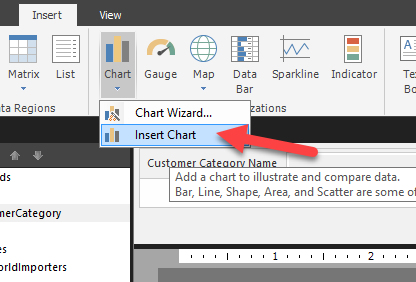
Two ways to add a chart to your report are: Select the Chart button, select Insert Chart, and then draw your table on the canvas.
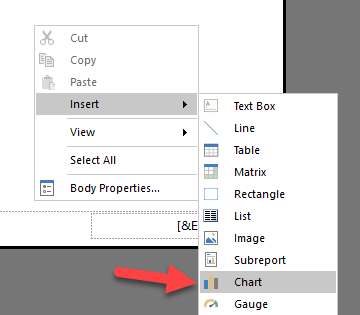
Right-click the report canvas, select Insert, and then select Chart.
Next, choose the type and style of your chart.
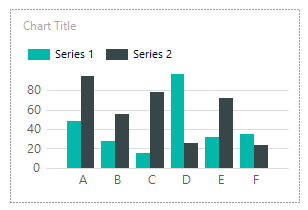
After you have selected a chart type, the chart will be added to the design surface.
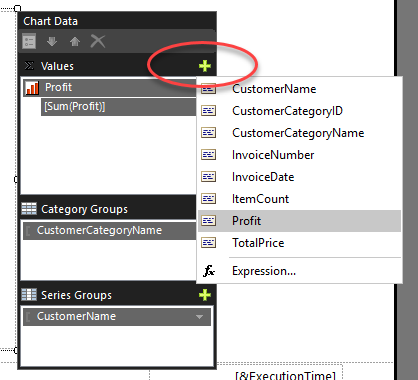
When you select the chart, a new window appears to the right. The Chart Data screen allows you to format the chart according to the values and axis properties.
Select the plus (+) sign beside each section to select the required columns.
For more information on working with charts, you can search Microsoft documentation regarding SSRS reports. All of the material in the SSRS documentation will apply to Power BI paginated reports.


