Basic concepts
When will Metrics Advisor be deprecated?
Starting on the 20th of September, 2023 you won’t be able to create new Metrics Advisor resources. The Metrics Advisor service is being retired on the 1st of October, 2026.
What is multi-dimensional time-series data?
See the Multi-dimensional metric definition in the glossary.
How much data is needed for Metrics Advisor to start anomaly detection?
At minimum, one data point can trigger anomaly detection. This doesn't bring the best accuracy, however. The service will assume a window of previous data points using the value you've specified as the "fill-gap" rule during data feed creation.
We recommend having some data before the timestamp that you want detection on. Based on the granularity of your data, the recommended data amount varies as below.
| Granularity | Recommended data amount for detection |
|---|---|
| Less than 5 minutes | 4 days of data |
| 5 minutes to 1 day | 28 days of data |
| More than 1 day, to 31 days | 4 years of data |
| Greater than 31 days | 48 years of data |
What data does Metrics Advisor process and how is data retained?
- Metrics Advisor processes time series data that is collected from a customer's data source, historical data is used for model selection and determines the expected data boundary.
- Customer's time series data and inference results will be stored within the service. Metrics Advisor doesn't store or process customer data outside the region where the customer deploys the service instance.
Why Metrics Advisor doesn't detect anomalies from historical data?
Metrics Advisor is designed for detecting live streaming data. There's a limitation of the maximum length of historical data that the service will look back and run anomaly detection. It means only data points after a certain earliest timestamp will have anomaly detection results. That earliest timestamp depends on the granularity of your data.
Based on the granularity of your data, the lengths of the historical data that will have anomaly detection results are as below.
| Granularity | Maximum length of historical data for anomaly detection |
|---|---|
| Less than 5 minutes | Onboard time - 13 hours |
| 5 minutes to less than 1 hour | Onboard time - 4 days |
| 1 hour to less than 1 day | Onboard time - 14 days |
| 1 day | Onboard time - 28 days |
| Greater than 1 day, less than 31 days | Onboard time - 2 years |
| Greater than 31 days | Onboard time - 24 years |
What are the data retention and limitations of Metrics Advisor?
- Data retention. Metrics Advisor will keep at most 10,000 time intervals what is an interval? forward counting from current timestamp, no matter there's data available or not. Data falls out of the window will be deleted. Data retention mapping to count of days for different metric granularity.
| Granularity(min) | Retention(day) |
|---|---|
| 1 | 6.94 |
| 5 | 34.72 |
| 15 | 104.1 |
| 60(=hourly) | 416.67 |
| 1440(=daily) | 10000.00 |
- Limitation on maximum time series count within one metric.
They may have multiple dimensions within one metric, and each dimension may have multiple values. The maximum dimension combination for one metric shouldn't exceed 100k.
- Metrics Advisor resource admins and data feed owners will be notified when the 80% limitation is reached on the data feed detail page.
- If the metric has exceeded the limitation the data feed will be paused, and wait for customers to take follow-up actions. It's suggested to split the data feed to multiple data feeds by using filtering.
- Limitation on maximum data points stored in one Metrics Advisor instance
Metrics Advisor counts on total data points from all data feeds that onboarded to the instance starting from the first ingestion timestamp. The maximum number of data points to be stored in one Metrics Advisor instance is 2 billion.
- Metrics Advisor resource admins and all users will be notified when the 80% limitation is reached on the data feed list page and via the add new data feed page.
- If total data points have exceeded the limitation all data feeds will be paused, and new feed onboarding will be blocked as well. It's suggested to delete unused data feeds or create a new Metrics Advisor resource within your subscription.
Why can't I sign in to Metrics Advisor? The error message says 'The resource is decommissioned due to inactive in 90 days'
There are two cases where a resource is decommissioned:
- A Metrics Advisor resource is created, but no data feed has been onboarded within 90 days. The resource will be decommissioned after 90 days due to inactivity.
- If one or multiple data feeds have been created but there isn't any new data being ingested into Metrics Advisor, the service will enter idle mode with no data to be processed. The system will still try to grab data regularly from the source according to the metrics granularity. However, if it continues to have no data available or no single time series to be processed for a period of 90 consecutive days, the resource will be decommissioned. All historical data associated with the resource will be lost when it's decommissioned.
It's recommended to create a new resource and delete the old one, if you would like to restart the usage.
How do I detect spikes & dips as anomalies?
If you have hard thresholds predefined, you could manually set "hard threshold" in anomaly detection configurations. If there's no thresholds, you could use "smart detection", which is powered by AI. Please refer to tune the detection configuration for details.
How do I detect inconformity with regular (seasonal) patterns as anomalies?
"Smart detection" is able to learn the pattern of your data including seasonal patterns. It then detects those data points that don't conform to the regular patterns as anomalies. Please refer to tune the detection configuration for details.
Does Metrics Advisor support datasources that are behind a VNET?
No, Metrics Advisor doesn't currently support datasources that are behind a VNET.
How do I detect flat lines as anomalies?
If your data is normally quite unstable and fluctuates a lot, and you want to be alerted when it turns too stable or even becomes a flat line, "Change threshold" is able to be configured to detect such data points when the change is too tiny. Please refer to anomaly detection configurations for details.
How to set up email settings and enable alerting by email?
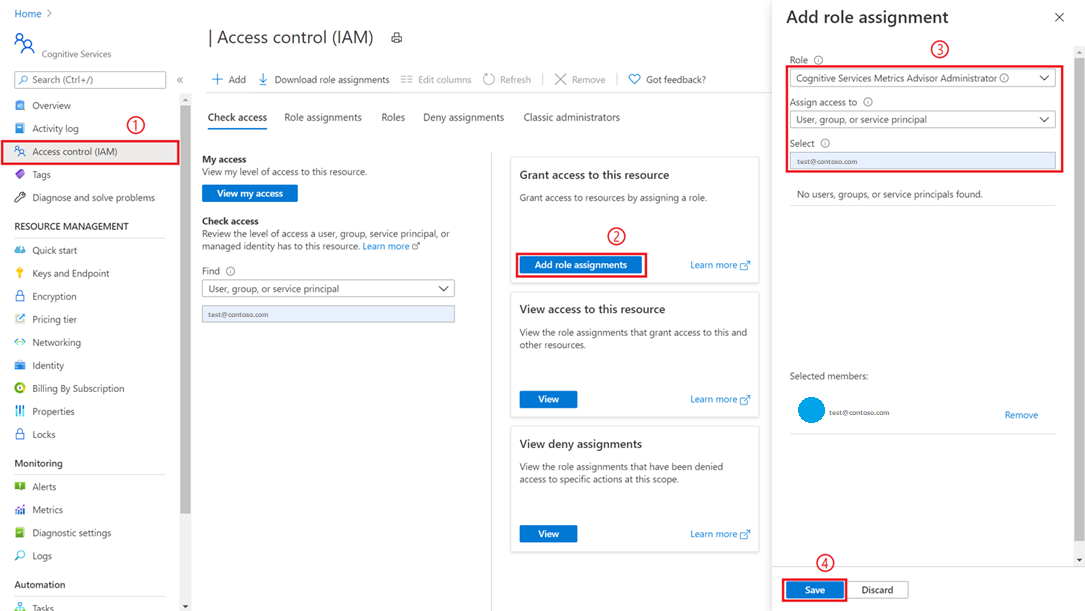
A user with subscription administrator or resource group administrator privileges needs to navigate to the Metrics Advisor resource that created in the Azure portal, and select the Access control(IAM) tab.
Select Add role assignments
Pick a role of Cognitive Services Metrics Advisor Administrator, select your account as in the image below.
Select the Save button, and you're added as an administrator of the Metrics Advisor resource. All the above actions need to be performed by subscription administrator or resource group administrator.
It might take up to one minute for the permissions to propagate. Then, select your Metrics Advisor workspace, and select the Email setting option in the left navigation panel. Fill in the required items, in particular the SMTP-related info.
Select Save, then you're all set with the e-mail configuration. You can create new hooks and subscribe to metric anomalies for near real-time alerts.

Advanced concepts
How does Metric Advisor build a diagnostic tree for multi-dimensional metrics?
A metric can be split into multiple time series by dimensions. For example, the metric Response latency is monitored for all services owned by the team. The Service category could be used as a dimension to enrich the metric, so we get Response latency split by Service1, Service2, and so on. Each service could be deployed on different machines in multiple data centers, so the metric could be further split by Machine and Data center.
| Service | Data center | Machine |
|---|---|---|
| S1 | DC1 | M1 |
| S1 | DC1 | M2 |
| S1 | DC2 | M3 |
| S1 | DC2 | M4 |
| S2 | DC1 | M1 |
| S2 | DC1 | M2 |
| S2 | DC2 | M5 |
| S2 | DC2 | M6 |
| ... |
Starting from the total Response latency, we can drill down into the metric by Service, Data center and Machine. However, maybe it makes more sense for service owners to use the path Service -> Data center -> Machine, or maybe it makes more sense for infrastructure engineers to use the path Data Center -> Machine -> Service. It all depends on the individual business requirements of your users.
In Metric Advisor, users can specify any path they want to drill down or roll up from one node of the hierarchical topology. More precisely, the hierarchical topology is a directed acyclic graph rather than a tree structure. There's a full hierarchical topology that consists of all potential dimension combinations, like this:

In theory, if the dimension Service has Ls distinct values, dimension Data center has Ldc distinct values, and dimension Machine has Lm distinct values, then there could be (Ls + 1) * (Ldc + 1) * (Lm + 1) dimension combinations in the hierarchical topology.
But usually not all dimension combinations are valid, which can significantly reduce the complexity. Currently if users aggregate the metric themselves, we don't limit the number of dimensions. If you need to use the rollup functionality provided by Metrics Advisor, the number of dimensions shouldn't be more than 6. However, we limit the number of time series expanded by dimensions for a metric to less than 10,000.
The Diagnostic tree tool in the diagnostics page only shows nodes where an anomaly has been detected, rather than the whole topology. This is to help you focus on the current issue. It also may not show all anomalies within the metric, and instead will display the top anomalies based on contribution. In this way, we can quickly find out the impact, scope, and the spread path of the abnormal data. Which significantly reduces the number of anomalies we need to focus on, and helps users to understand and locate their key issues.
For example, when an anomaly occurs on Service = S2 | Data Center = DC2 | Machine = M5, the deviation of the anomaly impacts the parent node Service= S2, which also has detected the anomaly, but the anomaly doesn't affect the entire data center at DC2 and all services on M5. The incident tree would be built as in the below screenshot, the top anomaly is captured on Service = S2, and root cause could be analyzed in two paths which both lead to Service = S2 | Data Center = DC2 | Machine = M5.
