Tutorial: Write a valid query to onboard metrics data
Important
Starting on the 20th of September, 2023 you won’t be able to create new Metrics Advisor resources. The Metrics Advisor service is being retired on the 1st of October, 2026.
In this tutorial, you learn how to:
- How to write a valid data onboarding query
- Common errors and how to avoid them
Prerequisites
Create a Metrics Advisor resource
To explore capabilities of Metrics Advisor, you may need to create a Metrics Advisor resource in the Azure portal to deploy your Metrics Advisor instance.
Data schema requirements
Azure AI Metrics Advisor is a service for time series anomaly detection, diagnostics, and analysis. As an AI-powered service, it uses your data to train the model used. The service accepts tables of aggregated data with the following columns:
- Measure (required): A measure is a fundamental or unit-specific term and a quantifiable value of the metric. It means one or more columns containing numeric values.
- Timestamp (optional): Zero or one column, with type of
DateTimeorString. When this column isn't set, the timestamp is set as the start time of each ingestion period. Format the timestamp as follows:yyyy-MM-ddTHH:mm:ssZ. - Dimension (optional): A dimension is one or more categorical values. The combination of those values identifies a particular univariate time series (for example, country/region, language, and tenant). The dimension columns can be of any data type. Be cautious when working with large volumes of columns and values, to prevent excessive numbers of dimensions from being processed.
If you're using data sources such as Azure Data Lake Storage or Azure Blob Storage, you can aggregate your data to align with your expected metrics schema. This is because these data sources use a file as metrics input.
If you're using data sources such as Azure SQL or Azure Data Explorer, you can use aggregation functions to aggregate data into your expected schema. This is because these data sources support running a query to get metrics data from sources.
How does data ingestion work in Metrics Advisor?
When onboarding your metrics to Metrics Advisor, generally there are two ways:
- Pre-aggregate your metrics into the expected schema and store data into certain files. Fill in the path template during onboarding, and Metrics Advisor will continuously grab new files from the path and perform detection on the metrics. This is a common practice for a data source like Azure Data Lake and Azure Blob Storage.
- If you're ingesting data from data sources like Azure SQL Server, Azure Data Explorer, or other sources, which support using a query script than you need to make sure you are properly constructing your query. This article will teach you how to write a valid query to onboard metric data as expected.
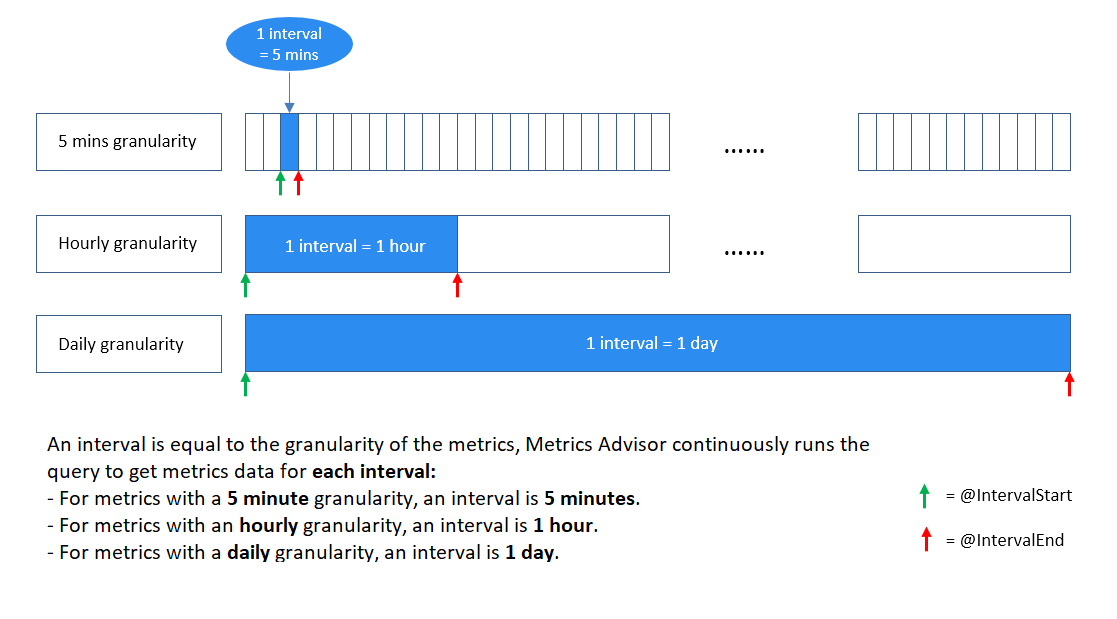
What is an interval?
Metrics need to be monitored at a certain granularity according to business requirements. For example, business Key Performance Indicators (KPIs) are monitored at daily granularity. However, service performance metrics are often monitored at minute/hourly granularity. So the frequency to collect metric data from sources are different.
Metrics Advisor continuously grabs metrics data at each time interval, the interval is equal to the granularity of the metrics. Every time, Metrics Advisor runs the query you have written ingests data at this specific interval. Based on this data ingestion mechanism, the query script should not return all metric data that exists in the database, but needs to limit the result to a single interval.
How to write a valid query?
Use @IntervalStart and @IntervalEnd to limit query results
To help in achieving this, two parameters have been provided to use within the query: @IntervalStart and @IntervalEnd.
Every time when the query runs, @IntervalStart and @IntervalEnd will be automatically updated to the latest interval timestamp and gets corresponding metrics data. @IntervalEnd is always assigned as @IntervalStart + 1 granularity.
Here's an example of proper use of these two parameters with Azure SQL Server:
SELECT [timestampColumnName] AS timestamp, [dimensionColumnName], [metricColumnName] FROM [sampleTable] WHERE [timestampColumnName] >= @IntervalStart and [timestampColumnName] < @IntervalEnd;
By writing the query script in this way, the timestamps of metrics should fall in the same interval for each query result. Metrics Advisor will automatically align the timestamps with the metrics' granularity.
Use aggregation functions to aggregate metrics
It's a common case that there are many columns within customers data sources, however, not all of them make sense to be monitored or included as a dimension. Customers can use aggregation functions to aggregate metrics and only include meaningful columns as dimensions.
Below is an example where there are more than 10 columns in a customer's data source, but only a few of them are meaningful and need to be included and aggregated into a metric to be monitored.
| TS | Market | Device OS | Category | ... | Measure1 | Measure2 | Measure3 |
|---|---|---|---|---|---|---|---|
| 2020-09-18T12:23:22Z | New York | iOS | Sunglasses | ... | 43242 | 322 | 54546 |
| 2020-09-18T12:27:34Z | Beijing | Android | Bags | ... | 3333 | 126 | 67677 |
| ... |
If customer would like to monitor 'Measure1' at hourly granularity and choose 'Market' and 'Category' as dimensions, below are examples of how to properly make use of the aggregation functions to achieve this:
SQL sample:
    SELECT dateadd(hour, datediff(hour, 0, TS),0) as NewTS
    ,Market
    ,Category
    ,sum(Measure1) as M1
    FROM [dbo].[SampleTable] where TS >= @IntervalStart and TS < @IntervalEnd
    group by Market, Category, dateadd(hour, datediff(hour, 0, TS),0)
Azure Data Explorer sample:
    SampleTable
    | where TS >= @IntervalStart and TS < @IntervalEnd
    | summarize M1 = sum(Measure1) by Market, Category, NewTS = startofhour(TS)
Note
In the above case, the customer would like to monitor metrics at an hourly granularity, but the raw timestamp(TS) is not aligned. Within aggregation statement, a process on the timestamp is required to align at the hour and generate a new timestamp column named 'NewTS'.
Common errors during onboarding
Error: Multiple timestamp values are found in query results
This is a common error, if you haven't limited query results within one interval. For example, if you're monitoring a metric at a daily granularity, you will get this error if your query returns results like this:
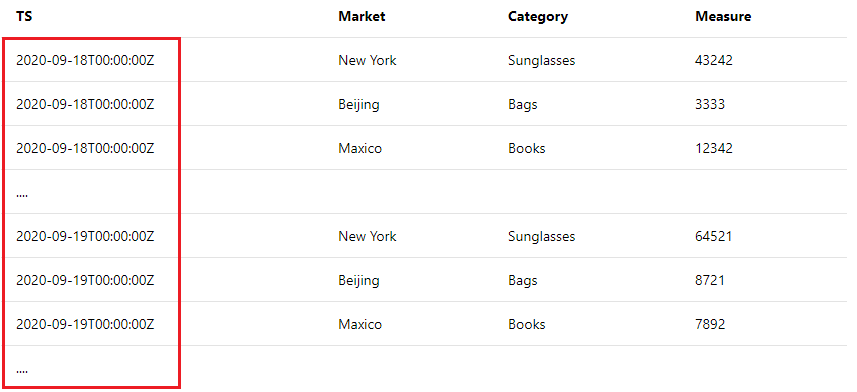
There are multiple timestamp values and they're not in the same metrics interval(one day). Check How does data ingestion work in Metrics Advisor? and understand that Metrics Advisor grabs metrics data at each metrics interval. Then make sure to use @IntervalStart and @IntervalEnd in your query to limit results within one interval. Check Use @IntervalStart and @IntervalEnd to limit query results for detailed guidance and samples.
Error: Duplicate metric values are found on the same dimension combination within one metric interval
Within one interval, Metrics Advisor expects only one metrics value for the same dimension combinations. For example, if you're monitoring a metric at a daily granularity, you will get this error if your query returns results like this:
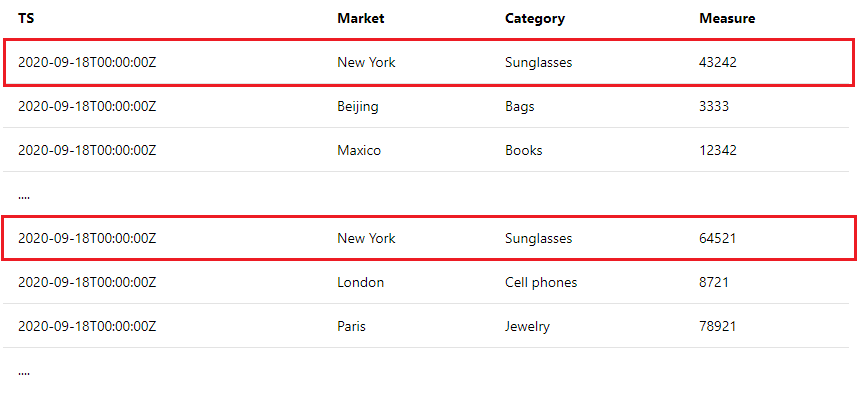
Refer to Use aggregation functions to aggregate metrics for detailed guidance and samples.
Next steps
Advance to the next article to learn how to create.