Troubleshoot log search alerts in Azure Monitor
This article describes how to resolve common issues with log search alerts in Azure Monitor. It also provides solutions to common problems with the functionality and configuration of log alerts.
You can use log alerts to evaluate resources logs every set frequency by using a Log Analytics query, and fire an alert that's based on the results. Rules can trigger one or more actions using Action Groups. To learn more about functionality and terminology of log search alerts, see Log alerts in Azure Monitor.
Note
This article doesn't discuss cases where the alert rule was triggered, you can see it in the Azure portal, but the notification was not sent. See troubleshooting alerts for cases like these.
A log search alert didn't fire when it should have
If your log search alert didn't fire when it should have, check the following items:
Is the alert rule is in a degraded or unavailable health state?
View the health status of your log search alert rule:
In the portal, select Monitor, then Alerts.
From the top command bar, select Alert rules. The page shows all your alert rules on all subscriptions.
Select the log search alert rule that you want to monitor.
From the left pane, under Help, select Resource health.
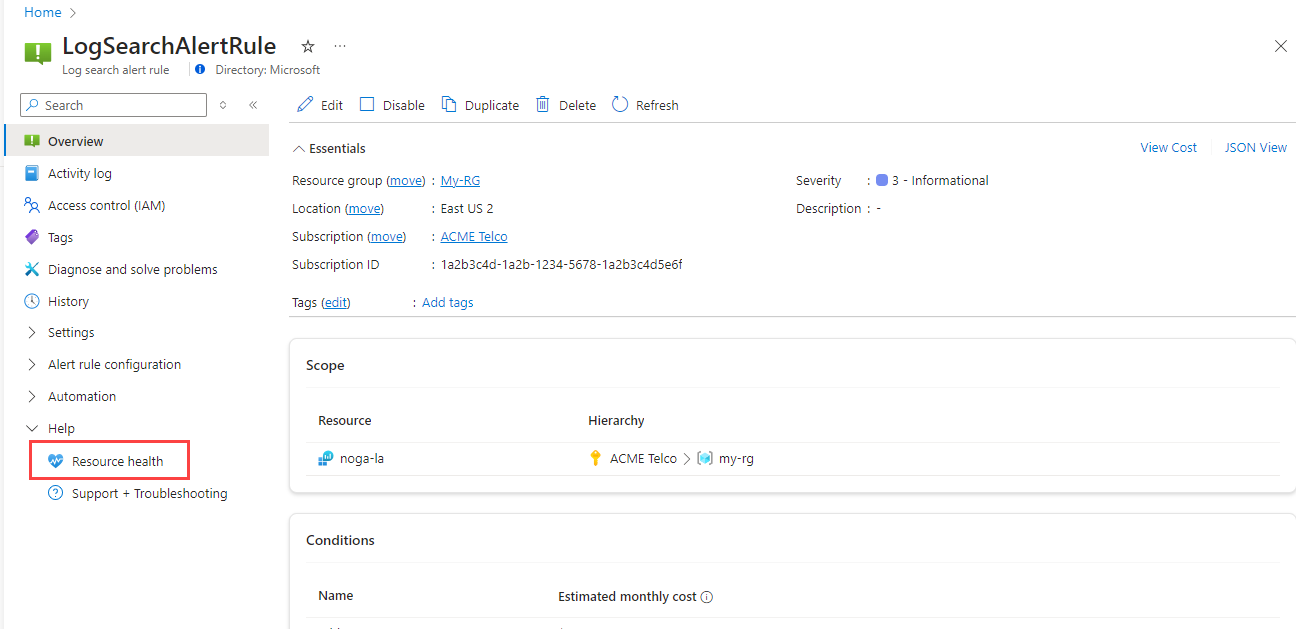
See Monitor the health of log search alert rules to learn more.
Check the log ingestion latency.
Azure Monitor processes terabytes of customers' logs from across the world, which can cause logs ingestion latency.
Logs are semi-structured data and are inherently more latent than metrics. If you're experiencing more than a 4-minute delay in fired alerts, you should consider using metric alerts. You can send data to the metric store from logs using metric alerts for logs.
To mitigate latency, the system retries the alert evaluation multiple times. After the data arrives, the alert fires, which in most cases don't equal the log record time.
Are the actions muted or was the alert rule configured to resolve automatically?
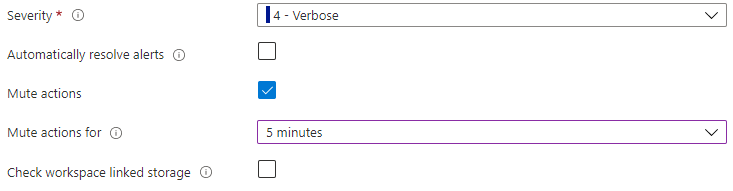
A common issue is that you think that the alert didn't fire, but the rule was configured so that the alert wouldn't fire. See the advanced options of the log search alert rule to verify that both of the following aren't selected:
- The Mute actions checkbox: allows you to mute fired alert actions for a set amount of time.
- Automatically resolve alerts: configures the alert to only fire once per condition being met.
Was the alert rule resource moved or deleted?
If an alert rule resource moves, gets renamed, or is deleted, all log alert rules referring to that resource will break. To fix this issue, alert rules need to be recreated using a valid target resource for the scope.
Does the alert rule use a system-assigned managed identity?
When you create a log alert rule with system-assigned managed identity, the identity is created without any permissions. After you create the rule, you need to assign the appropriate roles to the rule’s identity so that it can access the data you want to query. For example, you might need to give it a Reader role for the relevant Log Analytics workspaces, or a Reader role and a Database Viewer role for the relevant ADX cluster. See managed identities for more information about using managed identities in log alerts.
Is the query used in the log search alert rule valid?
When a log alert rule is created, the query is validated for correct syntax. But sometimes the query provided in the log alert rule can start to fail. Some common reasons are:
- Rules were created via the API, and the user skipped validation.
- The query runs on multiple resources, and one or more of the resources was deleted or moved.
- The query fails because:
- The logging solution wasn't deployed to the workspace, so tables aren't created.
- Data stopped flowing to a table in the query for more than 30 days.
- Custom logs tables haven't been created because the data flow hasn't started.
- Changes in the query language include a revised format for commands and functions, so the query provided earlier is no longer valid.
Azure Advisor warns you about this behavior. It adds a recommendation about the affected log search alert rule. The category used is 'High Availability' with medium impact and a description of 'Repair your log alert rule to ensure monitoring'.
Was the the log search alert rule disabled?
If a log search alert rule query fails to evaluate continuously for a week, Azure Monitor disables it automatically.
The following sections list some reasons why Azure Monitor might disable a log search alert rule. Additionally, there's an example of the Activity log event that is submitted when a rule is disabled.

Activity log example when rule is disabled
{
    "caller": "Microsoft.Insights/ScheduledQueryRules",
    "channels": "Operation",
    "claims": {
        "http://schemas.xmlsoap.org/ws/2005/05/identity/claims/spn": "Microsoft.Insights/ScheduledQueryRules"
    },
    "correlationId": "abcdefg-4d12-1234-4256-21233554aff",
    "description": "Alert: test-bad-alerts is disabled by the System due to : Alert has been failing consistently with the same exception for the past week",
    "eventDataId": "f123e07-bf45-1234-4565-123a123455b",
    "eventName": {
        "value": "",
        "localizedValue": ""
    },
    "category": {
        "value": "Administrative",
        "localizedValue": "Administrative"
    },
    "eventTimestamp": "2019-03-22T04:18:22.8569543Z",
    "id": "/SUBSCRIPTIONS/<subscriptionId>/RESOURCEGROUPS/<ResourceGroup>/PROVIDERS/MICROSOFT.INSIGHTS/SCHEDULEDQUERYRULES/TEST-BAD-ALERTS",
    "level": "Informational",
    "operationId": "",
    "operationName": {
        "value": "Microsoft.Insights/ScheduledQueryRules/disable/action",
        "localizedValue": "Microsoft.Insights/ScheduledQueryRules/disable/action"
    },
    "resourceGroupName": "<Resource Group>",
    "resourceProviderName": {
        "value": "MICROSOFT.INSIGHTS",
        "localizedValue": "Microsoft Insights"
    },
    "resourceType": {
        "value": "MICROSOFT.INSIGHTS/scheduledqueryrules",
        "localizedValue": "MICROSOFT.INSIGHTS/scheduledqueryrules"
    },
    "resourceId": "/SUBSCRIPTIONS/<subscriptionId>/RESOURCEGROUPS/<ResourceGroup>/PROVIDERS/MICROSOFT.INSIGHTS/SCHEDULEDQUERYRULES/TEST-BAD-ALERTS",
    "status": {
        "value": "Succeeded",
        "localizedValue": "Succeeded"
    },
    "subStatus": {
        "value": "",
        "localizedValue": ""
    },
    "submissionTimestamp": "2019-03-22T04:18:22.8569543Z",
    "subscriptionId": "<SubscriptionId>",
    "properties": {
        "resourceId": "/SUBSCRIPTIONS/<subscriptionId>/RESOURCEGROUPS/<ResourceGroup>/PROVIDERS/MICROSOFT.INSIGHTS/SCHEDULEDQUERYRULES/TEST-BAD-ALERTS",
        "subscriptionId": "<SubscriptionId>",
        "resourceGroup": "<ResourceGroup>",
        "eventDataId": "12e12345-12dd-1234-8e3e-12345b7a1234",
        "eventTimeStamp": "03/22/2019 04:18:22",
        "issueStartTime": "03/22/2019 04:18:22",
        "operationName": "Microsoft.Insights/ScheduledQueryRules/disable/action",
        "status": "Succeeded",
        "reason": "Alert has been failing consistently with the same exception for the past week"
    },
    "relatedEvents": []
}
A log search alert fired when it shouldn't have
A configured log alert rule in Azure Monitor might be triggered unexpectedly. The following sections describe some common reasons.
Was the alert triggered due to latency issues?
Azure Monitor processes terabytes of customer logs globally, which can cause logs ingestion latency. There are built-in capabilities to prevent false alerts, but they can still occur on very latent data (over ~30 minutes) and data with latency spikes.
Logs are semi-structured data and are inherently more latent than metrics. If you're experiencing many misfires in fired alerts, consider using metric alerts. You can send data to the metric store from logs using metric alerts for logs.
Log search alerts work best when you're trying to detect specific data in the logs. They're less effective when you're trying to detect lack of data in the logs, like alerting on virtual machine heartbeat.
Error messages when configuring log search alert rules
See the following sections for specific error messages and their resolutions.
The query couldn't be validated since you need permission for the logs
If you receive this error message when creating or editing your alert rule query, make sure you have permissions to read the target resource logs.
- Permissions required to read logs in workspace-context access mode:
Microsoft.OperationalInsights/workspaces/query/read. - Permissions required to read logs in resource-context access mode (including workspace-based Application Insights resource):
Microsoft.Insights/logs/tableName/read.
See Manage access to Log Analytics workspaces to learn more about permissions.
One-minute frequency isn't supported for this query
There are some limitations to using a one-minute alert rule frequency. When you set the alert rule frequency to one minute, an internal manipulation is performed to optimize the query. This manipulation can cause the query to fail if it contains unsupported operations.
For a list of unsupported scenarios, see this note.
Failed to resolve scalar expression named <>
This error message can be returned when creating or editing your alert rule query if:
- You're referencing a column that doesn't exist in the table schema.
- You're referencing a column that wasn't used in a prior project clause of the query.
To mitigate this, you can either add the column to the previous project clause or use the columnifexists operator.
ScheduledQueryRules API isn't supported for read only OMS Alerts
This error message is returned when trying to update or delete rules created with the legacy API version by using the Azure portal.
- Edit or delete the rule programmatically using the Log Analytics REST API.
- Recommended: Upgrade your alert rules to use Scheduled Query Rules API (legacy API is on a deprecation path).
Alert rule service limit was reached
For details about the number of log search alert rules per subscription and maximum limits of resources, see Azure Monitor service limits. See Check the total number of log alert rules in use to see how many metric alert rules are currently in use. If you've reached the quota limit, the following steps might help resolve the issue.
Delete or disable log search alert rules that aren’t used anymore.
Use splitting by dimensions to reduce the number of rules. When you use splitting by dimensions, one rule can monitor many resources.
If you need the quota limit to be increased, continue to open a support request, and provide the following information:
- The Subscription IDs and Resource IDs for which the quota limit needs to be increased
- The reason for quota increase
- The resource type for the quota increase, such as Log Analytics or Application Insights
- The requested quota limit
Next steps
- Learn about log alerts in Azure.
- Learn more about configuring log alerts.
- Learn more about log queries.
Feedback
Coming soon: Throughout 2024 we will be phasing out GitHub Issues as the feedback mechanism for content and replacing it with a new feedback system. For more information see: https://aka.ms/ContentUserFeedback.
Submit and view feedback for