Ingest custom metrics for an Azure resource using the REST API
This article shows you how to send custom metrics for Azure resources to the Azure Monitor metrics store via the REST API. When the metrics are in Azure Monitor, you can do all the things with them that you do with standard metrics. For example, you can generate charts and alerts and route the metrics to other external tools.
Note
The REST API only permits sending custom metrics for Azure resources. To send metrics for resources in other environments or on-premises, use Application Insights.
Send REST requests to ingest custom metrics
When you send custom metrics to Azure Monitor, each data point, or value, reported in the metrics must include the following information.
- Authentication token
- Subject
- Region
- Timestamp
- Namespace
- Name
- Dimension keys
- Dimension values
- Metric values
Authentication
To submit custom metrics to Azure Monitor, the entity that submits the metric needs a valid Microsoft Entra token in the Bearer header of the request. Supported ways to acquire a valid bearer token include:
Managed identities for Azure resources. You can use a managed identity to give resources permissions to carry out certain operations. An example is allowing a resource to emit metrics about itself. A resource, or its managed identity, can be granted Monitoring Metrics Publisher permissions on another resource. With this permission, the managed identity can also emit metrics for other resources.
Microsoft Entra service principal. In this scenario, a Microsoft Entra application, or service, can be assigned permissions to emit metrics about an Azure resource. To authenticate the request, Azure Monitor validates the application token by using Microsoft Entra public keys. The existing Monitoring Metrics Publisher role already has this permission. It's available in the Azure portal.
The service principal, depending on what resources it emits custom metrics for, can be given the Monitoring Metrics Publisher role at the scope required. Examples are a subscription, resource group, or specific resource.
Tip
When you request a Microsoft Entra token to emit custom metrics, ensure that the audience or resource that the token is requested for is https://monitoring.azure.com/. Be sure to include the trailing slash.
Get an authorization token
Once you have created your managed identity or service principal and assigned Monitoring Metrics Publisher permissions, you can get an authorization token by using the following request:
curl -X POST 'https://login.microsoftonline.com/<tennant ID>/oauth2/token' \
-H 'Content-Type: application/x-www-form-urlencoded' \
--data-urlencode 'grant_type=client_credentials' \
--data-urlencode 'client_id=<your apps client ID>' \
--data-urlencode 'client_secret=<your apps client secret' \
--data-urlencode 'resource=https://monitoring.azure.com'
The response body appears in the following format:
{
    "token_type": "Bearer",
    "expires_in": "86399",
    "ext_expires_in": "86399",
    "expires_on": "1672826207",
    "not_before": "1672739507",
    "resource": "https://monitoring.azure.com",
    "access_token": "eyJ0eXAiOiJKV1Qi....gpHWoRzeDdVQd2OE3dNsLIvUIxQ"
}
Save the access token from the response for use in the following HTTP requests.
Subject
The subject property captures which Azure resource ID the custom metric is reported for. This information is encoded in the URL of the API call. Each API can submit metric values for only a single Azure resource.
Note
You can't emit custom metrics against the resource ID of a resource group or subscription.
Region
The region property captures the Azure region where the resource you're emitting metrics for is deployed. Metrics must be emitted to the same Azure Monitor regional endpoint as the region where the resource is deployed. For example, custom metrics for a VM deployed in West US must be sent to the WestUS regional Azure Monitor endpoint. The region information is also encoded in the URL of the API call.
Timestamp
Each data point sent to Azure Monitor must be marked with a timestamp. This timestamp captures the date and time at which the metric value is measured or collected. Azure Monitor accepts metric data with timestamps as far as 20 minutes in the past and 5 minutes in the future. The timestamp must be in ISO 8601 format.
Namespace
Namespaces are a way to categorize or group similar metrics together. By using namespaces, you can achieve isolation between groups of metrics that might collect different insights or performance indicators. For example, you might have a namespace called contosomemorymetrics that tracks memory-use metrics which profile your app. Another namespace called contosoapptransaction might track all metrics about user transactions in your application.
Name
The name property is the name of the metric that's being reported. Usually, the name is descriptive enough to help identify what's measured. An example is a metric that measures the number of memory bytes used on a VM. It might have a metric name like Memory Bytes In Use.
Dimension keys
A dimension is a key/value pair that helps describe other characteristics about the metric that's being collected. By using the other characteristics, you can collect more information about the metric, which allows for deeper insights.
For example, the Memory Bytes In Use metric might have a dimension key called Process that captures how many bytes of memory each process on a VM consumes. By using this key, you can filter the metric to see how much memory specific processes use or to identify the top five processes by memory usage.
Dimensions are optional, and not all metrics have dimensions. A custom metric can have up to 10 dimensions.
Dimension values
When you're reporting a metric data point, for each dimension key on the reported metric, there's a corresponding dimension value. For example, you might want to report the memory that ContosoApp uses on your VM:
- The metric name would be Memory Bytes in Use.
- The dimension key would be Process.
- The dimension value would be ContosoApp.exe.
When you're publishing a metric value, you can specify only a single dimension value per dimension key. If you collect the same memory utilization for multiple processes on the VM, you can report multiple metric values for that timestamp. Each metric value would specify a different dimension value for the Process dimension key.
Although dimensions are optional, if a metric post defines dimension keys, corresponding dimension values are mandatory.
Metric values
Azure Monitor stores all metrics at 1-minute granularity intervals. During a given minute, a metric might need to be sampled several times. An example is CPU utilization. Or a metric might need to be measured for many discrete events, such as sign-in transaction latencies.
To limit the number of raw values that you have to emit and pay for in Azure Monitor, locally pre-aggregate and emit the aggregated values:
- Min: The minimum observed value from all the samples and measurements during the minute.
- Max: The maximum observed value from all the samples and measurements during the minute.
- Sum: The summation of all the observed values from all the samples and measurements during the minute.
- Count: The number of samples and measurements taken during the minute.
Note
Azure Monitor doesn't support defining Units for a custom metric.
For example, if there were four sign-in transactions to your app during a minute, the resulting measured latencies for each might be:
| Transaction 1 | Transaction 2 | Transaction 3 | Transaction 4 |
|---|---|---|---|
| 7 ms | 4 ms | 13 ms | 16 ms |
Then the resulting metric publication to Azure Monitor would be:
- Min: 4
- Max: 16
- Sum: 40
- Count: 4
If your application can't pre-aggregate locally and needs to emit each discrete sample or event immediately upon collection, you can emit the raw measure values. For example, each time a sign-in transaction occurs on your app, you publish a metric to Azure Monitor with only a single measurement. So, for a sign-in transaction that took 12 milliseconds, the metric publication would be:
- Min: 12
- Max: 12
- Sum: 12
- Count: 1
With this process, you can emit multiple values for the same metric/dimension combination during a given minute. Azure Monitor then takes all the raw values emitted for a given minute and aggregates them.
Sample custom metric publication
In the following example, create a custom metric called Memory Bytes in Use under the metric namespace Memory Profile for a virtual machine. The metric has a single dimension called Process. For the timestamp, metric values are emitted for two processes.
Store the following JSON in a file called custommetric.json on your local computer. Update the time parameter so that it's within the last 20 minutes. You can't put a metric into the store that's more than 20 minutes old.
{
    "time": "2024-01-07T11:25:20-7:00",
    "data": {

      "baseData": {

        "metric": "Memory Bytes in Use",
        "namespace": "Memory Profile",
        "dimNames": [
          "Process"
        ],
        "series": [
          {
            "dimValues": [
              "ContosoApp.exe"
            ],
            "min": 10,
            "max": 89,
            "sum": 190,
            "count": 4
          },
          {
            "dimValues": [
              "SalesApp.exe"
            ],
            "min": 10,
            "max": 23,
            "sum": 86,
            "count": 4
          }
        ]
      }
    }
  }
Submit the following HTTP POST request by using the following variables:
location: Deployment region of the resource you're emitting metrics for.resourceId: Resource ID of the Azure resource you're tracking the metric against.accessToken: The authorization token acquired from the Get an authorization token step.curl -X POST 'https://<location>/.monitoring.azure.com<resourceId>/metrics' \ -H 'Content-Type: application/json' \ -H 'Authorization: Bearer <accessToken>' \ -d @custommetric.json
View your metrics
Sign in to the Azure portal.
In the menu on the left, select Monitor.
On the Monitor page, select Metrics.
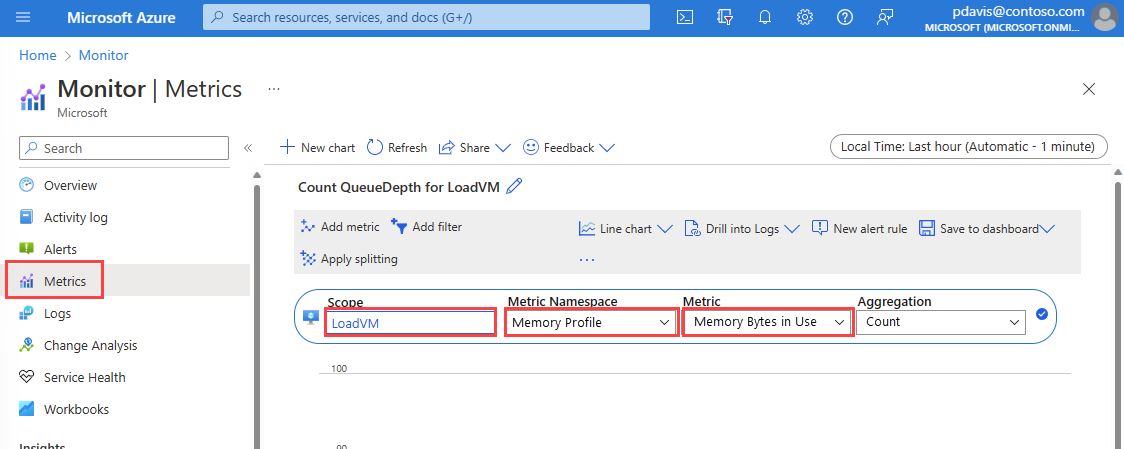
Change the aggregation period to Last hour.
In the Scope dropdown list, select the resource you send the metric for.
In the Metric Namespace dropdown list, select Memory Profile.
In the Metric dropdown list, select Memory Bytes in Use.
Troubleshooting
If you receive an error message with some part of the process, consider the following troubleshooting information:
- If you can't issue metrics against a subscription or resource group, or resource, check that your application or service principal has the Monitoring Metrics Publisher role assigned in Access control (IAM).
- Check that the number of dimension names matches the number of values.
- Check that you're emitting metrics to the correct Azure Monitor regional endpoint. For example, if your resource is deployed in West US, you must emit metrics to the West US regional endpoint.
- Check that the timestamp is within the last 20 minutes.
- Check that the timestamp is in ISO 8601 format.
- Check that the metric name is valid. For example, it can't contain spaces.
Next steps
Learn more about custom metrics.
Feedback
Coming soon: Throughout 2024 we will be phasing out GitHub Issues as the feedback mechanism for content and replacing it with a new feedback system. For more information see: https://aka.ms/ContentUserFeedback.
Submit and view feedback for