Applying FinOps to Azure Data Factory
This article describes how to apply FinOps in Azure Data Factory.
What is FinOps?
The FinOps Foundation Technical Advisory Council defines FinOps accordingly:
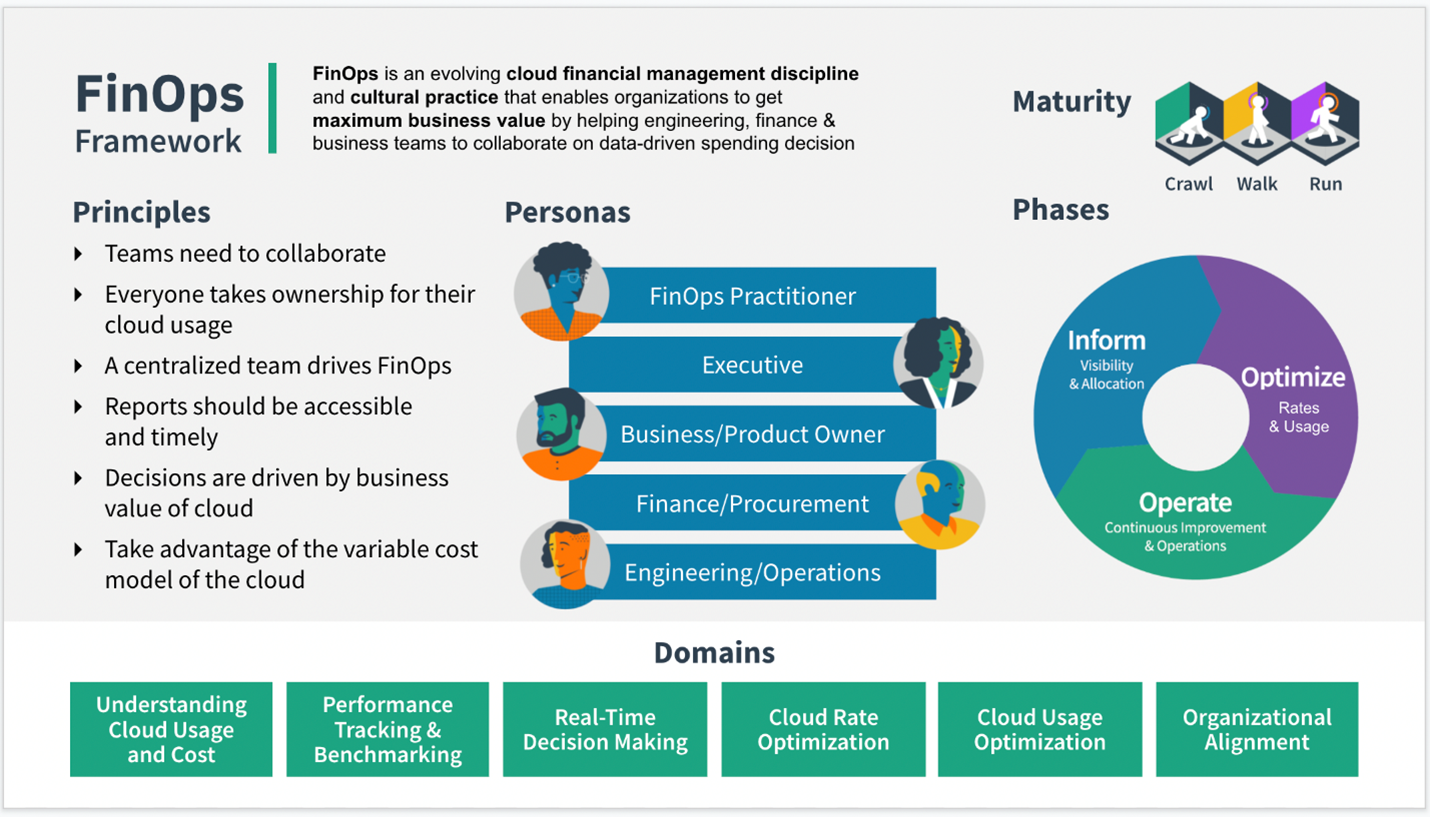
FinOps is an evolving cloud financial management discipline and cultural practice that enables organizations to get maximum business value by helping engineering, finance, technology, and business teams to collaborate on data-driven spending decisions.
At its core, FinOps is a cultural practice. It’s the way for teams to manage their cloud costs, where everyone takes ownership of their cloud usage supported by a central best-practices group. Cross-functional teams in Engineering, Finance, Product, etc. work together to enable faster product delivery, while at the same time gaining more financial control and predictability.
How to apply FinOps to Azure Data Factory
Azure Data Factory is Microsoft’s Data Integration and ETL (extract, transform, load) service in the cloud. To achieve effective budgeting and cost controls in data factory, we first review how to understand the pricing model. Next, it's important to analyze your spending at factory and pipeline levels. You can do this with data factory's built-in consumption reports and at the Azure subscription level using Azure cost management and cost analysis features. Lastly, we talk about setting spending limits on your Azure subscription to help provide cost controls.
Understanding Azure Data Factory pricing
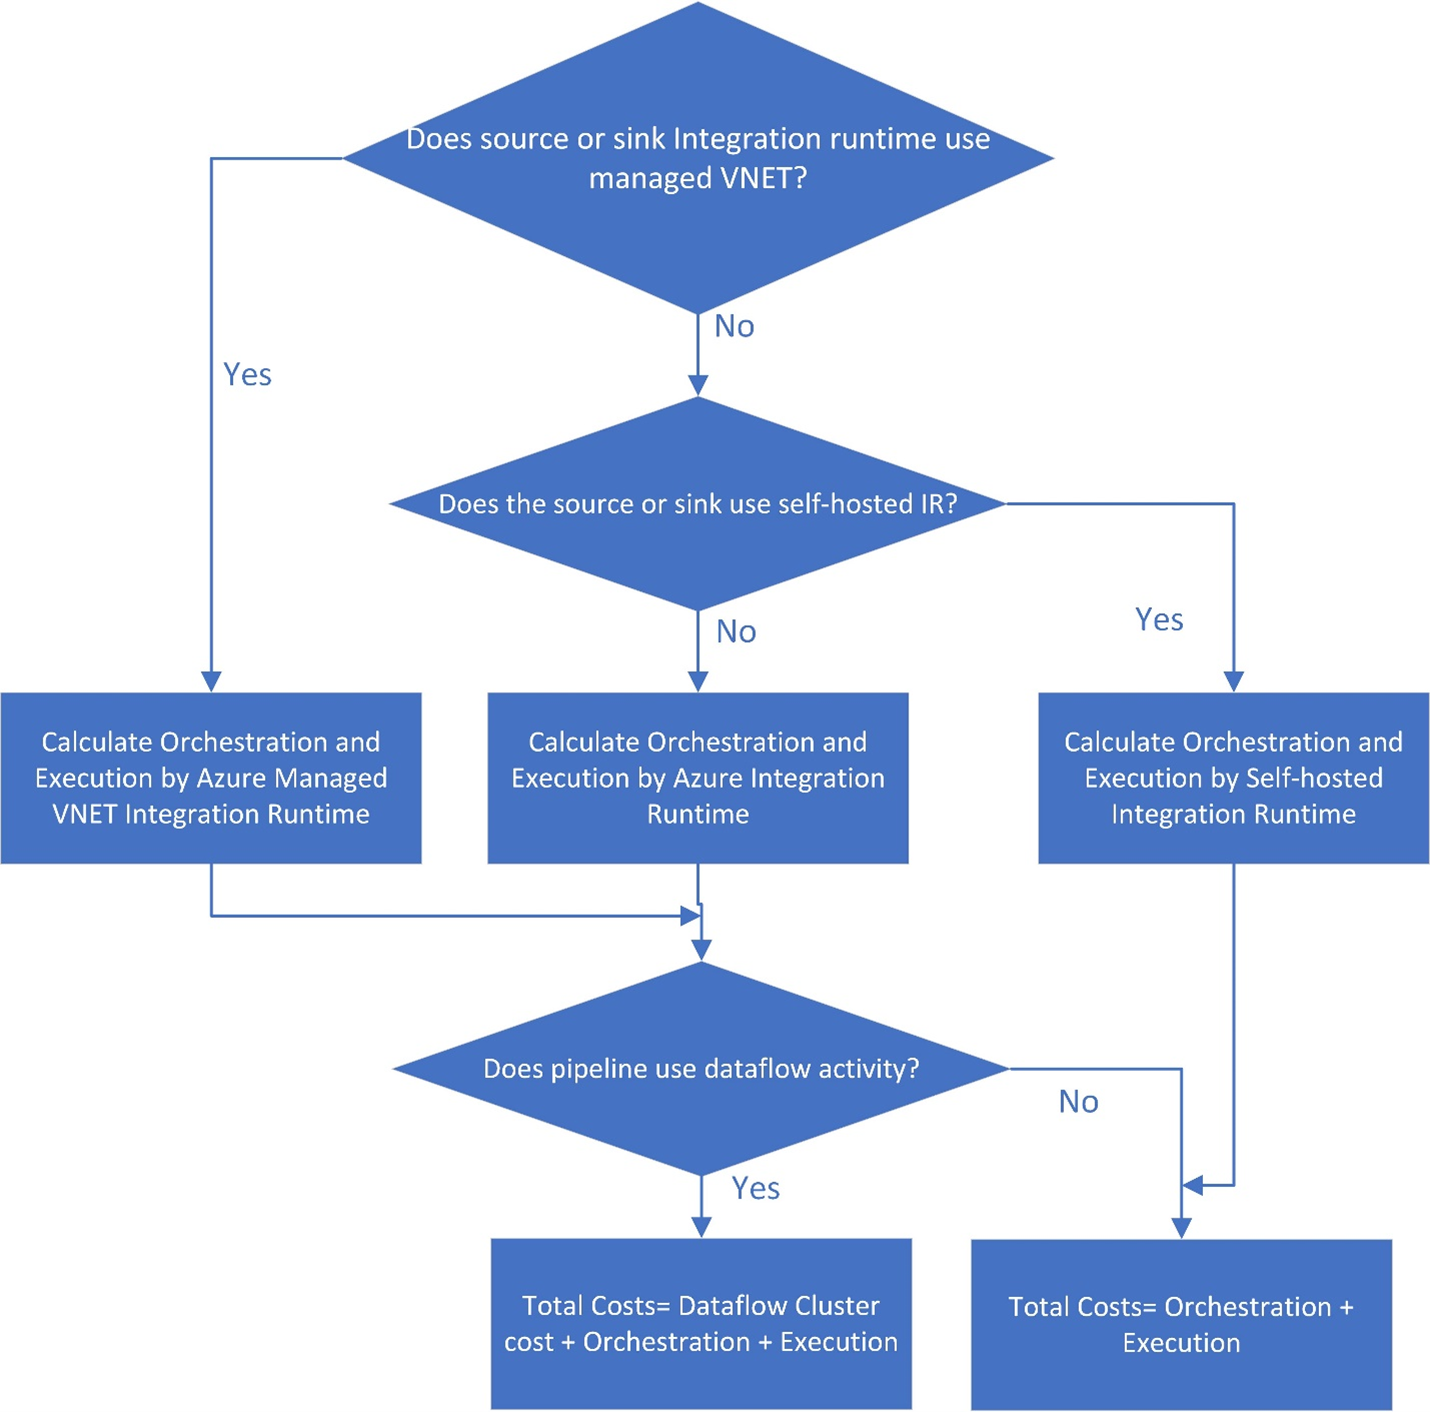
The chart below explains the general flow of calculating data factory pricing. It shows how to use the Azure Pricing Calculator for calculating pricing. Overall, the primary parts to understanding data factory billing involve these costs: orchestration, execution, type of integration runtime (IR), data movement (copy), and data flows.
- Check whether your data factory source or sink integration runtime uses managed virtual network (VNET). If so, orchestration and execution are calculated using the Azure managed VNET IR. If not, proceed to the next step.
- Confirm whether the source or sink uses the self-hosted integration runtime. If so, orchestration and execution are calculated by the self-hosted IR, and the total cost equals the sum of costs for both orchestration and execution. If not, orchestration and execution are calculated by the Azure IR.
- For Azure IR and Azure managed VNET IR, confirm whether you use data flow. If so, the total cost equals the sum of costs for the data flow cluster, orchestration, and execution. Otherwise, the total cost is simply the sum of costs for orchestration and execution.
Example scenarios
Let's look at several examples of common data factory scenarios and estimated costs associated with each workload. As we work through each example, keep these standards for data factory costs in mind:
- When you review your bill, keep in mind that data factory rounds up to the minute for each activity duration (that is, 1 min 1 sec = 2-min billing).
- The following examples are based on common scenarios and show estimated costs.
- Other costs can be incurred from the data stores and external services in Azure that you utilize.
- Your actual costs can differ slightly from these examples based on the sales contract terms that you have with Microsoft.
- This link provides more examples: Understanding Azure Data Factory pricing through examples.
Example: Copy data and transform with Azure Databricks hourly
In this scenario, you want to copy data from AWS S3 to Azure Blob storage and transform the data with Azure Databricks on an hourly schedule for 8 hours per day for 30 days.
The prices used in this example are hypothetical and aren't intended to imply actual exact pricing. Read/write and monitoring costs aren't shown since they're typically negligible and won't impact overall costs significantly. Activity runs are also rounded to the nearest 1000 in pricing calculator estimates.
Configuration
To accomplish the scenario, you need to create a pipeline with the following items:
- One copy activity with an input dataset for the data to be copied from AWS S3, and an output dataset for the data on Azure storage.
- One Azure Databricks activity for the data transformation.
- One scheduled trigger to execute the pipeline every hour. When you want to run a pipeline, you can either trigger it immediately or schedule it. In addition to the pipeline itself, each trigger instance counts as a single Activity run.
Cost estimation
Refer to the Azure Pricing Calculator and flow using the following steps:
- If both the source and sink don't use Azure managed VNET, go to Step 2.
- If both the source and sink don't use self-hosted IR, orchestration and execution are calculated using Azure IR.
- We only use the copy activity and an external activity here. It doesn't use the data flow activity, so the total cost equals the sum of the costs for orchestration and execution.
Estimated pricing for a month (8 hours per day for 30 days):
| Types | Calculation |
|---|---|
| Orchestration (activity run counts in thousands) | 3 activity runs per execution (1 for trigger run, 2 for activity runs). Activity run counts/month = 3 * 8 * 30 = 720. Activity run counts in thousand/month = 1 |
| Execution | 1. Data integration unit (DIU) hours: • DIU hours per execution = 10 min • Default DIU setting = 4 • DIU hours/month = (10 min / 60 min) * 4 * 8 * 30 = 160 2. External pipeline activity execution hours: • Per execution time: 10 min • External pipeline activity execution hours = (10 min / 60 min) * 8 * 30 = 40 |
Pricing calculator example
Total scenario pricing for 30 days: $41.01

Example: Using mapping data flow debug for a normal workday
This example shows mapping data flow debug costs for a typical workday for a data engineer. The prices used in the following example are hypothetical and aren't intended to imply exact actual pricing. Read/write and monitoring costs aren't shown since they're typically negligible and won't impact overall costs significantly. Activity runs are also rounded to the nearest 1000 in pricing calculator estimates.
Azure Data Factory engineer
A data factory engineer is responsible for designing, building, and testing mapping data flows every day. The engineer logs into the Azure Data Factory Studio in the morning and enables the debug mode for data Flows. The default Time to Live (TTL) for debug sessions is 60 minutes. The engineer works throughout the day for 8 hours, so the debug session never expires. Therefore, the engineer's charges for the day are:
8 hours * 8 compute-optimized cores * $0.193 per hour per core = $12.35
Budgeting
When planning an Azure Data Factory implementation, it's important to understand and forecast your costs to help build a budget for your ETL and data integration projects.
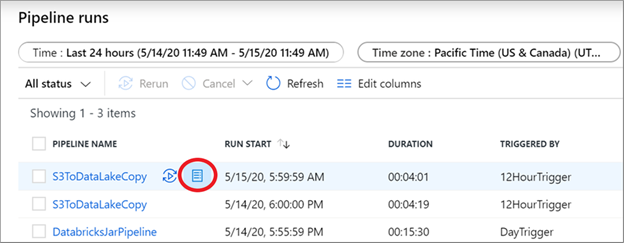
Select on the consumption report button from the pipeline monitoring view to get a snapshot of the units billed for each run.
On the monitoring page, you can manually use the consumption report for any pipeline run from a debug or manually triggered run, or even from an automated trigger run.
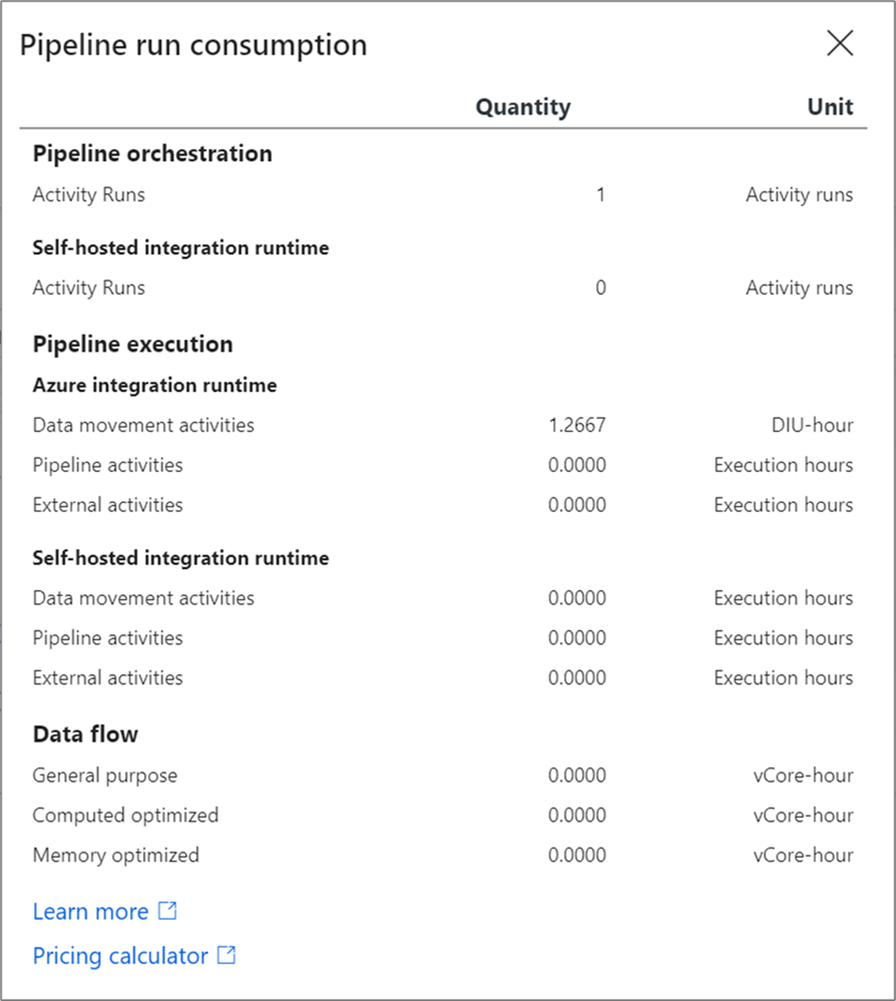
The data factory pipeline consumption report provides the estimated units billed. You can run these tests using a debug execution of your pipeline on smaller datasets and then extrapolate your production budget from these estimates.
The consumption report provides values in units. To derive a monetary estimate from this, multiply the units’ value in this report by the price in your region based on the Azure pricing calculator. This produces an estimate for that pipeline execution. A best practice is to execute the pipeline several times with different datasets to get a baseline range of costs and use an average of those runs for your budgeting.
Azure cost optimization
This section discusses cost optimization with Microsoft cost management, the Azure Advisor, and for reserved instances in data factory.
Microsoft cost management
Microsoft Azure provides tools that help you to track, optimize, and control your Azure spending. If your data factory spending is a top priority, the recommendation is to create a separate resource group in Azure for each data factory. This way, it's easy to build budgets, track your spending, and apply cost controls using Microsoft Cost Management.

Today organizations are working harder than ever to control spending and do more with less. You can use the Azure budgets feature to set spending limits on your Azure Data Factory v2 usage and the overall Azure resource group that you're using for data factory.
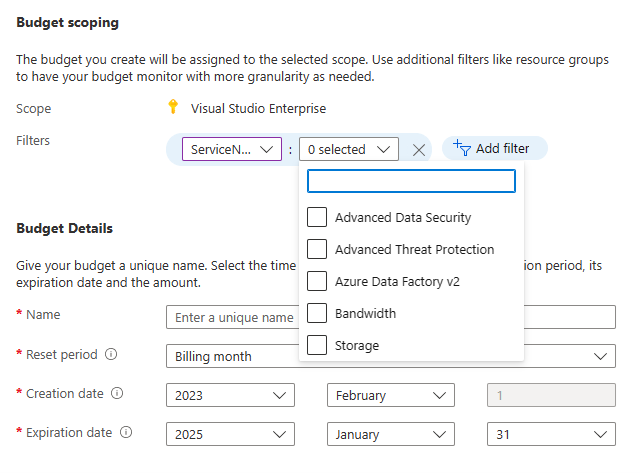
From the create budget window, use filters to choose either the Azure Data Factory service or a resource group.
Azure Advisor
Another valuable tool for optimizing your Azure budget is Azure Advisor. With Azure Advisor, you can receive recommendations for reducing your overall Azure spending. This includes utilization of Azure Data Factory's reserved instance pricing for reducing costs of mapping data flows. You can also pay for Azure Data Factory charges with your Azure pre-payment credit.

Reserved instances in Azure Data Factory
Reserved instances are available in Azure Data Factory for mapping data flows, which you can use to provide savings over the normal list price of data flows. With reserved instances, you pre-purchase 1-year or 3-year reservations at discount levels based on the length of the reservation. To see a customized view of your cost savings using reserved instances, navigate to the Azure portal and choose Reservations, then select data factory. From there, you'll pick the type of data flows that you typically use, and the Azure portal will then estimate your future savings based on your previous data factory utilization.
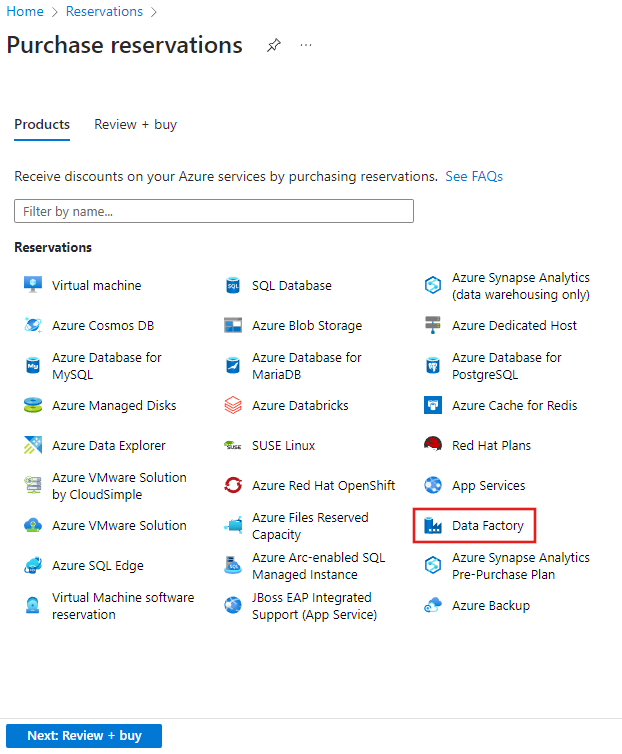
Reserving mapping data flow capacity using reserved instances can provide an immediate discount on your overall data factory spending related directly to your data flow usage.
Tracking your data factory spending
As you build out your data integration infrastructure in Azure, it's important to track your spending over time. There are several ways to track your data factory budget. By default, data factory provides an all-up summarized cost for your factory based on the different billing meters that the service utilizes.
How to use pipeline billing granular view
You can ask data factory to provide a pipeline-level roll-up of your costs by setting the factory to use by pipeline billing as an option under factory settings.
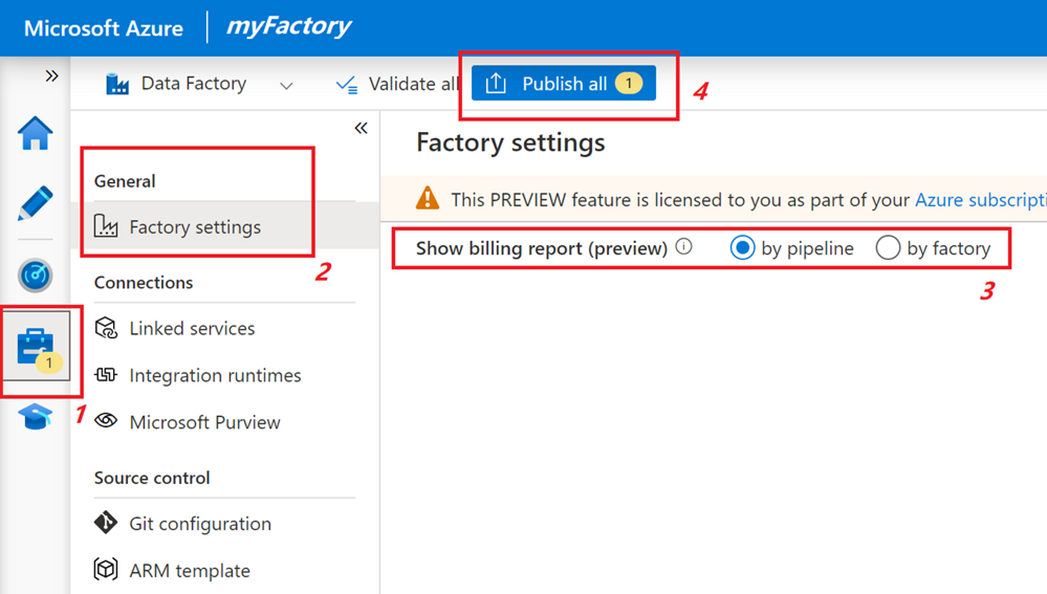
This view gives you a breakdown of your data factory spend by each pipeline. This can be useful to attribute costs at a line-item level rather than a factory roll-up (which is the default).
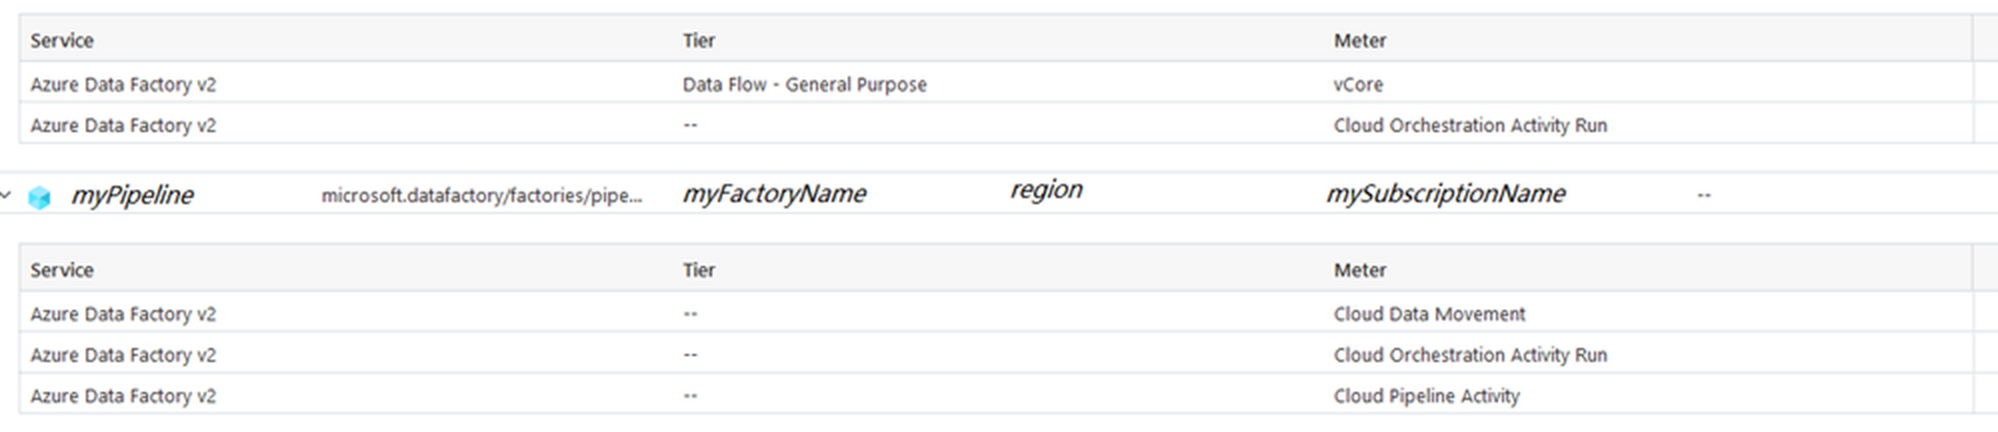
The pipeline-level view of your data factory bill is useful to attribute overall data factory costs to each pipeline resource. It's also useful to provide an easy-to-use mechanism to implement charge-back to users of your factory, both for internal organization consumption and external customer or partner usage.
How to use tags for pipeline cost attribution
Another mechanism for tracking attributing costs for your data factory resource is to use tagging in your factory. You can assign the same tag to your data factory and other Azure resources, putting them into the same category to view their consolidated billing. All SSIS (SQL Server Integration Services) IRs within the factory inherit this tag. Keep in mind that if you change your data factory tag, you need to stop and restart all SSIS IRs within the factory for them to inherit the new tag. For more details, refer to the reconfigure SSIS IR section.
Related content
Feedback
Coming soon: Throughout 2024 we will be phasing out GitHub Issues as the feedback mechanism for content and replacing it with a new feedback system. For more information see: https://aka.ms/ContentUserFeedback.
Submit and view feedback for