Get insights into data stewardship from Microsoft Purview
As described in the insights concepts, the data stewardship report is part of the "Health" section of the Data Estate Insights App. This report offers a one-stop shop experience for data, governance, and quality focused users like chief data officers and data stewards to get actionable insights into key areas of gap in their data estate.
In this guide, you'll learn how to:
- Navigate and view data stewardship report from your Microsoft Purview account.
- Drill down for more asset count details.
Prerequisites
Before getting started with Microsoft Purview Data Estate Insights, make sure that you've completed the following steps:
- Set up a storage resource and populated the account with data.
- Set up and completed a scan your storage source. For more information to create and complete a scan, see the manage data sources in Microsoft Purview article.
- Permissions depending on your current experience:
- If using the classic Microsoft Purview Catalog, you need the data curator role or insight reader role.
- If using the new Microsoft Purview data catalog, you need data health reader permissions.
Understand your data estate and catalog health in Data Estate Insights
In Microsoft Purview Data Estate Insights, you can get an overview of all assets inventoried in the Data Map, and any key gaps that can be closed by governance stakeholders, for better governance of the data estate.
Open the Microsoft Purview portal.
If you're using the classic Microsoft Purview portal, select the Data estate insights
 menu item. If you're using the new Microsoft Purview portal open the Data catalog, select the Data estate insights drop down, and then select Reports.
Select Data Stewardship.
View data stewardship dashboard
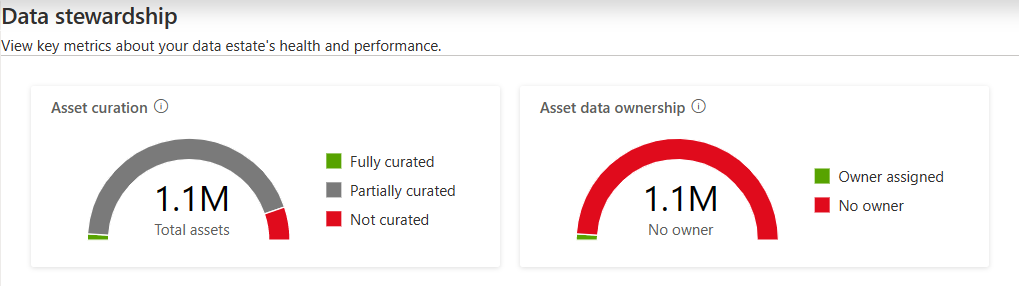
The dashboard is purpose-built for the governance and quality focused users, like data stewards and chief data officers, to understand the data estate health of their organization. The dashboard shows high level KPIs that need to reduce governance risks:
Asset curation: All data assets are categorized into three buckets - "Fully curated", "Partially curated" and "Not curated", based on certain attributes of assets being present. An asset is "Fully curated" if it has at least one classification tag, an assigned Data Owner and a description. If any of these attributes is missing, but not all, then the asset is categorized as "Partially curated" and if all of them are missing, then it's "Not curated".
Asset data ownership: Assets that have the owner attribute within "Contacts" tab as blank are categorized as "No owner", else it's categorized as "Owner assigned".

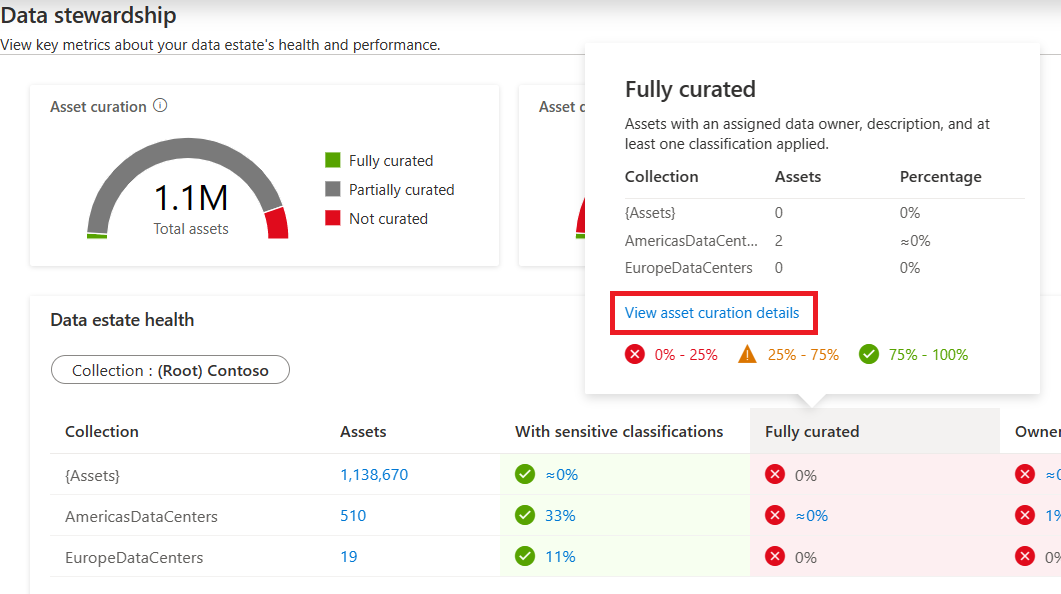
Data estate health
Data estate health is a scorecard view that helps management and governance focused users, like chief data officers, understand critical governance metrics that can be looked at by collection hierarchy.

You can view the following metrics:
- Assets: Count of assets by collection drill-down
- With sensitive classifications: Count of assets with any system classification applied
- Fully curated assets: Count of assets that have a data owner, at least one classification and a description.
- Owner assigned: Count of assets with data owner assigned on them
- No classifications: Count of assets with no classification tag
- Out of date: Percentage of assets that have not been updated in over 365 days.
- New: Count of new assets pushed in the Data Map in the last 30 days
- Updated: Count of assets updated in the Data Map in the last 30 days
- Deleted: Count of deleted assets from the Data Map in the last 30 days
You can also drill down by collection paths. As you hover on each column name, it provides description of the column, provides recommended percentage ranges, and takes you to the detailed graph for further drill-down.
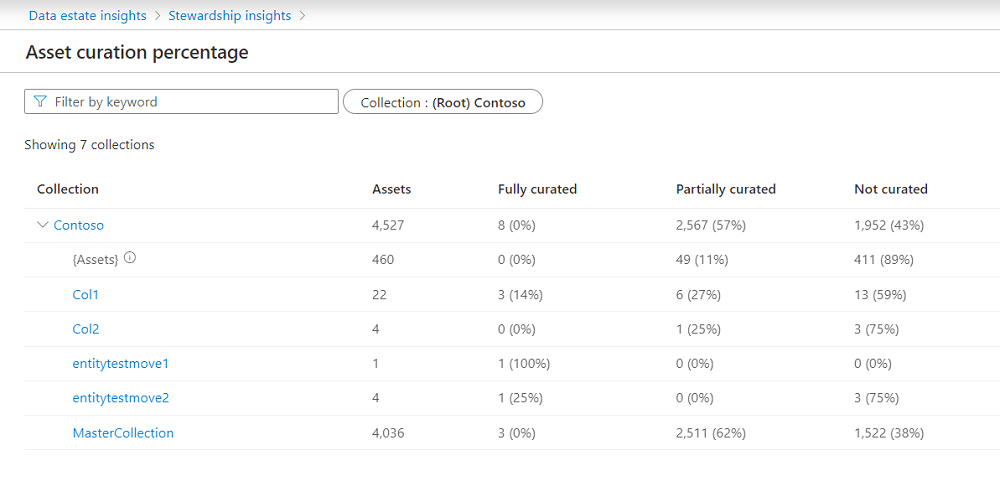
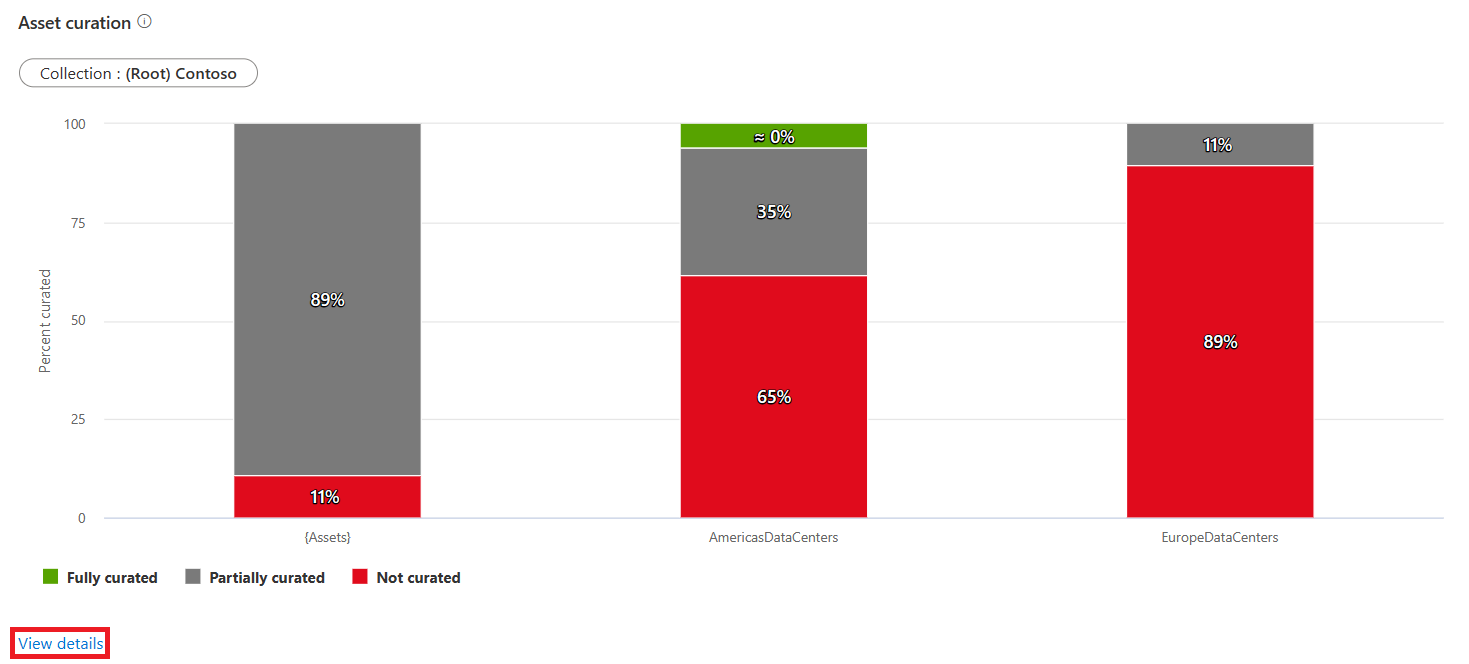
Asset curation
All data assets are categorized into three buckets - Fully curated, Partially curated and Not curated, based on whether assets have been given certain attributes.

An asset is Fully curated if it has at least one classification tag, an assigned data owner, and a description.
If any of these attributes is missing, but not all, then the asset is categorized as Partially curated. If all of them are missing, then it's listed as Not curated.
You can drill down by collection hierarchy.
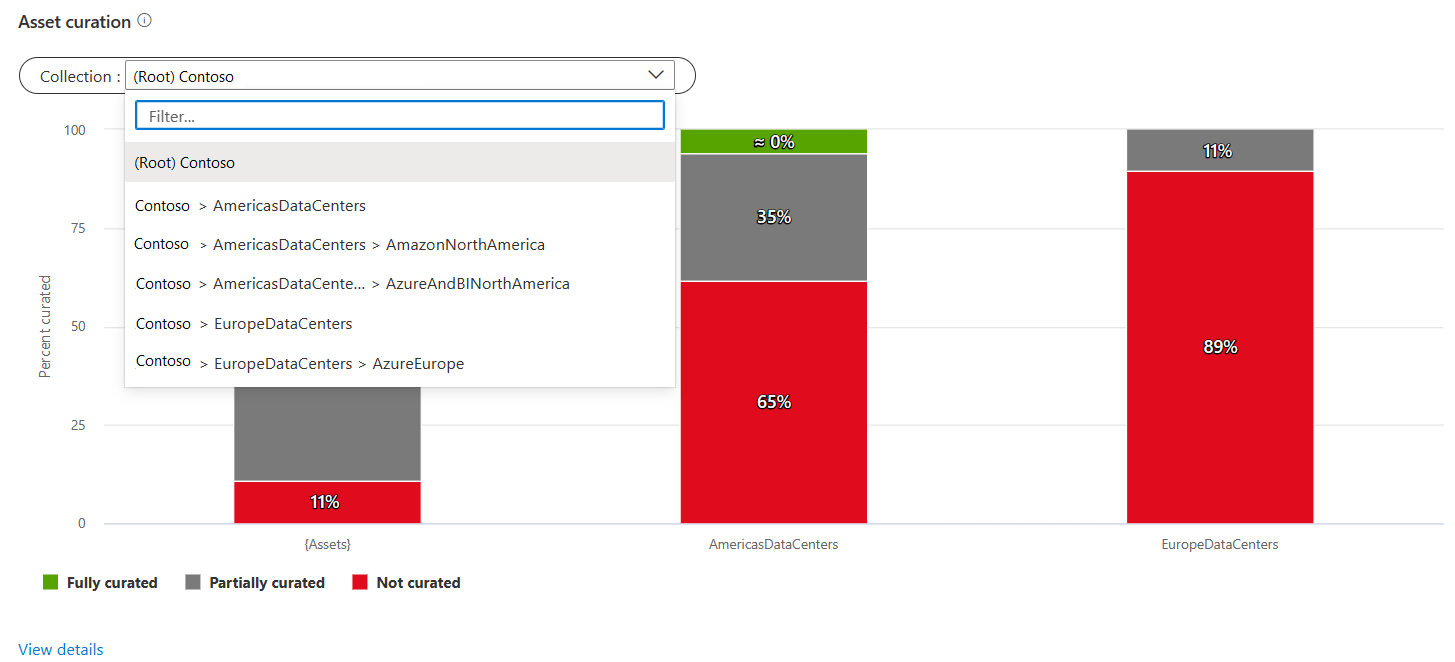
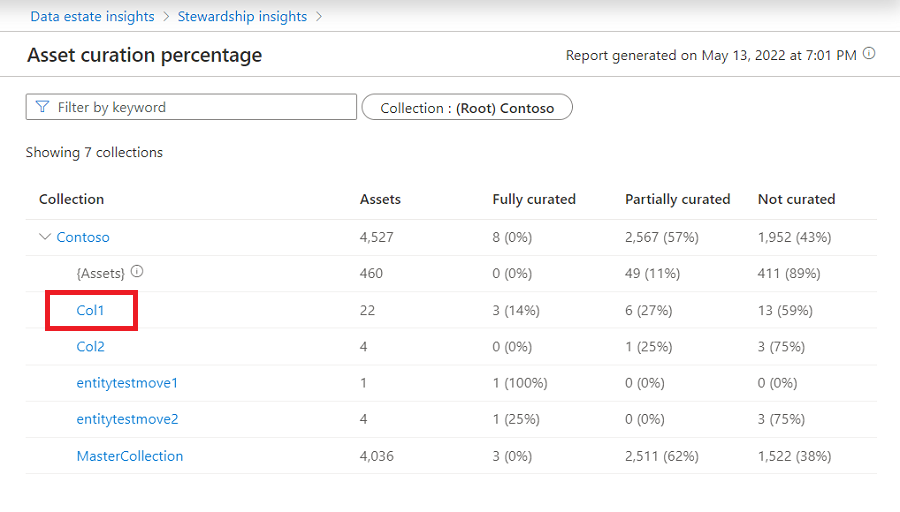
For further information about which assets aren't fully curated, you can select View details link that will take you into the deeper view.
In the View details page, if you select a specific collection, it will list all assets with attribute values or blanks that make up the fully curated assets.
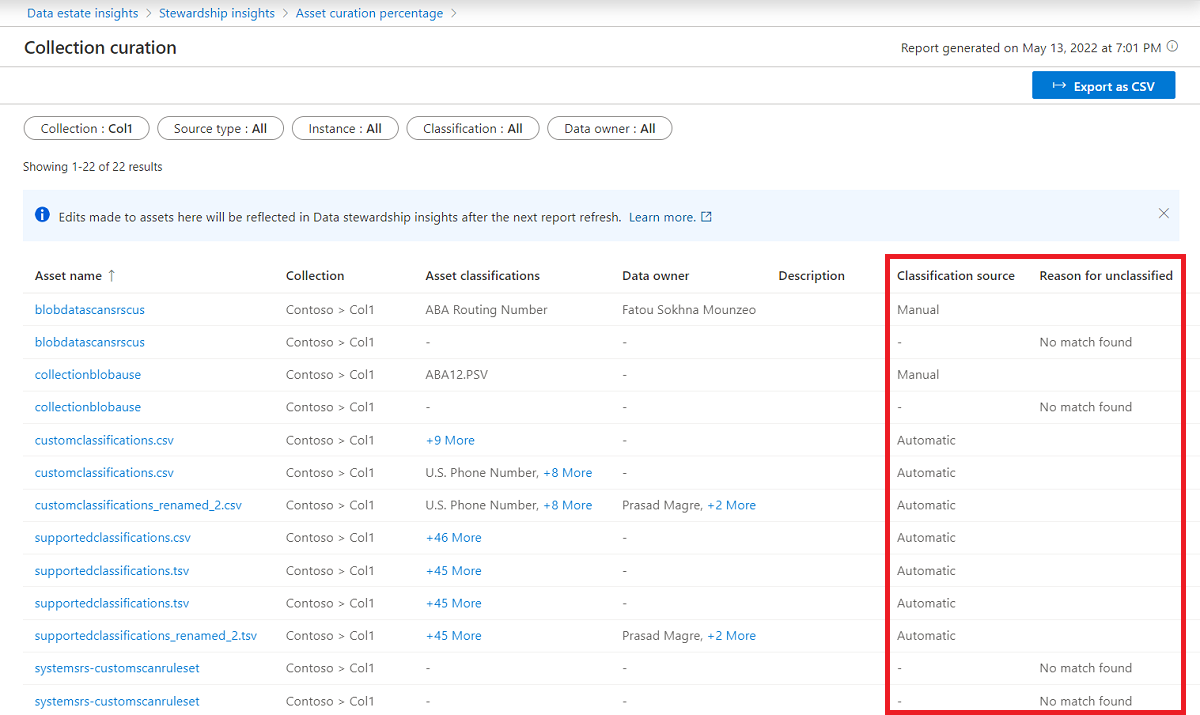
The detail page shows two key pieces of information:
First, it tells you what was the classification source, if the asset is classified. It's Manual if a curator/data owner applied the classification manually. It's Automatic if it was classified during scanning. This page only provides the last applied classification state.
Second, if an asset is unclassified, it tells us why it's not classified, in the column Reasons for unclassified. Currently, Data estate insights can tell one of the following reasons:
- No match found
- Low confidence score
- Not applicable
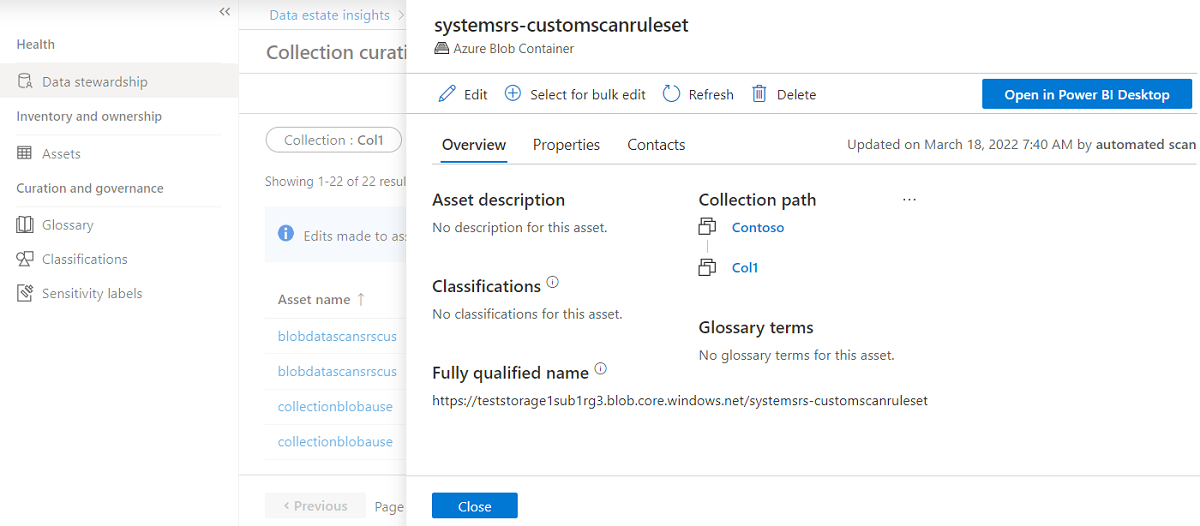
You can select any asset and add missing attributes, without leaving the Data estate insights app.
Trends and gap analysis
This graph shows how the assets and key metrics have been trending over:
- Last 30 days: The graph takes last run of the day or recording of the last run across days as a data point.
- Last six weeks: The graph takes last run of the week where week ends on Sunday. If there was no run on Sunday, then it takes the last recorded run.
- Last 12 months: The graph takes last run of the month.
- Last four quarters: The graph takes last run of the calendar quarter.

Next steps
Learn more about Microsoft Purview Data Estate Insights through:
Feedback
Coming soon: Throughout 2024 we will be phasing out GitHub Issues as the feedback mechanism for content and replacing it with a new feedback system. For more information see: https://aka.ms/ContentUserFeedback.
Submit and view feedback for