Debug an Azure AI Search skillset in Azure portal
Start a portal-based debug session to identify and resolve errors, validate changes, and push changes to a published skillset in your Azure AI Search service.
A debug session is a cached indexer and skillset execution, scoped to a single document, that you can use to edit and test your changes interactively. When you're finished debugging, you can save your changes to the skillset.
For background on how a debug session works, see Debug sessions in Azure AI Search. To practice a debug workflow with a sample document, see Tutorial: Debug sessions.
Prerequisites
An existing enrichment pipeline, including a data source, a skillset, an indexer, and an index.
A Contributor role assignment in the search service.
An Azure Storage account, used to save session state.
A Storage Blob Data Contributor role assignment in Azure Storage if you're using a system managed identity. Otherwise, plan on using a full access connection string for the debug session connection to Azure Storage.
If the Azure Storage account is behind a firewall, configure it to allow search service access.
Limitations
Debug sessions work with all generally available indexer data sources and most preview data sources. The following list notes the exceptions:
Azure Cosmos DB for MongoDB is currently not supported.
For the Azure Cosmos DB for NoSQL, if a row fails during index and there's no corresponding metadata, the debug session might not pick the correct row.
For the SQL API of Azure Cosmos DB, if a partitioned collection was previously non-partitioned, the debug session won't find the document.
For custom skills, a user-assigned managed identity isn't supported for a debug session connection to Azure Storage. As stated in the prerequisites, you can use a system managed identity, or specify a full access connection string that includes a key. For more information, see Connect a search service to other Azure resources using a managed identity.
The portal doesn't support customer-managed key encryption (CMK), which means that portal experiences like debug sessions can't have CMK-encrypted connection strings or other encrypted metadata. If your search service is configured for CMK enforcement, debug sessions won't work.
Create a debug session
Sign in to the Azure portal and find your search service.
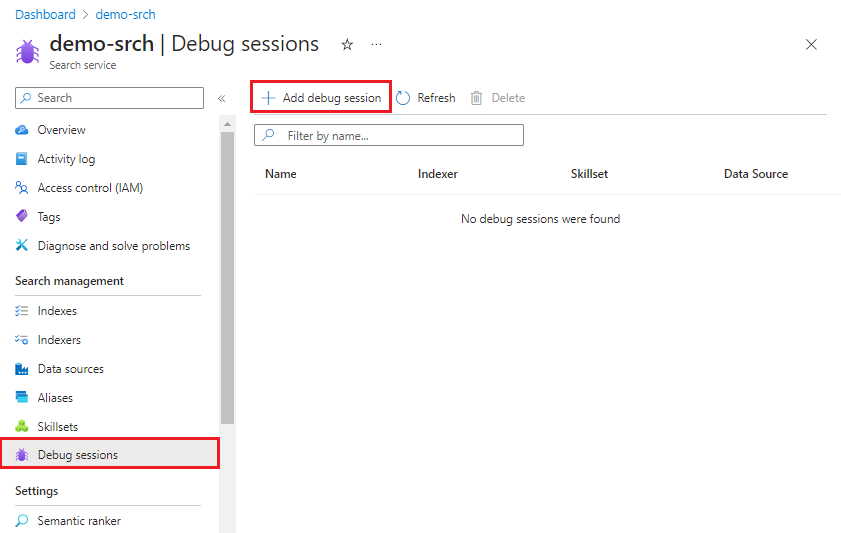
In the left navigation page, select Debug sessions.
In the action bar at the top, select Add debug session.
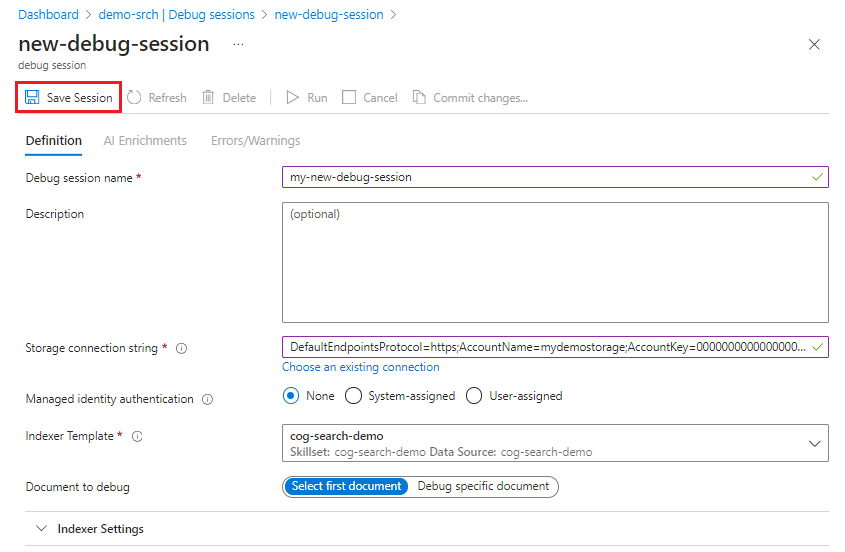
In Debug session name, provide a name that will help you remember which skillset, indexer, and data source the debug session is about.
In Storage connection, find a general-purpose storage account for caching the debug session. You'll be prompted to select and optionally create a blob container in Blob Storage or Azure Data Lake Storage Gen2. You can reuse the same container for all subsequent debug sessions you create. A helpful container name might be "cognitive-search-debug-sessions".
In Managed identity authentication, choose None if the connection to Azure Storage doesn't use a managed identity. Otherwise, choose the managed identity to which you've granted Storage Blob Data Contributor permissions.
In Indexer template, select the indexer that drives the skillset you want to debug. Copies of both the indexer and skillset are used to initialize the session.
In Document to debug, choose the first document in the index or select a specific document. If you select a specific document, depending on the data source, you're asked for a URI or a row ID.
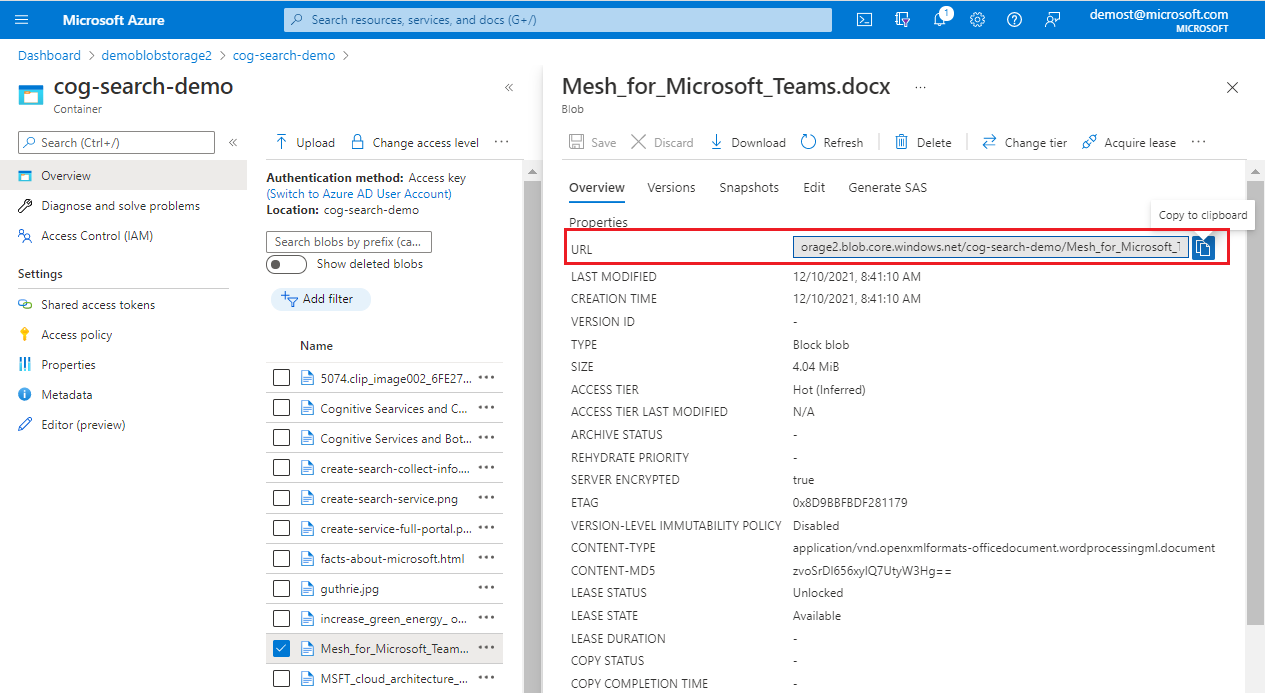
If your specific document is a blob, provide the blob URI. You can find the URI in the blob property page in the portal.
Optionally, in Indexer settings, specify any indexer execution settings used to create the session. The settings should mimic the settings used by the actual indexer. Any indexer options that you specify in a debug session have no effect on the indexer itself.
Your configuration should look similar to this screenshot. Select Save session to get started.
The debug session begins by executing the indexer and skillset on the selected document. The document's content and metadata created will be visible and available in the session.
A debug session can be canceled while it's executing using the Cancel button. If you hit the Cancel button you should be able to analyze partial results.
It's expected for a debug session to take longer to execute than the indexer since it goes through extra processing.
Start with errors and warnings
Indexer execution history in the portal gives you the full error and warning list for all documents. In a debug session, the errors and warnings will be limited to one document. You'll work through this list, make your changes, and then return to the list to verify whether issues are resolved.
To view the messages, select a skill in AI Enrichment > Skill Graph and then select Errors/Warnings in the details pane.
As a best practice, resolve problems with inputs before moving on to outputs.
To prove whether a modification resolves an error, follow these steps:
Select Save in the skill details pane to preserve your changes.
Select Run in the session window to invoke skillset execution using the modified definition.
Return to Errors/Warnings to see if the count is reduced. The list won't be refreshed until you open the tab.
View content of enrichment nodes
AI enrichment pipelines extract or infer information and structure from source documents, creating an enriched document in the process. An enriched document is first created during document cracking and populated with a root node (/document), plus nodes for any content that is lifted directly from the data source, such as metadata and the document key. More nodes are created by skills during skill execution, where each skill output adds a new node to the enrichment tree.
Enriched documents are internal, but a debug session gives you access to the content produced during skill execution. To view the content or output of each skill, follow these steps:
Start with the default views: AI enrichment > Skill Graph, with the graph type set to Dependency Graph.
Select a skill.
In the details pane to the right, select Executions, select an OUTPUT, and then open the Expression Evaluator (
</>) to view the expression and its result.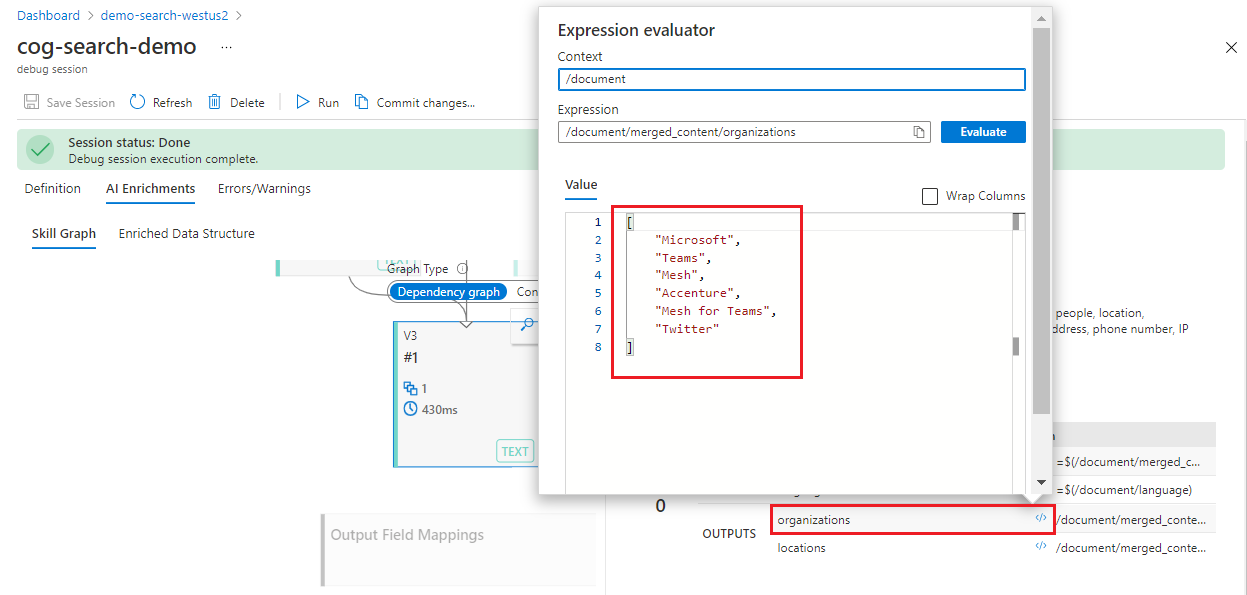
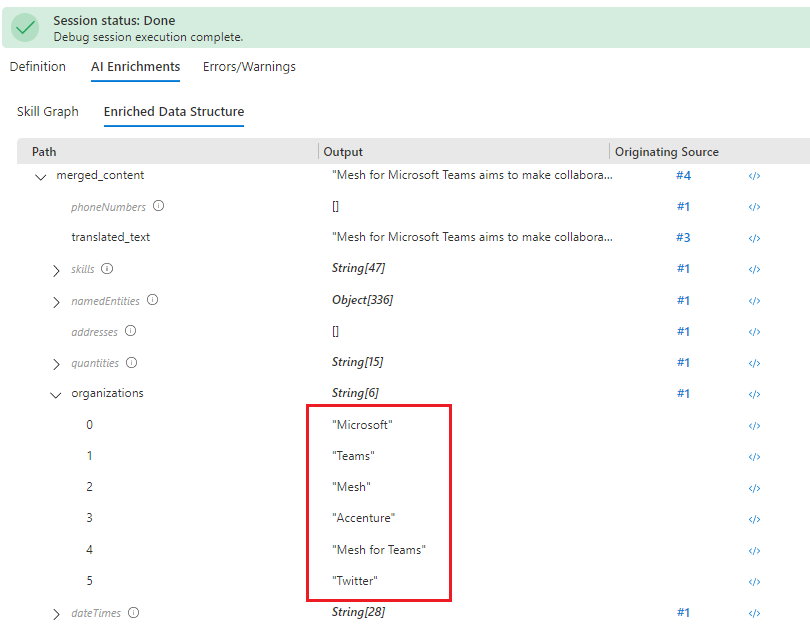
Alternatively, open AI enrichment > Enriched Data Structure to scroll down the list of nodes. The list includes potential and actual nodes, with a column for output, and another column that indicates the upstream object used to produce the output.
Edit skill definitions
If the field mappings are correct, check individual skills for configuration and content. If a skill fails to produce output, it might be missing a property or parameter, which can be determined through error and validation messages.
Other issues, such as an invalid context or input expression, can be harder to resolve because the error will tell you what is wrong, but not how to fix it. For help with context and input syntax, see Reference enrichments in an Azure AI Search skillset. For help with individual messages, see Troubleshooting common indexer errors and warnings.
The following steps show you how to get information about a skill.
In AI enrichment > Skill Graph, select a skill. The Skill Details pane opens to the right.
Edit a skill definition using either approach:
- Skill Settings if you prefer a visual editor
- Skill JSON Editor to edit the JSON document directly
Check the path syntax for referencing nodes in an enrichment tree. Following are some of the most common input paths:
/document/contentfor chunks of text. This node is populated from the blob's content property./document/merged_contentfor chunks of text in skillets that include Text Merge skill./document/normalized_images/*for text that is recognized or inferred from images.
Check field mappings
If skills produce output but the search index is empty, check the field mappings. Field mappings specify how content moves out of the pipeline and into a search index.
Start with the default views: AI enrichment > Skill Graph, with the graph type set to Dependency Graph.
Select Field Mappings near the top. You should find at least the document key that uniquely identifies and associates each search document in the search index with its source document in the data source.
If you're importing raw content straight from the data source, bypassing enrichment, you should find those fields in Field Mappings.
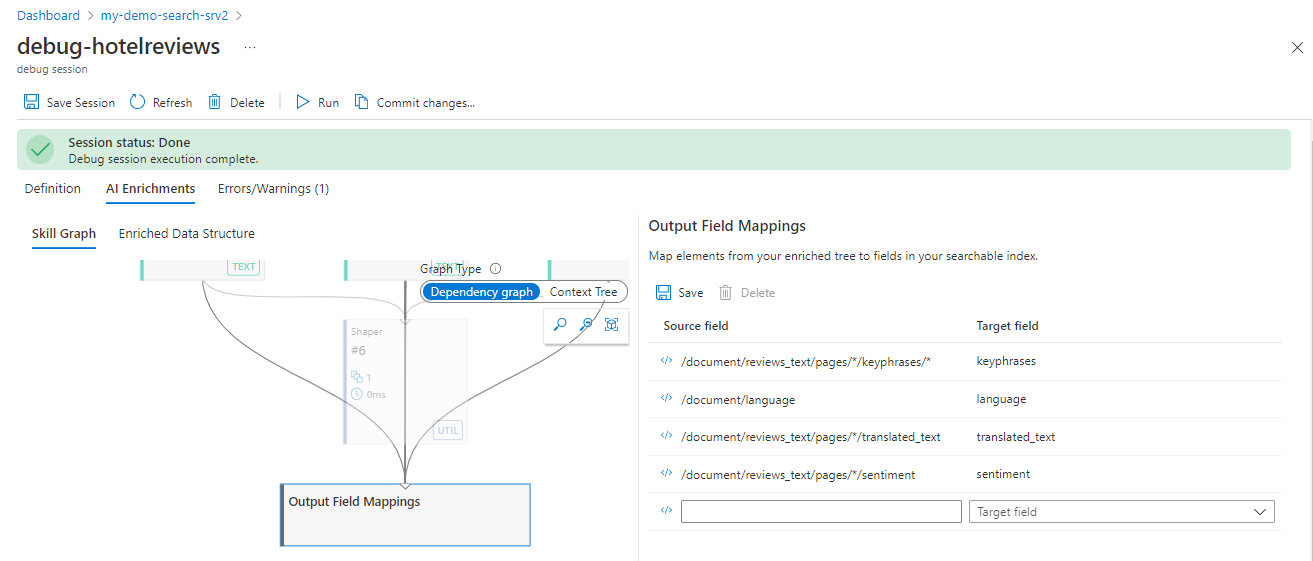
Select Output Field Mappings at the bottom of the graph. Here you'll find mappings from skill outputs to target fields in the search index. Unless you used the Import Data wizard, output field mappings are defined manually and could be incomplete or mistyped.
Verify that the fields in Output Field Mappings exist in the search index as specified, checking for spelling and enrichment node path syntax.
Debug a custom skill locally
Custom skills can be more challenging to debug because the code runs externally, so the debug session can't be used to debug them. This section describes how to locally debug your Custom Web API skill, debug session, Visual Studio Code and ngrok or Tunnelmole. This technique works with custom skills that execute in Azure Functions or any other Web Framework that runs locally (for example, FastAPI).
Get a public URL
Using Tunnelmole
Tunnelmole is an open source tunneling tool that can create a public URL that forwards requests to your local machine through a tunnel.
Install Tunnelmole:
- npm:
npm install -g tunnelmole - Linux:
curl -s https://tunnelmole.com/sh/install-linux.sh | sudo bash - Mac:
curl -s https://tunnelmole.com/sh/install-mac.sh --output install-mac.sh && sudo bash install-mac.sh - Windows: Install by using npm. Or if you don't have NodeJS installed, download the precompiled .exe file for Windows and put it somewhere in your PATH.
- npm:
Run this command to create a new tunnel:
tmole 7071You should see a response that looks like this:
http://m5hdpb-ip-49-183-170-144.tunnelmole.net is forwarding to localhost:7071
https://m5hdpb-ip-49-183-170-144.tunnelmole.net is forwarding to localhost:7071
In the preceding example,
https://m5hdpb-ip-49-183-170-144.tunnelmole.netforwards to port7071on your local machine, which is the default port where Azure functions are exposed.
Using ngrok
ngrok is a popular, closed source, cross-platform application that can create a tunneling or forwarding URL, so that internet requests reach your local machine. Use ngrok to forward requests from an enrichment pipeline in your search service to your machine to allow local debugging.
Install ngrok.
Open a terminal and go to the folder with the ngrok executable.
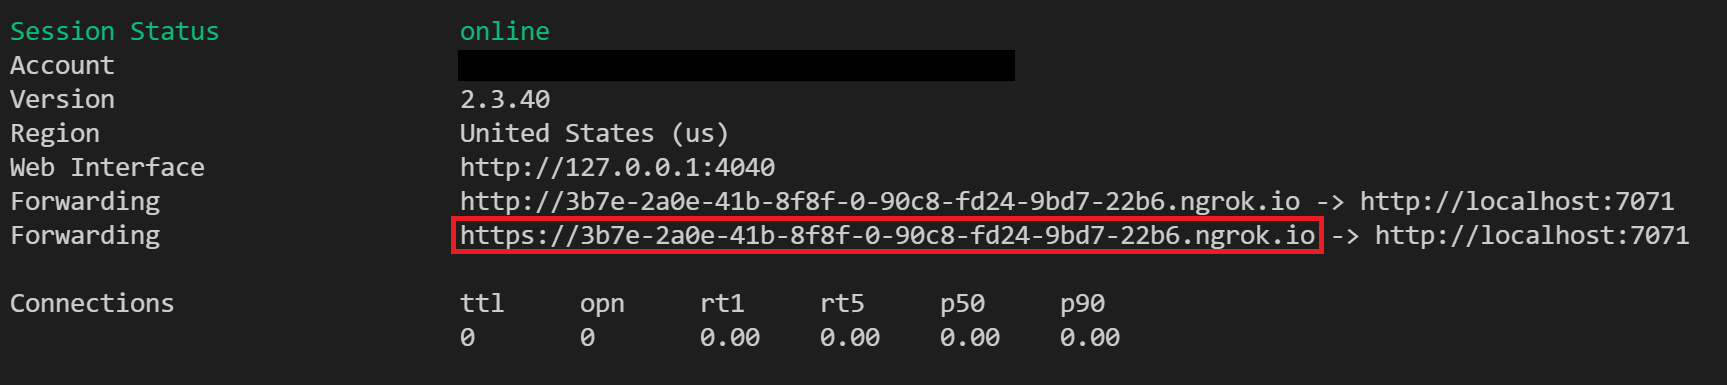
Run ngrok with the following command to create a new tunnel:
ngrok http 7071Note
By default, Azure functions are exposed on 7071. Other tools and configurations might require that you provide a different port.
When ngrok starts, copy and save the public forwarding URL for the next step. The forwarding URL is randomly generated.
Configure in Azure portal
Within the debug session, modify your Custom Web API Skill URI to call the Tunnelmole or ngrok forwarding URL. Ensure that you append "/api/FunctionName" when using Azure Function for executing the skillset code.
You can edit the skill definition in the portal.
Test your code
At this point, new requests from your debug session should now be sent to your local Azure Function. You can use breakpoints in your Visual Studio Code to debug your code or run step by step.
Next steps
Now that you understand the layout and capabilities of the Debug Sessions visual editor, try the tutorial for a hands-on experience.
Feedback
Coming soon: Throughout 2024 we will be phasing out GitHub Issues as the feedback mechanism for content and replacing it with a new feedback system. For more information see: https://aka.ms/ContentUserFeedback.
Submit and view feedback for