Use the Linux diagnostic extension 4.0 to monitor metrics and logs
Caution
This article references CentOS, a Linux distribution that is nearing End Of Life (EOL) status. Please consider your use and plan accordingly. For more information, see the CentOS End Of Life guidance.
This article describes the latest versions of the Linux diagnostic extension (LAD).
Important
For information about version 3.x, see Use the Linux diagnostic extension 3.0 to monitor metrics and logs. For information about version 2.3 and earlier, see Monitor the performance and diagnostic data of a Linux VM.
The Linux diagnostic extension helps you monitor the health of a Linux VM on Microsoft Azure. It has the following capabilities:
| Data source | Customization options | Required destinations | Optional destinations |
|---|---|---|---|
| Metrics | Counter, Aggregation, Sample Rate, Specifiers | Azure Table Storage | EventHub, Azure Blob Storage (JSON format), Azure Monitor (new in LAD 4.0) |
| Syslog | Facility, Severity Level | Azure Table Storage | EventHub, Azure Blob Storage (JSON Format) |
| Files | Log Path, Destination Table | Azure Table Storage | EventHub, Azure Blob Storage (JSON Format) |
This extension works with both Azure deployment models: Azure Resource Manager and classic.
Prerequisites
- Azure Linux agent version 2.2.0 or later. Most Azure VM Linux gallery images include version 2.2.7 or later. Run
/usr/sbin/waagent -versionto confirm the version installed on the VM. If the VM runs an older version of the guest agent, update the Linux agent. - Azure CLI. Set up the Azure CLI environment on your machine.
- The
wgetcommand. If you don't already have it, install it using the corresponding package manager. - An Azure subscription and general purpose storage account to store the data. General purpose storage accounts support table storage, which is required. A blob storage account doesn't work.
- Python 2.
Supported Linux distributions
See Supported agent operating systems.
Python requirement
The Linux diagnostic extension requires Python 2. If your virtual machine uses a distribution that doesn't include Python 2, install it.
Note
We are currently planning to converge all versions of the Linux Diagnostic Extensions (LAD) with the new Azure Monitoring Agent, which already supports Python 3. The LAD will be scheduled for deprecation pending announcement and approval.
To install Python 2, run one of the following sample commands:
- Red Hat, CentOS, Oracle:
yum install -y python2 - Ubuntu, Debian:
apt-get install -y python2 - SUSE:
zypper install -y python2
The python2 executable file must be aliased to python.
Run the following command to remove any existing aliases.
sudo update-alternatives --remove-all pythonRun the following command to create the new alias.
sudo update-alternatives --install /usr/bin/python python /usr/bin/python2 1
Install the extension
You can enable this extension for your VM and Virtual Machine Scale Set by using the Azure PowerShell cmdlets, Azure CLI scripts, Azure Resource Manager templates (ARM templates), or the Azure portal. For more information, see Virtual machine extensions and features for Linux.
Note
Some components of the Linux Diagnostic VM extension are also shipped in the Log Analytics VM extension. Conflicts can arise if both extensions are instantiated in the same ARM template.
To avoid install-time conflicts, use the dependsOn directive to install the extensions sequentially. The extensions can be installed in either order.
Use the installation instructions and a downloadable sample configuration to configure LAD 4.0 to:
- Capture and store the same metrics that LAD versions 2.3 and 3.x provided.
- Send metrics to the Azure Monitor sink along with the usual sink to Azure Storage. This functionality is new in LAD 4.0.
- Capture a useful set of file system metrics, as in LAD 3.0.
- Capture the default syslog collection enabled by LAD 2.3.
- Enable the Azure portal experience for charting and alerting on VM metrics.
The downloadable configuration is just an example. Modify it to suit your needs.
Installation
You can install and configure LAD 4.0 in the Azure CLI or in Azure PowerShell.
If your protected settings are in the file ProtectedSettings.json and your public configuration information is in PublicSettings.json, run this command:
az vm extension set --publisher Microsoft.Azure.Diagnostics \
  --name LinuxDiagnostic --version 4.0 --resource-group <resource_group_name> \
  --vm-name <vm_name> --protected-settings ProtectedSettings.json \
  --settings PublicSettings.json
The command assumes that you're using the Azure Resource Management mode of the Azure CLI. To configure LAD for classic deployment model VMs, switch to Service Management mode (azure config mode asm) and omit the resource group name in the command.
For more information, see the cross-platform CLI documentation.
Enable auto update
To enable automatic update of the agent, we recommend that you enable the Automatic Extension Upgrade feature:
az vm extension set --publisher Microsoft.Azure.Diagnostics --name LinuxDiagnostic \
  --version 4.0 --resource-group <resource_group_name> --vm-name <vm_name> \
  --protected-settings ProtectedSettings.json --settings PublicSettings.json \
  --enable-auto-upgrade true
Sample installation
In these examples, the sample configuration collects a set of standard data and sends it to table storage. The URL for the sample configuration and its contents can change.
Note
For the following samples, fill in the appropriate values for the variables in the first section before you run the code.
In most cases, you should download a copy of the portal settings JSON file and customize it for your needs. Use templates or your own automation to use a customized version of the configuration file rather than downloading from the URL each time.
When you enable the new Azure Monitor sink, the VMs need to have system-assigned identity enabled to generate Managed Service Identity (MSI) authentication tokens. You can add these settings during or after VM creation. For instructions for the Azure portal, the Azure CLI, PowerShell, and Azure Resource Manager, see Configure managed identities.
Installation sample - Azure CLI
# Set your Azure VM diagnostic variables.
my_subscription_id=<your_azure_subscription_id>
my_resource_group=<your_azure_resource_group_name_containing_your_azure_linux_vm>
my_linux_vm=<your_azure_linux_vm_name>
my_diagnostic_storage_account=<your_azure_storage_account_for_storing_vm_diagnostic_data>

# Login to Azure before you do anything else.
az login

# Select the subscription that contains the storage account.
az account set --subscription $my_subscription_id

# Enable system-assigned identity on the existing VM.
az vm identity assign --resource-group $my_resource_group --name $my_linux_vm

# Download the sample public settings. You could instead use curl or any web browser.
wget https://raw.githubusercontent.com/Azure/azure-linux-extensions/master/Diagnostic/tests/lad_2_3_compatible_portal_pub_settings.json -O portal_public_settings.json

# Build the VM resource ID. Replace the storage account name and resource ID in the public settings.
my_vm_resource_id=$(az vm show --resource-group $my_resource_group \
  --name $my_linux_vm --query "id" -o tsv)
sed -i "s#__DIAGNOSTIC_STORAGE_ACCOUNT__#$my_diagnostic_storage_account#g" portal_public_settings.json
sed -i "s#__VM_RESOURCE_ID__#$my_vm_resource_id#g" portal_public_settings.json

# Build the protected settings (storage account SAS token).
my_diagnostic_storage_account_sastoken=$(az storage account generate-sas \
  --account-name $my_diagnostic_storage_account --expiry 2037-12-31T23:59:00Z \
  --permissions wlacu --resource-types co --services bt -o tsv)
my_lad_protected_settings="{'storageAccountName': '$my_diagnostic_storage_account', \
  'storageAccountSasToken': '$my_diagnostic_storage_account_sastoken'}"

# Finally, tell Azure to install and enable the extension.
az vm extension set --publisher Microsoft.Azure.Diagnostics --name LinuxDiagnostic \
  --version 4.0 --resource-group $my_resource_group --vm-name $my_linux_vm \
  --protected-settings "${my_lad_protected_settings}" --settings portal_public_settings.json
Installation sample for Virtual Machine Scale Sets - Azure CLI
# Set your Azure virtual machine scale set diagnostic variables.
my_subscription_id=<your_azure_subscription_id>
my_resource_group=<your_azure_resource_group_name_containing_your_azure_linux_vm>
my_linux_vmss=<your_azure_linux_vmss_name>
my_diagnostic_storage_account=<your_azure_storage_account_for_storing_vm_diagnostic_data>

# Login to Azure before you do anything else.
az login

# Select the subscription that contains the storage account.
az account set --subscription $my_subscription_id

# Enable system-assigned identity on the existing virtual machine scale set.
az vmss identity assign --resource-group $my_resource_group --name $my_linux_vmss

# Download the sample public settings. You could also use curl or any web browser.
wget https://raw.githubusercontent.com/Azure/azure-linux-extensions/master/Diagnostic/tests/lad_2_3_compatible_portal_pub_settings.json -O portal_public_settings.json

# Build the virtual machine scale set resource ID. Replace the storage account name and resource ID in the public settings.
my_vmss_resource_id=$(az vmss show --resource-group $my_resource_group \
  --name $my_linux_vmss --query "id" -o tsv)
sed -i "s#__DIAGNOSTIC_STORAGE_ACCOUNT__#$my_diagnostic_storage_account#g" portal_public_settings.json
sed -i "s#__VM_RESOURCE_ID__#$my_vmss_resource_id#g" portal_public_settings.json

# Build the protected settings (storage account SAS token).
my_diagnostic_storage_account_sastoken=$(az storage account generate-sas \
  --account-name $my_diagnostic_storage_account --expiry 2037-12-31T23:59:00Z \
  --permissions wlacu --resource-types co --services bt -o tsv)
my_lad_protected_settings="{'storageAccountName': '$my_diagnostic_storage_account', 'storageAccountSasToken': '$my_diagnostic_storage_account_sastoken'}"

# Finally, tell Azure to install and enable the extension.
az vmss extension set --publisher Microsoft.Azure.Diagnostics --name LinuxDiagnostic
  --version 4.0 --resource-group $my_resource_group --vmss-name $my_linux_vmss \
  --protected-settings "${my_lad_protected_settings}" --settings portal_public_settings.json
Update the extension settings
After you change your protected or public settings, run the same command to deploy them to the VM. If any settings changed, the updates are sent to the extension. LAD reloads the configuration and restarts itself.
Migrate from previous versions of the extension
The latest version of the extension is 4.0, which is currently in public preview. Older versions of 3.x are still supported. 2.x versions have been deprecated since July 31, 2018.
Important
To migrate from 3.x to the newest version of the extension, uninstall the old extension. Then install version 4, which includes the updated configuration for system-assigned identity and sinks for sending metrics to the Azure Monitor sink.
When you install the new extension, enable automatic minor version upgrades:
- On Azure Resource Manager deployment model VMs, include
"autoUpgradeMinorVersion": truein the VM deployment template. - On classic deployment model VMs, specify version
4.*if you're installing the extension through the Azure CLI or PowerShell.
You can use the same storage account you used for LAD 3.x.
Protected settings
This set of configuration information contains sensitive information that should be protected from public view. It contains, for example, storage credentials. The settings are transmitted to the extension, which stores them in encrypted form.
{
    "storageAccountName" : "the storage account to receive data",
    "storageAccountEndPoint": "the hostname suffix for the cloud for this account",
    "storageAccountSasToken": "SAS access token",
    "mdsdHttpProxy": "HTTP proxy settings",
    "sinksConfig": { ... }
}
| Name | Value |
|---|---|
| storageAccountName | The name of the storage account in which the extension writes data. |
| storageAccountEndPoint | (Optional) The endpoint that identifies the cloud in which the storage account exists. If this setting is absent, by default, LAD uses the Azure public cloud, https://core.windows.net. To use a storage account in Azure Germany, Azure Government, or Microsoft Azure operated by 21Vianet, set this value as required. |
| storageAccountSasToken | An Account SAS token for blob and table services (ss='bt'). This token applies to containers and objects (srt='co'). It grants add, create, list, update, and write permissions (sp='acluw'). Do not include the leading question-mark (?). |
| mdsdHttpProxy | (Optional) HTTP proxy information the extension needs to connect to the specified storage account and endpoint. |
| sinksConfig | (Optional) Details of alternative destinations to which metrics and events can be delivered. The following sections provide details about each data sink the extension supports. |
To get a SAS token within an ARM template, use the listAccountSas function. For an example template, see List function example.
You can construct the required shared access signature token through the Azure portal:
- Select the general-purpose storage account to which you want the extension to write.
- In the menu on the left, under Security + networking, select Shared access signature.
- Make the selections as previously described.
- Select Generate SAS and connection string.
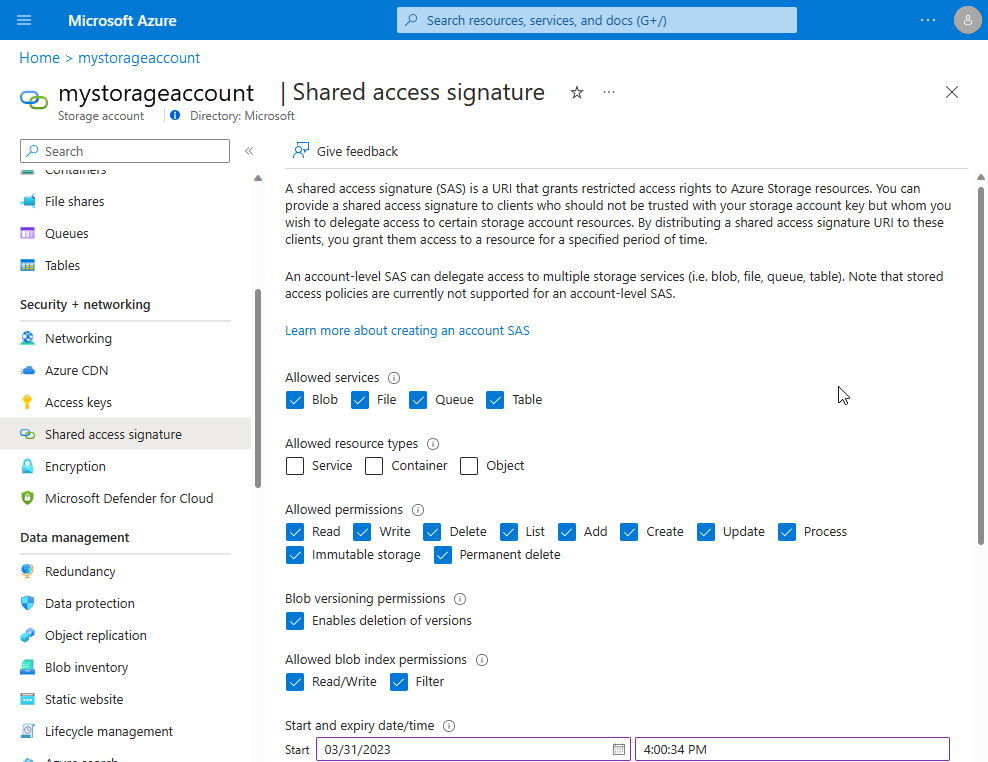
Copy the generated shared access signature into the storageAccountSasToken field. Remove the leading question mark (?).
sinksConfig
Note
Both public and protected settings have an optional sinksConfig section. The sinksConfig section in the protected settings only holds EventHub and JsonBlob sink configurations, due to the inclusion of secrets like sasURLs. AzMonSink sink configurations cannot be included in your protected settings.
"sinksConfig": {
    "sink": [
        {
            "name": "sinkname",
            "type": "sinktype",
            ...
        },
        ...
    ]
},
The sinksConfig optional section defines more destinations to which the extension sends collected information. The "sink" array contains an object for each extra data sink. The "type" attribute determines the other attributes in the object.
| Element | Value |
|---|---|
| name | A string used to refer to this sink elsewhere in the extension configuration. |
| type | The type of sink being defined. Determines the other values, if any, in instances of this type. |
The Linux diagnostic extension 4.0 supports two protected sink types: EventHub and JsonBlob.
EventHub sink
"sink": [
    {
        "name": "sinkname",
        "type": "EventHub",
        "sasURL": "https SAS URL"
    },
    ...
]
The "sasURL" entry contains the full URL, including the shared access signature token, for the event hub to which data should be published. LAD requires a shared access signature to name a policy that enables the send claim. Here's an example:
- Create an Event Hubs namespace called
contosohub. - Create an event hub in the namespace called
syslogmsgs. - Create a shared access policy on the event hub named
writerthat enables the send claim.
If you create a SAS that's good until midnight UTC on January 1, 2018, the sasURL value might be like the following example.
https://contosohub.servicebus.windows.net/syslogmsgs?sr=contosohub.servicebus.windows.net%2fsyslogmsgs&sig=xxxxxxxxxxxxxxxxxxxxxxxxx&se=1514764800&skn=writer
For more information about generating and retrieving information on SAS tokens for Event Hubs, see Generate a SAS token.
JsonBlob sink
"sink": [
    {
        "name": "sinkname",
        "type": "JsonBlob"
    },
    ...
]
Data directed to a JsonBlob sink is stored in blobs in Azure Storage. Each instance of LAD creates a blob every hour for each sink name. Each blob always contains a syntactically valid JSON array of objects. New entries are atomically added to the array.
Blobs are stored in a container that has the same name as the sink. The Azure Storage rules for blob container names apply to the names of JsonBlob sinks. Names must have between 3 and 63 lowercase alphanumeric ASCII characters or dashes.
Public settings
The public settings structure contains various blocks of settings that control the information that the extension collects. Each setting, except ladCfg, is optional. If you specify metric or syslog collection in ladCfg, you must also specify StorageAccount. You must specify the sinksConfig element to enable the Azure Monitor sink for metrics from LAD 4.0.
{
    "ladCfg":  { ... },
    "fileLogs": { ... },
    "StorageAccount": "the storage account to receive data",
    "sinksConfig": { ... },
    "mdsdHttpProxy" : ""
}
| Element | Value |
|---|---|
| StorageAccount | The name of the storage account in which the extension writes data. Must be the name specified in the protected settings. |
| mdsdHttpProxy | (Optional) The proxy specified in the protected settings. If the private value is set, it overrides the public value. Put proxy settings that contain a secret, such as a password, in the protected settings. |
The following sections provide details about the remaining elements.
ladCfg
"ladCfg": {
    "diagnosticMonitorConfiguration": {
        "eventVolume": "Medium",
        "metrics": { ... },
        "performanceCounters": { ... },
        "syslogEvents": { ... }
    },
    "sampleRateInSeconds": 15
}
The ladCfg structure controls the gathering of metrics and logs for delivery to the Azure Monitor Metrics service and to other data sinks. Specify either performanceCounters or syslogEvents or both. Also specify the metrics structure.
If you don't want to enable syslog or metrics collection, specify an empty structure for the ladCfg element:
"ladCfg": {
    "diagnosticMonitorConfiguration": {}
}
| Element | Value |
|---|---|
| eventVolume | (Optional) Controls the number of partitions created within the storage table. The value must be "Large", "Medium", or "Small". The default value is "Medium". |
| sampleRateInSeconds | (Optional) The default interval between the collection of raw, that is, unaggregated, metrics. The smallest supported sample rate is 15 seconds. The default is 15. |
metrics
"metrics": {
    "resourceId": "/subscriptions/...",
    "metricAggregation" : [
        { "scheduledTransferPeriod" : "PT1H" },
        { "scheduledTransferPeriod" : "PT5M" }
    ]
}
| Element | Value |
|---|---|
| resourceId | The Azure Resource Manager resource ID of the VM or of the Virtual Machine Scale Set to which the VM belongs. Also specify this setting if the configuration uses any JsonBlob sink. |
| scheduledTransferPeriod | The frequency at which aggregate metrics are computed and transferred to Azure Monitor Metrics. The frequency is expressed as an IS 8601 time interval. The smallest transfer period is 60 seconds, that is, PT1M. Specify at least one scheduledTransferPeriod. |
Samples of the metrics specified in the performanceCounters section are collected every 15 seconds or at the sample rate explicitly defined for the counter. If multiple scheduledTransferPeriod frequencies appear, as in the example, each aggregation is computed independently.
performanceCounters
"performanceCounters": {
    "sinks": "",
    "performanceCounterConfiguration": [
        {
            "type": "builtin",
            "class": "Processor",
            "counter": "PercentIdleTime",
            "counterSpecifier": "/builtin/Processor/PercentIdleTime",
            "condition": "IsAggregate=TRUE",
            "sampleRate": "PT15S",
            "unit": "Percent",
            "annotation": [
                {
                    "displayName" : "cpu idle time",
                    "locale" : "en-us"
                }
            ]
        }
    ]
}
The performanceCounters optional section controls the collection of metrics. Raw samples are aggregated for each scheduledTransferPeriod to produce these values:
- Mean
- Minimum
- Maximum
- Last-collected value
- Count of raw samples used to compute the aggregate
| Element | Value |
|---|---|
| sinks | (Optional) A comma-separated list of names of sinks to which LAD sends aggregated metric results. All aggregated metrics are published to each listed sink. For example, "MyEventHubSink, MyJsonSink, MyAzMonSink". For more information, see sinksConfig (protected settings) and sinksConfig (public settings). |
| type | Identifies the actual provider of the metric. |
| class | Together with "counter", identifies the specific metric within the provider's namespace. |
| counter | Together with "class", identifies the specific metric within the provider's namespace. See a list of available counters. |
| counterSpecifier | Identifies the metric within the Azure Monitor Metrics namespace. |
| condition | (Optional) Selects an instance of the object to which the metric applies. Or selects the aggregation across all instances of that object. |
| sampleRate | The IS 8601 interval that sets the rate at which raw samples for this metric are collected. If the value isn't set, the value of sampleRateInSeconds sets the collection interval. The shortest supported sample rate is 15 seconds (PT15S). |
| unit | Defines the unit for the metric. Should be one of these strings: "Count", "Bytes", "Seconds", "Percent", "CountPerSecond", "BytesPerSecond", "Millisecond". Consumers of the collected data expect the collected data values to match this unit. LAD ignores this field. |
| displayName | The label to attach to the data in Azure Monitor Metrics when viewing in the Guest (classic) metrics namespace. This label is in the language specified by the associated locale setting. LAD ignores this field. Note: If viewing the same metric in the azure.vm.linux.guestmetrics Metrics Namespace, which is available if AzMonSink is configured, the display name depends entirely on the counter. To find the mapping between counters and names, see Metrics supported by the builtin provider. |
The counterSpecifier is an arbitrary identifier. Consumers of metrics, like the Azure portal charting and alerting feature, use counterSpecifier as the key that identifies a metric or an instance of a metric.
For builtin metrics, we recommend counterSpecifier values that begin with /builtin/. To collect a specific instance of a metric, attach the identifier of the instance to the counterSpecifier value. Here are some examples:
/builtin/Processor/PercentIdleTime. Idle time averaged across all vCPUs/builtin/Disk/FreeSpace(/mnt). Free space for the/mntfile system/builtin/Disk/FreeSpace. Free space averaged across all mounted file systems
LAD and the Azure portal don't expect the counterSpecifier value to match any pattern. Be consistent in how you construct counterSpecifier values.
When you specify performanceCounters, LAD always writes data to a table in Azure Storage. The same data can be written to JSON blobs or Event Hubs or both. You can't disable storing data to a table.
All instances of LAD that use the same storage account name and endpoint add their metrics and logs to the same table. If too many VMs write to the same table partition, Azure can throttle writes to that partition.
The eventVolume setting causes entries to be spread across 1 (small), 10 (medium), or 100 (large) partitions. Usually, medium partitions are sufficient to avoid traffic throttling.
The Azure Monitor Metrics feature of the Azure portal uses the data in this table to produce graphs or to trigger alerts. The table name is the concatenation of these strings:
WADMetrics- The
"scheduledTransferPeriod"for the aggregated values stored in the table P10DV2S- A date, in the form YYYYMMDD, which changes every 10 days
Examples include WADMetricsPT1HP10DV2S20170410 and WADMetricsPT1MP10DV2S20170609.
syslogEvents
"syslogEvents": {
    "sinks": "",
    "syslogEventConfiguration": {
        "facilityName1": "minSeverity",
        "facilityName2": "minSeverity",
        ...
    }
}
The syslogEvents optional section controls the collection of log events from syslog. If the section is omitted, syslog events aren't captured at all.
The syslogEventConfiguration collection has one entry for each syslog facility of interest. If minSeverity is "NONE" for a particular facility, or if that facility doesn't appear in the element at all, no events from that facility are captured.
| Element | Value |
|---|---|
| sinks | A comma-separated list of names of sinks to which individual log events are published. All log events that match the restrictions in syslogEventConfiguration are published to each listed sink. Example: "EHforsyslog" |
| facilityName | A syslog facility name, such as "LOG_USER" or "LOG_LOCAL0". For more information, see Values for facility in the syslog manual page. |
| minSeverity | A syslog severity level, such as "LOG_ERR" or "LOG_INFO". For more information, see Values for level in the syslog manual page. The extension captures events sent to the facility at or above the specified level. |
When you specify syslogEvents, LAD always writes data to a table in Azure Storage. The same data can be written to JSON blobs or Event Hubs or both. You can't disable storing data to a table.
The partitioning behavior for this table is the same as described for performanceCounters. The table name is the concatenation of these strings:
LinuxSyslog- A date, in the form YYYYMMDD, which changes every 10 days
Examples include LinuxSyslog20170410 and LinuxSyslog20170609.
sinksConfig
The optional public sinksConfig section enables sending metrics to the Azure Monitor sink in addition to the Storage account and the default Guest Metrics view.
Note
Both public and protected settings have an optional sinksConfig section. The sinksConfig section in the public settings only holds the AzMonSink sink configuration. EventHub and JsonBlob sink configurations cannot be included in your public settings.
Note
The sinksConfig section requires system-assigned identity to be enabled on the VMs or virtual machine scale set.
You can enable system-assigned identity through the Azure portal, CLI, PowerShell, or Azure Resource Manager. Follow the detailed instructions or see the previous installations samples in this article.
  "sinksConfig": {
    "sink": [
      {
        "name": "AzMonSink",
        "type": "AzMonSink",
        "AzureMonitor": {}
      }
    ]
  },
fileLogs
The fileLogs section controls the capture of log files. LAD captures new text lines as they're written to the file. It writes them to table rows and any specified sinks, such as JsonBlob and EventHub.
Note
The fileLogs are captured by a subcomponent of LAD called omsagent. To collect fileLogs, ensure that the omsagent user has read permissions on the files you specify. It must also have execute permissions on all directories in the path to that file. After LAD is installed, to check permissions, run sudo su omsagent -c 'cat /path/to/file'.
"fileLogs": [
    {
        "file": "/var/log/mydaemonlog",
        "table": "MyDaemonEvents",
        "sinks": ""
    }
]
| Element | Value |
|---|---|
| file | The full path of the log file to be watched and captured. The path can't specify a directory or contain wildcard characters. The omsagent user account must have read access to the file path. |
| table | (Optional) The Azure Storage Table into which new lines from the tail of the file are written. The table must be in the designated storage account, as specified in the protected configuration. |
| sinks | (Optional) A comma-separated list of names of more sinks to which log lines are sent. |
Either "table" or "sinks" or both must be specified.
Metrics supported by the builtin provider
The default metrics that LAD supports are aggregated across all file systems, disks, or names. For nonaggregated metrics, refer to the newer Azure Monitor sink metrics support.
Note
The display names for each metric differ depending on the metrics namespace to which it belongs:
Guest (classic)populated from your storage account: the specifieddisplayNamein theperformanceCounterssection, or the default display name as seen in Azure Portal. For the VM, under Monitoring > Diagnostic settings, select Metrics tab.azure.vm.linux.guestmetricspopulated fromAzMonSink, if configured: the "azure.vm.linux.guestmetricsDisplay Name" specified in the following tables.
The metric values between Guest (classic) and azure.vm.linux.guestmetrics versions differ. While the classic metrics had certain aggregations applied in the agent, the new metrics are unaggregated counters, giving customers the flexibility to aggregate as desired at viewing/alerting time.
The builtin metric provider is a source of metrics that are the most interesting to a broad set of users. These metrics fall into five broad classes:
- Processor
- Memory
- Network
- File system
- Disk
builtin metrics for the Processor class
The Processor class of metrics provides information about processor usage in the VM. When percentages are aggregated, the result is the average across all CPUs.
In a two-vCPU VM, if one vCPU is 100 percent busy and the other is 100 percent idle, the reported PercentIdleTime is 50. If each vCPU is 50 percent busy for the same period, the reported result is also 50. In a four-vCPU VM, when one vCPU is 100 percent busy and the others are idle, the reported PercentIdleTime is 75.
| Counter | azure.vm.linux.guestmetrics Display Name | Meaning |
|---|---|---|
| PercentIdleTime | cpu idle time |
Percentage of time during the aggregation window that processors ran the kernel idle loop |
| PercentProcessorTime | cpu percentage guest os |
Percentage of time running a not idle thread |
| PercentIOWaitTime | cpu io wait time |
Percentage of time waiting for I/O operations to finish |
| PercentInterruptTime | cpu interrupt time |
Percentage of time running hardware or software interrupts and deferred procedure calls (DPCs) |
| PercentUserTime | cpu user time |
Of not idle time during the aggregation window, the percentage of time spent in user mode at normal priority |
| PercentNiceTime | cpu nice time |
Of not idle time, the percentage spent at lowered (nice) priority |
| PercentPrivilegedTime | cpu privileged time |
Of not idle time, the percentage spent in privileged (kernel) mode |
The first four counters should sum to 100 percent. The last three counters also sum to 100 percent. These three counters subdivide the sum of PercentProcessorTime, PercentIOWaitTime, and PercentInterruptTime.
builtin metrics for the Memory class
The Memory class of metrics provides information about memory use, paging, and swapping.
| Counter | azure.vm.linux.guestmetrics Display Name | Meaning |
|---|---|---|
| AvailableMemory | memory available |
Available physical memory in MiB |
| PercentAvailableMemory | mem. percent available |
Available physical memory as a percentage of total memory |
| UsedMemory | memory used |
In-use physical memory (MiB) |
| PercentUsedMemory | memory percentage |
In-use physical memory as a percentage of total memory |
| PagesPerSec | pages |
Total paging (read/write) |
| PagesReadPerSec | page reads |
Pages read from the backing store, such as swap file, program file, and mapped file |
| PagesWrittenPerSec | page writes |
Pages written to the backing store, such as swap file and mapped file |
| AvailableSwap | swap available |
Unused swap space (MiB) |
| PercentAvailableSwap | swap percent available |
Unused swap space as a percentage of the total swap |
| UsedSwap | swap used |
In-use swap space (MiB) |
| PercentUsedSwap | swap percent used |
In-use swap space as a percentage of the total swap |
This class of metrics has only one instance. The "condition" attribute has no useful settings and should be omitted.
builtin metrics for the Network class
The Network class of metrics provides information about network activity on an individual network interface since the startup.
LAD doesn't expose bandwidth metrics. You can get these metrics from host metrics.
| Counter | azure.vm.linux.guestmetrics Display Name | Meaning |
|---|---|---|
| BytesTransmitted | network out guest os |
Total bytes sent since startup |
| BytesReceived | network in guest os |
Total bytes received since startup |
| BytesTotal | network total bytes |
Total bytes sent or received since startup |
| PacketsTransmitted | packets sent |
Total packets sent since startup |
| PacketsReceived | packets received |
Total packets received since startup |
| TotalRxErrors | packets received errors |
Number of receive errors since startup |
| TotalTxErrors | packets sent errors |
Number of transmit errors since startup |
| TotalCollisions | network collisions |
Number of collisions reported by the network ports since startup |
builtin metrics for the File system class
The File system class of metrics provides information about file system usage. Absolute and percentage values are reported as they would be displayed to an ordinary user, not root.
| Counter | azure.vm.linux.guestmetrics Display Name | Meaning |
|---|---|---|
| FreeSpace | filesystem free space |
Available disk space in bytes |
| UsedSpace | filesystem used space |
Used disk space in bytes |
| PercentFreeSpace | filesystem % free space |
Percentage of free space |
| PercentUsedSpace | filesystem % used space |
Percentage of used space |
| PercentFreeInodes | filesystem % free inodes |
Percentage of unused index nodes (inodes) |
| PercentUsedInodes | filesystem % used inodes |
Percentage of allocated (in use) inodes summed across all file systems |
| BytesReadPerSecond | filesystem read bytes/sec |
Bytes read per second |
| BytesWrittenPerSecond | filesystem write bytes/sec |
Bytes written per second |
| BytesPerSecond | filesystem bytes/sec |
Bytes read or written per second |
| ReadsPerSecond | filesystem reads/sec |
Read operations per second |
| WritesPerSecond | filesystem writes/sec |
Write operations per second |
| TransfersPerSecond | filesystem transfers/sec |
Read or write operations per second |
builtin metrics for the Disk class
The Disk class of metrics provides information about disk device usage. These statistics apply to the entire drive.
When a device has multiple file systems, the counters for that device are, effectively, aggregated across all file systems.
| Counter | azure.vm.linux.guestmetrics Display Name | Meaning |
|---|---|---|
| ReadsPerSecond | disk reads |
Read operations per second |
| WritesPerSecond | disk writes |
Write operations per second |
| TransfersPerSecond | disk transfers |
Total operations per second |
| AverageReadTime | disk read time |
Average seconds per read operation |
| AverageWriteTime | disk write time |
Average seconds per write operation |
| AverageTransferTime | disk transfer time |
Average seconds per operation |
| AverageDiskQueueLength | disk queue length |
Average number of queued disk operations |
| ReadBytesPerSecond | disk read guest os |
Number of bytes read per second |
| WriteBytesPerSecond | disk write guest os |
Number of bytes written per second |
| BytesPerSecond | disk total bytes |
Number of bytes read or written per second |
Example LAD 4.0 configuration
Based on the preceding definitions, this section provides a sample LAD 4.0 extension configuration and some explanation. To apply this sample, use your own storage account name, account shared access signature token, and Event Hubs SAS tokens.
Note
Depending on whether you use the Azure CLI or Azure PowerShell to install LAD, the method for providing public and protected settings differs:
- If you're using the Azure CLI, save the following settings to ProtectedSettings.json and PublicSettings.json to use the preceding sample command.
- If you're using PowerShell, run
$protectedSettings = '{ ... }'and$publicSettings = '{ ... }'to save the following settings to$protectedSettingsand$publicSettings.
Protected settings configuration
The protected settings configure:
- A storage account.
- A matching account shared access signature token.
- Several sinks:
JsonBloborEventHubwith SAS tokens.
{
  "storageAccountName": "yourdiagstgacct",
  "storageAccountSasToken": "sv=xxxx-xx-xx&ss=bt&srt=co&sp=wlacu&st=yyyy-yy-yyT21%3A22%3A00Z&se=zzzz-zz-zzT21%3A22%3A00Z&sig=fake_signature",
  "sinksConfig": {
    "sink": [
      {
        "name": "SyslogJsonBlob",
        "type": "JsonBlob"
      },
      {
        "name": "FilelogJsonBlob",
        "type": "JsonBlob"
      },
      {
        "name": "LinuxCpuJsonBlob",
        "type": "JsonBlob"
      },
      {
        "name": "MyJsonMetricsBlob",
        "type": "JsonBlob"
      },
      {
        "name": "LinuxCpuEventHub",
        "type": "EventHub",
        "sasURL": "https://youreventhubnamespace.servicebus.windows.net/youreventhubpublisher?sr=https%3a%2f%2fyoureventhubnamespace.servicebus.windows.net%2fyoureventhubpublisher%2f&sig=fake_signature&se=1808096361&skn=yourehpolicy"
      },
      {
        "name": "MyMetricEventHub",
        "type": "EventHub",
        "sasURL": "https://youreventhubnamespace.servicebus.windows.net/youreventhubpublisher?sr=https%3a%2f%2fyoureventhubnamespace.servicebus.windows.net%2fyoureventhubpublisher%2f&sig=yourehpolicy&skn=yourehpolicy"
      },
      {
        "name": "LoggingEventHub",
        "type": "EventHub",
        "sasURL": "https://youreventhubnamespace.servicebus.windows.net/youreventhubpublisher?sr=https%3a%2f%2fyoureventhubnamespace.servicebus.windows.net%2fyoureventhubpublisher%2f&sig=yourehpolicy&se=1808096361&skn=yourehpolicy"
      }
    ]
  }
}
Public settings configuration
The public settings cause LAD to:
- Upload percent-processor-time metrics and used-disk-space metrics to the
WADMetrics*table. - Upload messages from syslog facility
"user"and severity"info"to theLinuxSyslog*table. - Upload appended lines in file
/var/log/myladtestlogto theMyLadTestLogtable.
In each case, data is also uploaded to:
- Azure Blob Storage. The container name is as defined in the
JsonBlobsink. - An Event Hubs endpoint, as specified in the
EventHubsink.
{
  "StorageAccount": "yourdiagstgacct",
  "ladCfg": {
    "sampleRateInSeconds": 15,
    "diagnosticMonitorConfiguration": {
      "performanceCounters": {
        "sinks": "MyMetricEventHub,MyJsonMetricsBlob",
        "performanceCounterConfiguration": [
          {
            "unit": "Percent",
            "type": "builtin",
            "counter": "PercentProcessorTime",
            "counterSpecifier": "/builtin/Processor/PercentProcessorTime",
            "annotation": [
              {
                "locale": "en-us",
                "displayName": "cpu percentage guest os"
              }
            ],
            "condition": "IsAggregate=TRUE",
            "class": "Processor"
          },
          {
            "unit": "Bytes",
            "type": "builtin",
            "counter": "UsedSpace",
            "counterSpecifier": "/builtin/FileSystem/UsedSpace",
            "annotation": [
              {
                "locale": "en-us",
                "displayName": "Used disfilesystem used space"
              }
            ],
            "condition": "Name=\"/\"",
            "class": "Filesystem"
          }
        ]
      },
      "metrics": {
        "metricAggregation": [
          {
            "scheduledTransferPeriod": "PT1H"
          },
          {
            "scheduledTransferPeriod": "PT1M"
          }
        ],
        "resourceId": "/subscriptions/your_azure_subscription_id/resourceGroups/your_resource_group_name/providers/Microsoft.Compute/virtualMachines/your_vm_name"
      },
      "eventVolume": "Large",
      "syslogEvents": {
        "sinks": "SyslogJsonBlob,LoggingEventHub",
        "syslogEventConfiguration": {
          "LOG_USER": "LOG_INFO"
        }
      }
    }
  },
  "sinksConfig": {
    "sink": [
      {
        "name": "AzMonSink",
        "type": "AzMonSink",
        "AzureMonitor": {}
      }
    ]
  },
  "fileLogs": [
    {
      "file": "/var/log/myladtestlog",
      "table": "MyLadTestLog",
      "sinks": "FilelogJsonBlob,LoggingEventHub"
    }
  ]
}
The resourceId in the configuration must match that of the VM or the Virtual Machine Scale Set.
- Azure platform metrics charting and alerting knows the
resourceIdof the VM you're working on. It expects to find the data for your VM by using theresourceIdas the lookup key. - If you use Azure autoscale, the
resourceIdin the autoscale configuration must match theresourceIdthat LAD uses. - The
resourceIdis built in to the names of JSON blobs written by LAD.
View your data
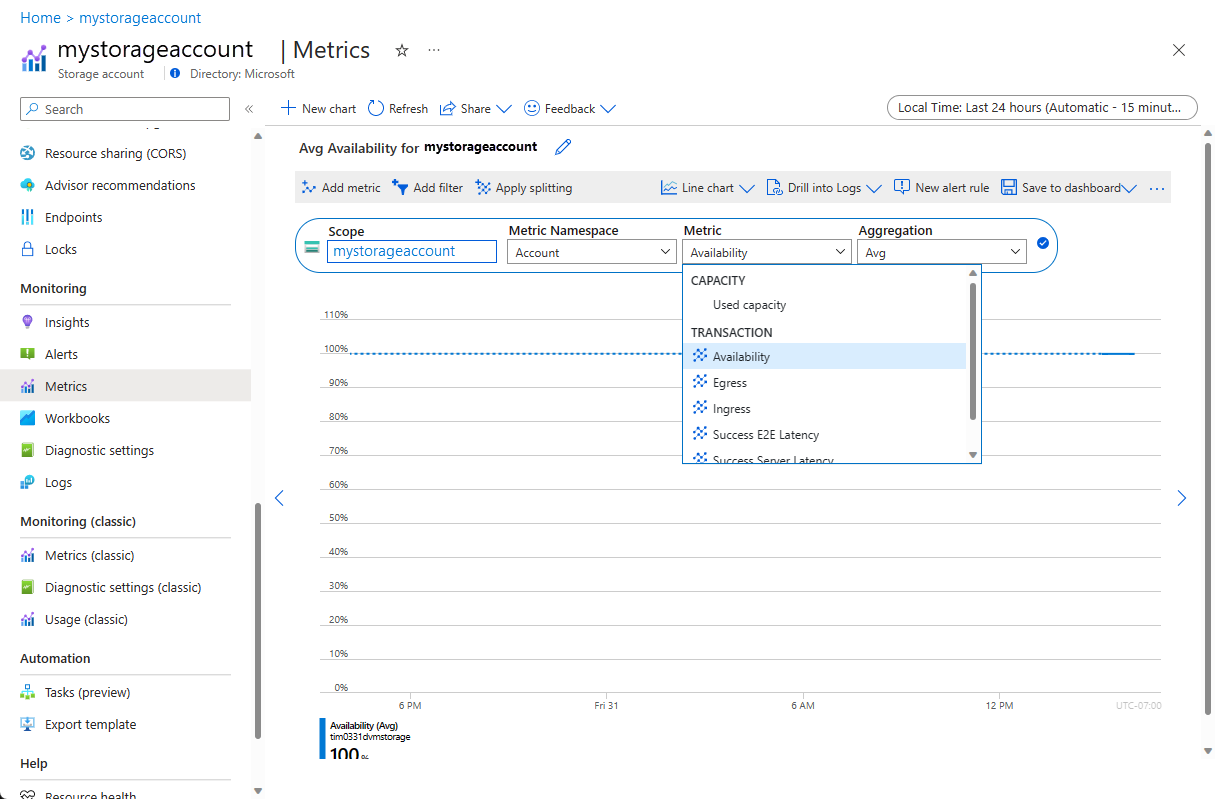
Use the Azure portal to view performance data or set alerts:
The performanceCounters data is always stored in an Azure Storage table. Azure Storage APIs are available for many languages and platforms.
Data sent to JsonBlob sinks is stored in blobs in the storage account named in the protected settings. You can consume the blob data in any Azure Blob Storage API.
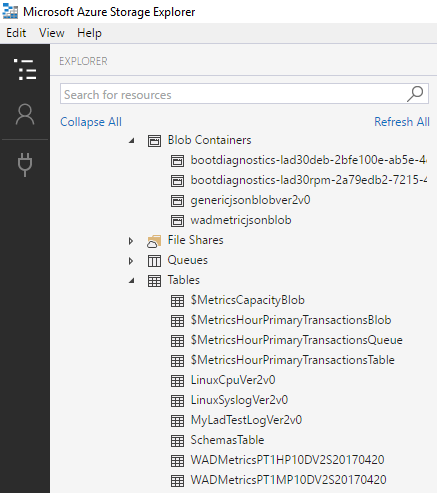
You also can use these UI tools to access the data in Azure Storage:
- Visual Studio Server Explorer
- Azure Storage Explorer
The following screenshot of an Azure Storage Explorer session shows the generated Azure Storage tables and containers from a correctly configured LAD 4.0 extension on a test VM. The image doesn't exactly match the sample LAD 4.0 configuration.
For more information about how to consume messages published to an Event Hubs endpoint, see the relevant Event Hubs documentation.
Next steps
- In Azure Monitor, create alerts for the metrics you collect.
- Create monitoring charts for your metrics.
- Create a Virtual Machine Scale Set by using your metrics to control autoscaling.
Feedback
Coming soon: Throughout 2024 we will be phasing out GitHub Issues as the feedback mechanism for content and replacing it with a new feedback system. For more information see: https://aka.ms/ContentUserFeedback.
Submit and view feedback for