Show the data used to create a Power BI visual
APPLIES TO: ![]() Power BI service for business users
Power BI service for business users ![]() Power BI service for designers & developers
Power BI service for designers & developers ![]() Power BI Desktop
Power BI Desktop ![]() Requires Pro or Premium license
Requires Pro or Premium license
A Power BI visual is constructed using data from underlying semantic models. If you're interested in seeing behind the scenes, Power BI shows you the data that's being used to create a visual. The ability to do this is available in Power BI Desktop and in the Power BI service and is available for almost all visual types.
You can also export the data to Excel for visuals in a report and visuals on a dashboard.
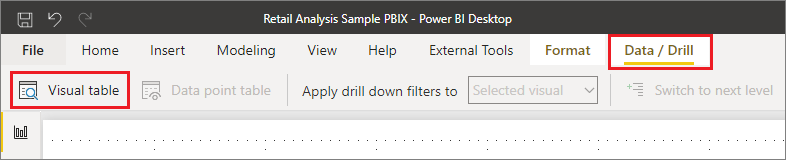
Use Visual table in Power BI Desktop
Use Visual table to display the data underlying a visual. Visual table is available from the Data/Drill tab in the ribbon when a visual is selected.
You can also see the data by using one of these options:
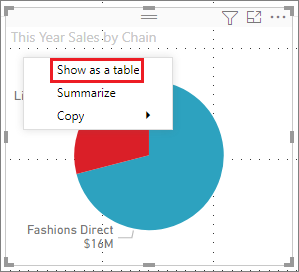
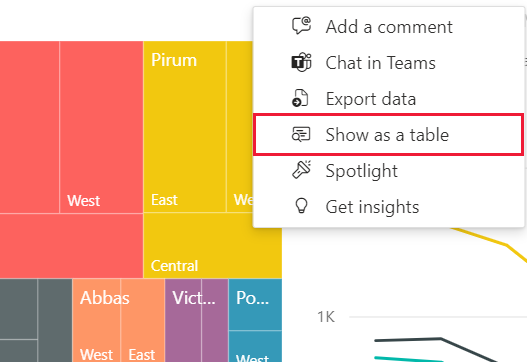
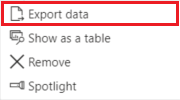
Right-click on a visual, and then select Show as a table from the menu that appears.
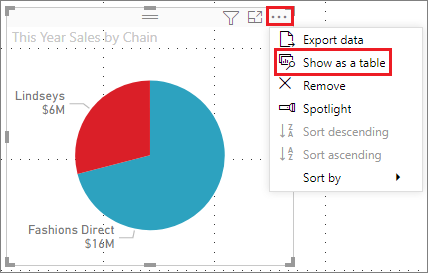
Select More options (...) in the upper-right corner of a visual, and then select Show as a table.
Note
You must be hovering over a data point in the visual for the right-click menu to be available.
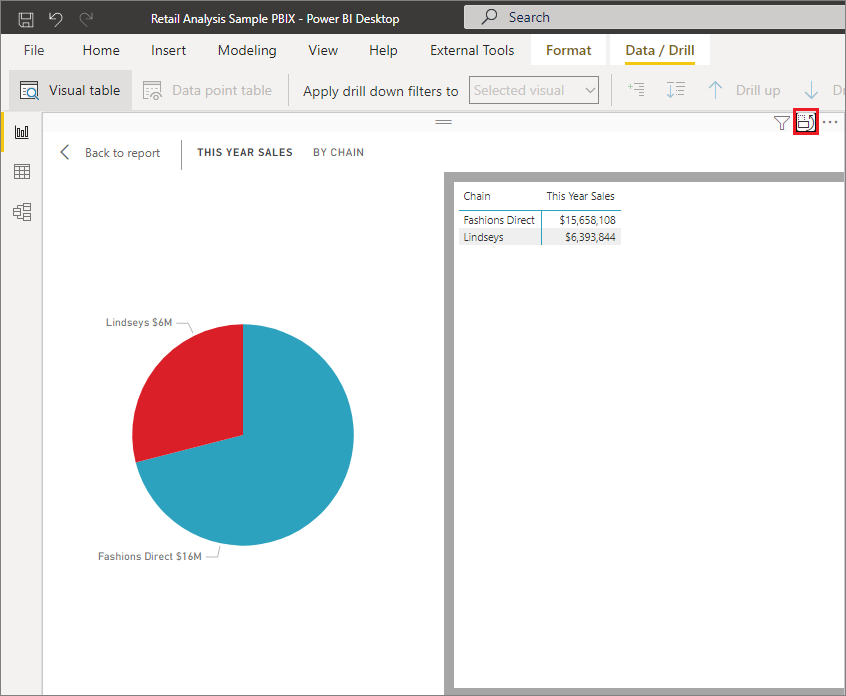
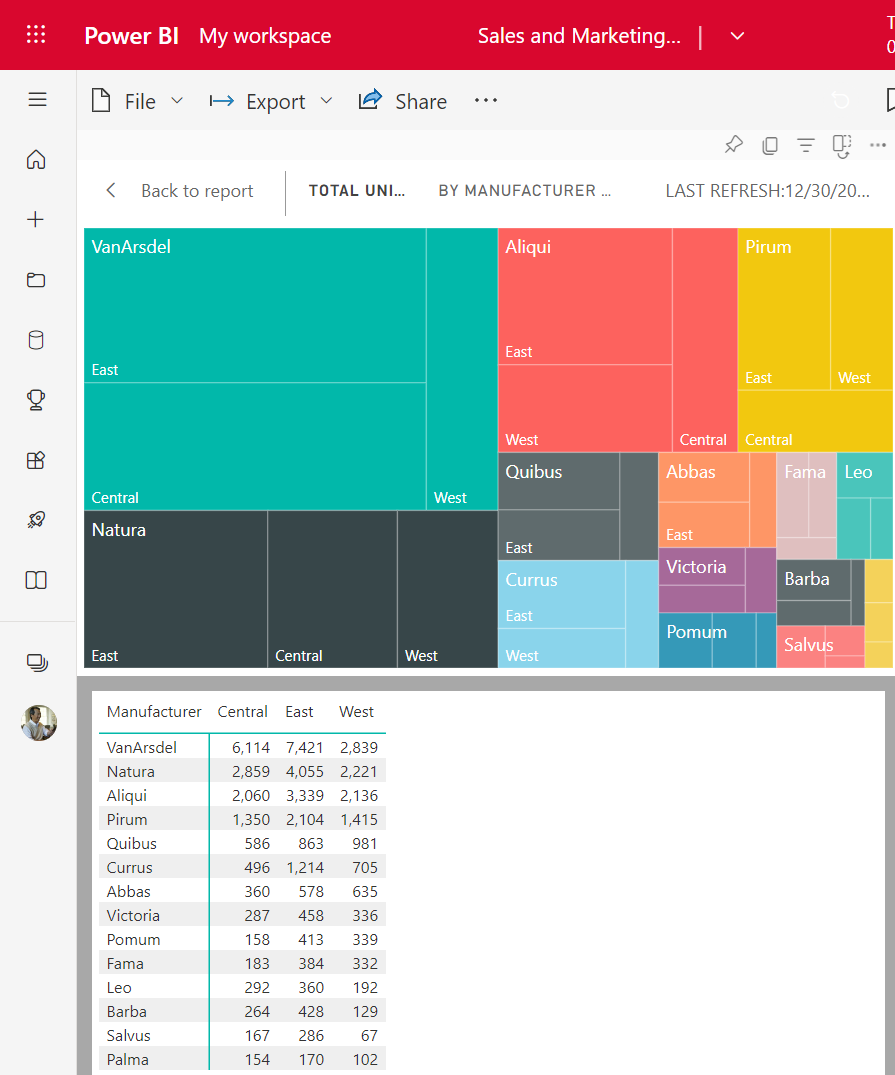
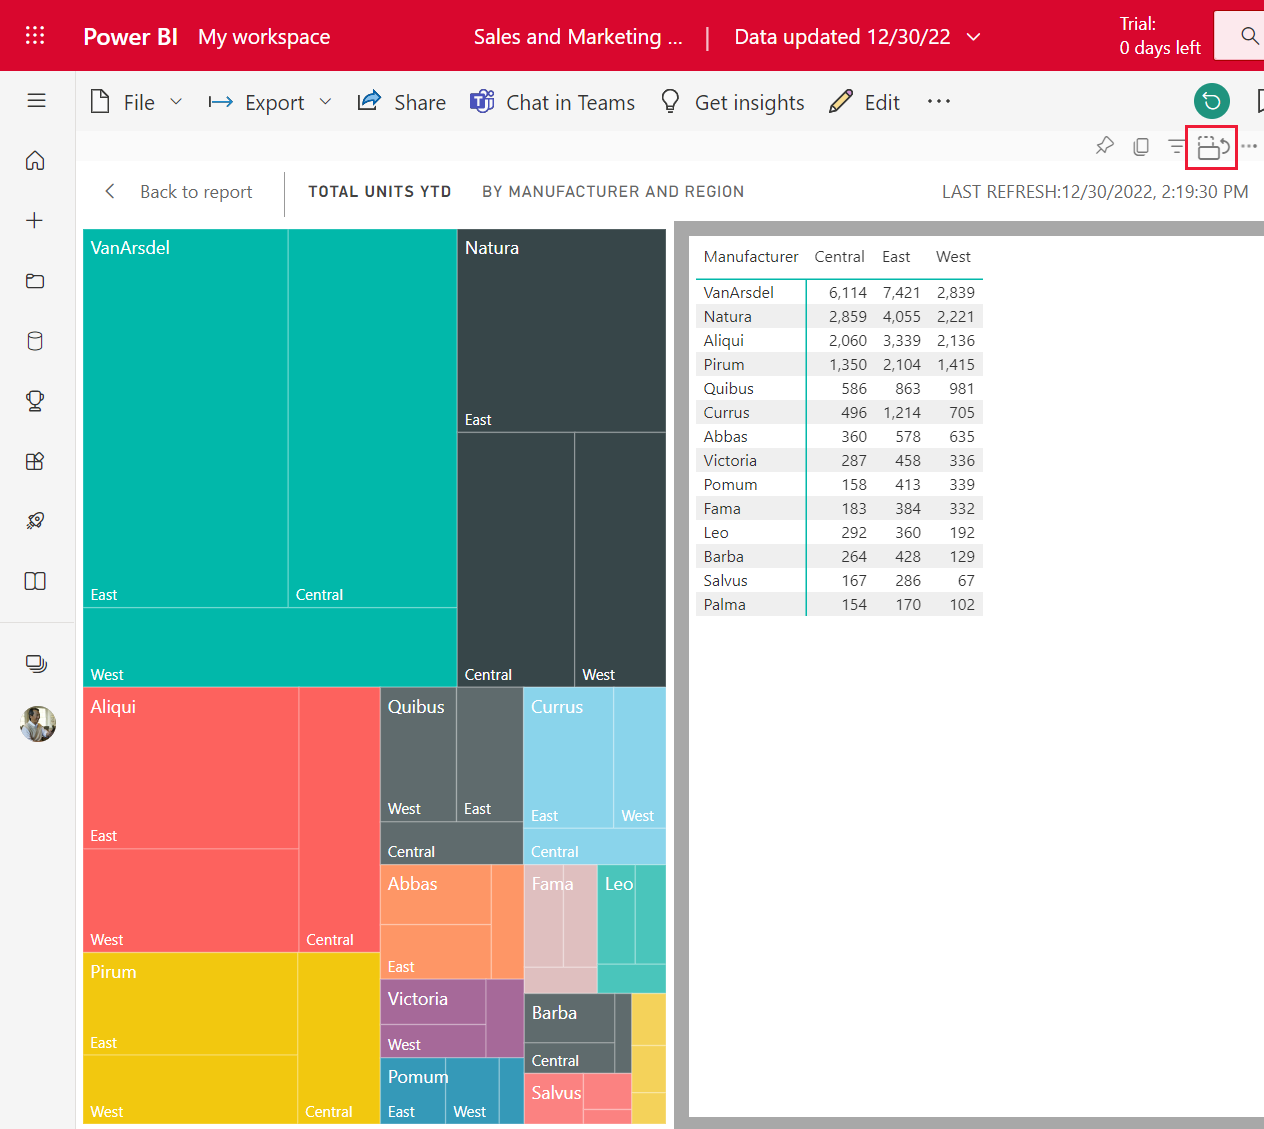
When you select Visual table or Data point table, Power BI displays both the visual and the textual representation of the data. In the horizontal view, the visual is displayed on the top half of the canvas, and the data is shown on the bottom half.
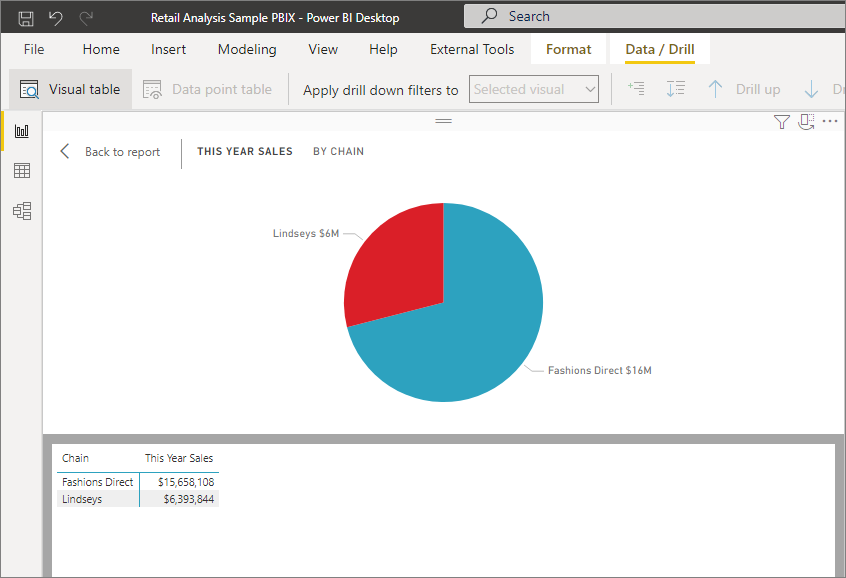
You can toggle between the horizontal view and a vertical view by selecting the icon in the upper-right corner of the canvas.
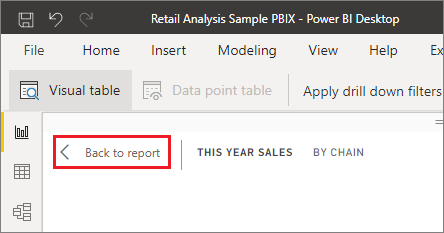
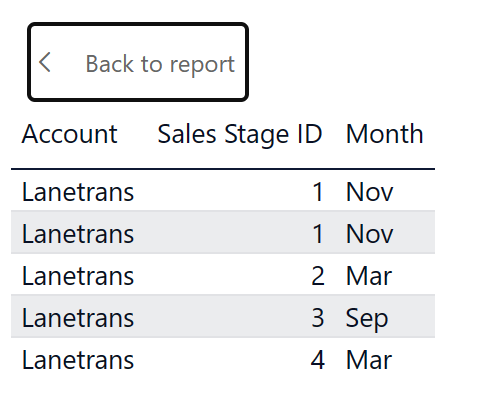
To get back to the report, select < Back to Report in the upper-left corner of the canvas.
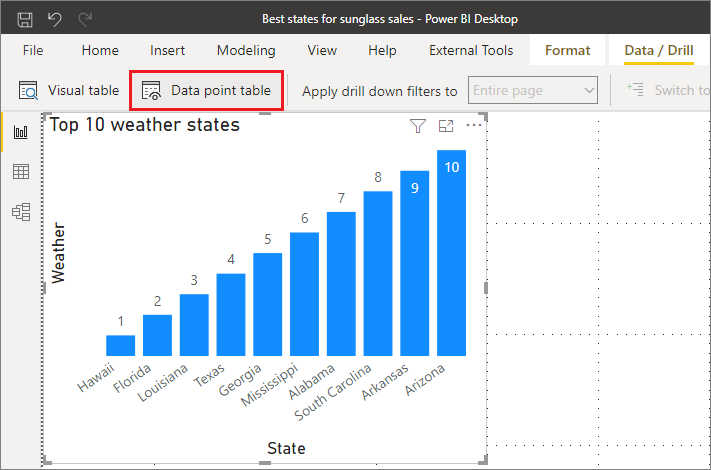
Use Data point table in Power BI Desktop
You can also focus on one data record in a visual, and drill into the data behind it. To use Data point table, select a visual to make it active. Select Data point table in the Data/Drill tab of the ribbon, and then select a data point or row on the visual.
Note
If the Data point table button in the ribbon is disabled and grayed-out, it means the selected visual does not support Data point table.
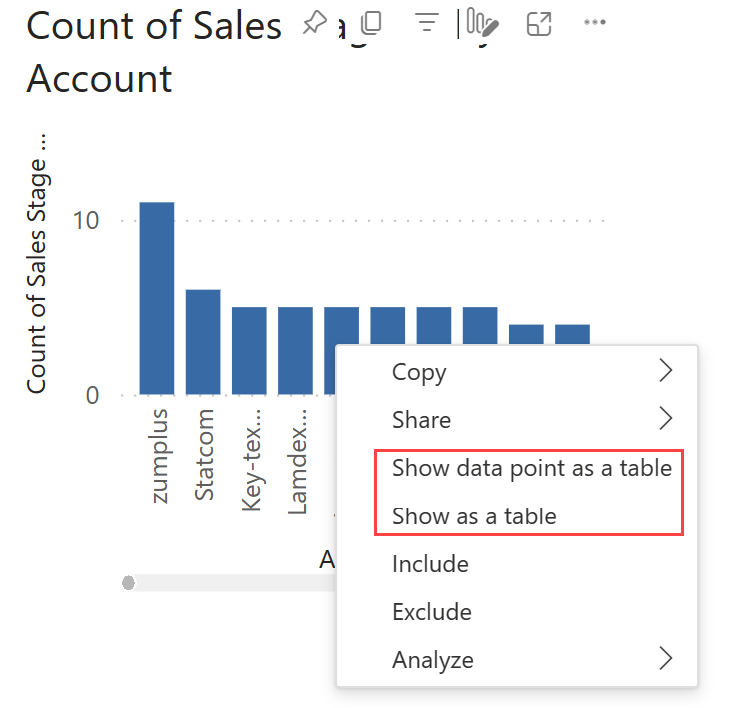
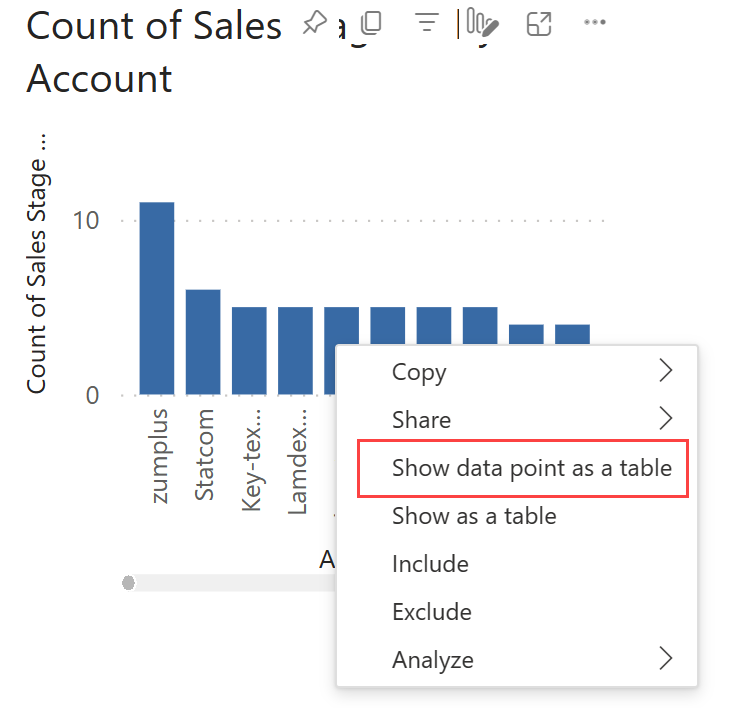
You can also right-click a data element and select Show data point as a table from the menu that appears.
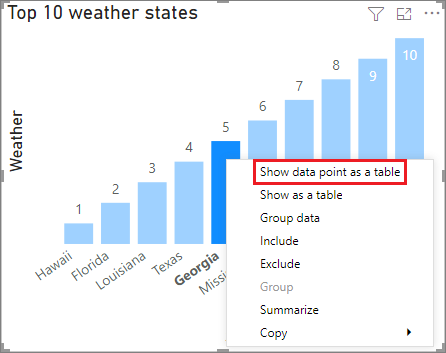
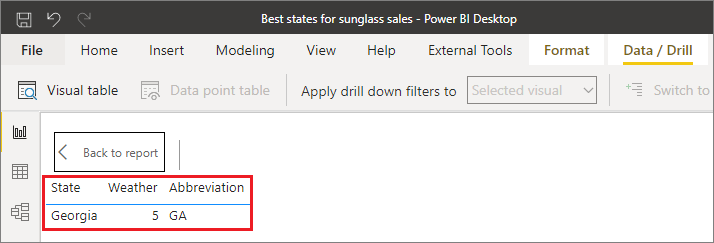
When you select Data point table for a data element, the Power BI Desktop canvas displays all the data associated with the selected element.
Considerations and limitations
Show data point as a table (Power BI service) and Data point table (Power BI Desktop) views
- Can't be exported to PDF or static PowerPoint.
- Are only available for specific types of data. In the Power BI service, if you hover over a data point and don't see the option to Show data point as a table, then the visual contains data that doesn't support it. In Power BI Desktop, if the menu option for Data point table is grayed out, then the visual contains data that doesn't support it. For example, if the visual has a measure in the Value field, showing the data underlying a data point will not be available.
- You can't change the data in these views and save it back to the report.
Show as a table (Power BI service) and Visual table (Power BI Desktop) views
- Are not supported for these visual types: Card, KPI, Key influencers, Q&A visual, Smart narrative, Metrics app visual, Paginated report visual, Power Apps for Power BI visual, ArcGIS map for Power BI visual, Power Automate for Power BI visual.
- Can't be exported to PDF or static PowerPoint.
- You can't change the data and then save it back to the report.
- Are not supported when your visual uses a calculated measure in a (multidimensional) measure group.
- Are not supported when you are connected to a live multidimensional (MD) model.
Related content
There are all sorts of report formatting and data management features in Power BI. Check out the following resources for a few examples:
Feedback
Coming soon: Throughout 2024 we will be phasing out GitHub Issues as the feedback mechanism for content and replacing it with a new feedback system. For more information see: https://aka.ms/ContentUserFeedback.
Submit and view feedback for