Create submetrics in the Power BI service
APPLIES TO: ![]() Power BI Desktop
Power BI Desktop ![]() Power BI service
Power BI service
Metrics in Power BI let customers curate their metrics and track them against key business objectives, in a single pane. Submetrics make scorecards more readable by collecting related metrics together under a single parent metric. You can expand and collapse the parent metric. Submetrics can either be standalone values, unrelated to the parent value, or they can roll up to the parent value. Read about rollups later in this article.
Create a submetric
You can define one or more submetrics for a metric. Like their parent metrics, submetrics can be either connected or set manually. There are two entry points to create a submetric.
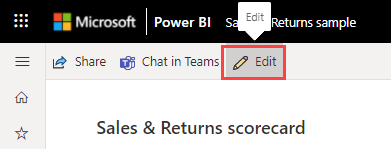
Open a scorecard and select Edit.
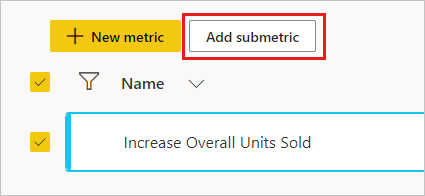
Select the metric you want to create a submetric for, and select Add submetric on top of the scorecard.
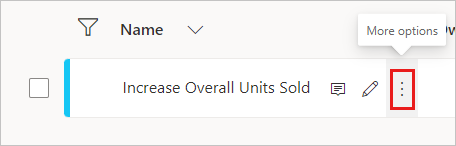
Or hover over the metric you want to create a submetric for, select More options (...) > New submetric.
Repeat the first step as needed to create more submetrics.
Make sure you've selected the metric so you can create submetrics.
See these articles for details on creating manual or connected metrics:
Create submetrics that roll up to the metric
You can also create rollup submetrics, whose values automatically aggregate up to a parent metric. These aggregations recalculate anytime the submetric values change, and capture the history. Rollups are a great way to keep a parent metric up to date without having it backed by a report connection. Rollups work when submetrics are manual or connected, so you can always roll up whatever the current value is, regardless of where it's coming from.
Get started creating rollups
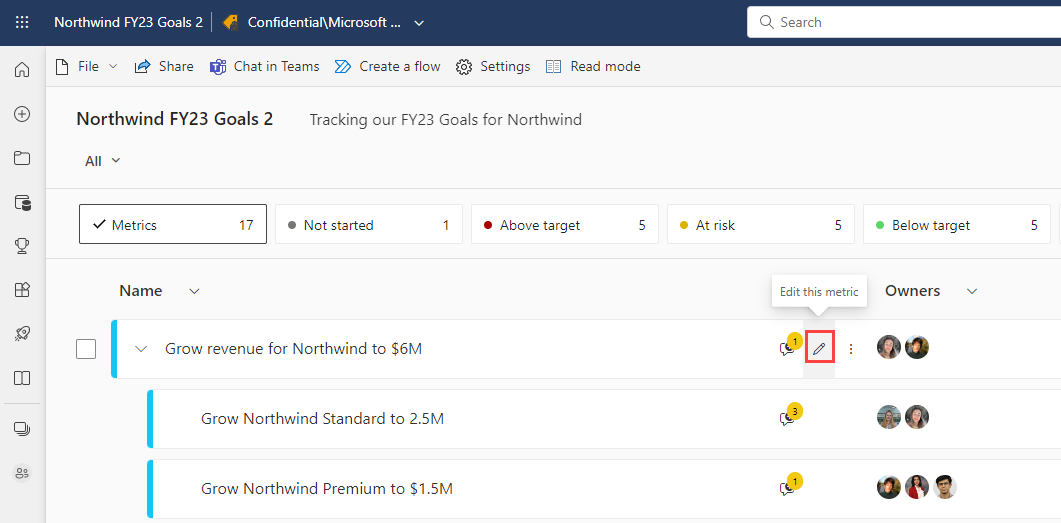
First, make sure you're in edit mode.
Select the pencil icon to enter inline editing of a metric.
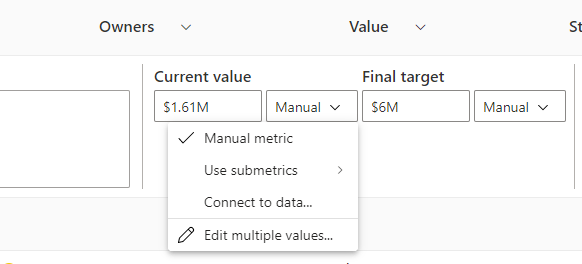
Next to the value and target, you see an indication of what type of metric it is:
- Manual metric
- Use submetrics
- Connected to data
When you choose rollup submetrics, you can choose the aggregation type:
- SUM: a sum of the submetric values
- AVERAGE: an average of the submetric values
- MIN: reflects the lowest submetric value
- MAX: reflects the largest submetric value
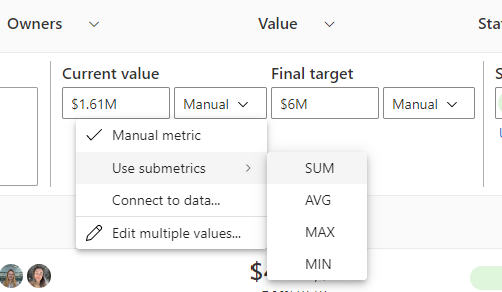
The option you choose automatically calculates the appropriate value and shows it in either the Current value or Target value area. You can set up different rollup aggregation types on the current and target value, allowing for maximum flexibility.

Preserve historical values
You may want to preserve historical values if you're switching metric type from connected to rollup type.
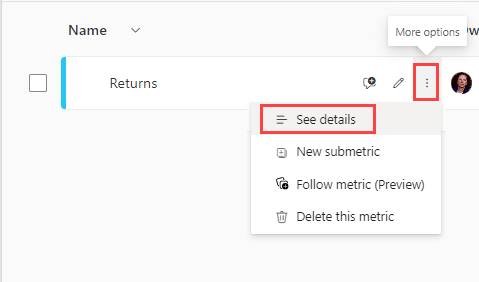
In Edit mode for the scorecard, select More options (...) > See details next to the metric.
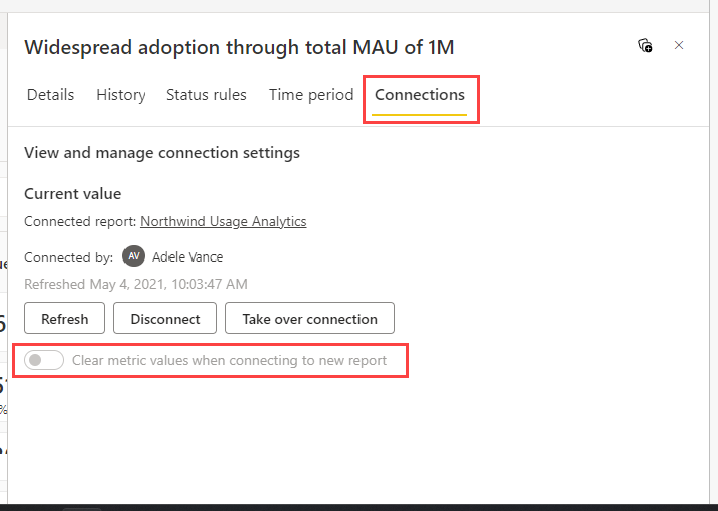
On the Connections tab, ensure that you turn off the toggle labeled Clear metric values when connecting to a new report.
Rollups considerations
- Rollups take place from the day they're set up moving forward. They don't remove, recalculate, or override historical data with retroactive rollup values, in almost all scenarios.
- One scenario where connected historical data is deleted is if the person creating the rollup is not the metric connection owner. To preserve the history, ensure the metric connection owner is the same person as the rollup creator.
- If a scorecard author changes a metric from a rollup to a connected metric and they bring in the history via report connection, the report history overrides historical rollup values.
- New rollup types calculate with the new aggregation moving forward, but don't replace the history.
- Rollups always show the same aggregation value of all submetrics, regardless of metric level permissions. This means if person A only has view access to 3 out of 5 submetrics, they still see the same parent metric value as someone who has access to all submetrics.
Related content
- Get started with metrics in Power BI
- Create scorecards and manual metrics in Power BI
- Create connected metrics in Power BI
More questions? Try the Power BI Community.
Feedback
Coming soon: Throughout 2024 we will be phasing out GitHub Issues as the feedback mechanism for content and replacing it with a new feedback system. For more information see: https://aka.ms/ContentUserFeedback.
Submit and view feedback for