Create and use parameters to visualize variables in Power BI Desktop
You can create variables for your reports, interact with the variable as a slicer, and visualize and quantify different key values in your reports.
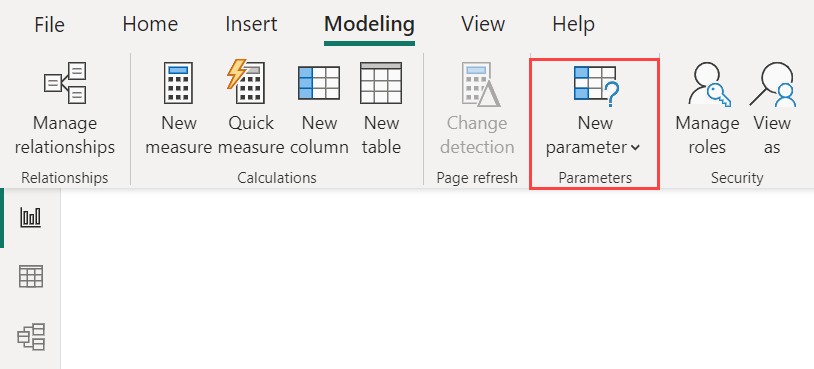
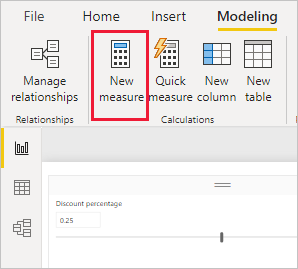
Create a parameter on the Modeling tab in Power BI Desktop. When you select it, a dialog box appears where you can configure the parameter.
Create a parameter
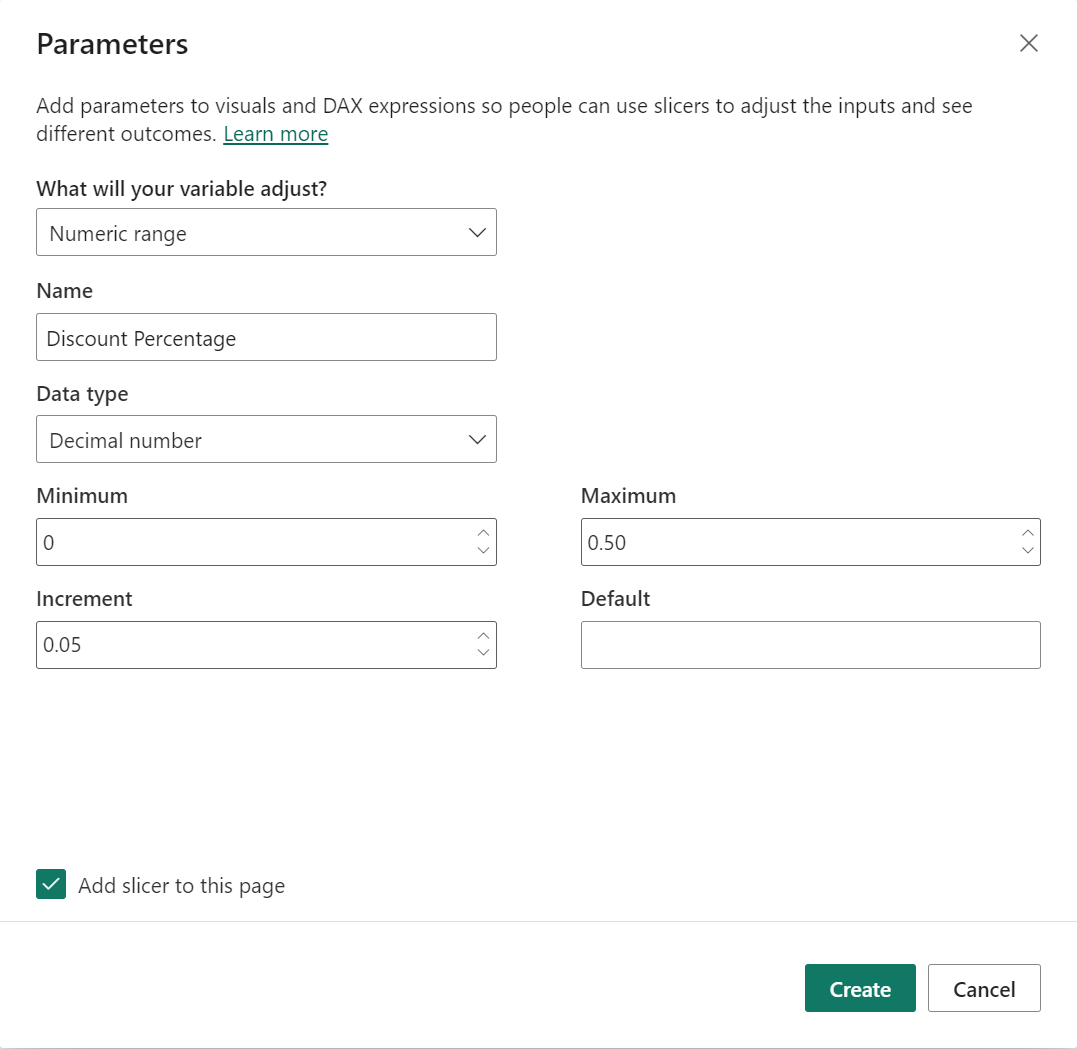
To create a parameter, select New parameter from the Modeling tab in Power BI Desktop, and choose either Fields or Numeric range. The following examples use Numeric range, similar procedures apply to using Fields. Name the example Discount Percentage and set its Data type to Decimal number. The Minimum value is zero. The Maximum is 0.50 (50 percent). Also set the Increment to 0.05, or five percent. The increment determines how much the parameter will adjust when interacted with in a report.
Note
For decimal numbers, make sure you precede the value with a zero, as in 0.50 versus just .50. Otherwise, the number won't validate and the OK button won't be selectable.
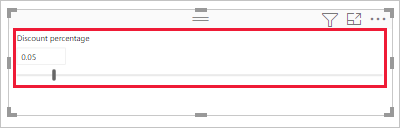
For your convenience, the Add slicer to this page checkbox automatically puts a slicer with your parameter onto the current report page.
In addition to creating the parameter, you also create a measure automatically in this process, which you can use to visualize the current value of the parameter.
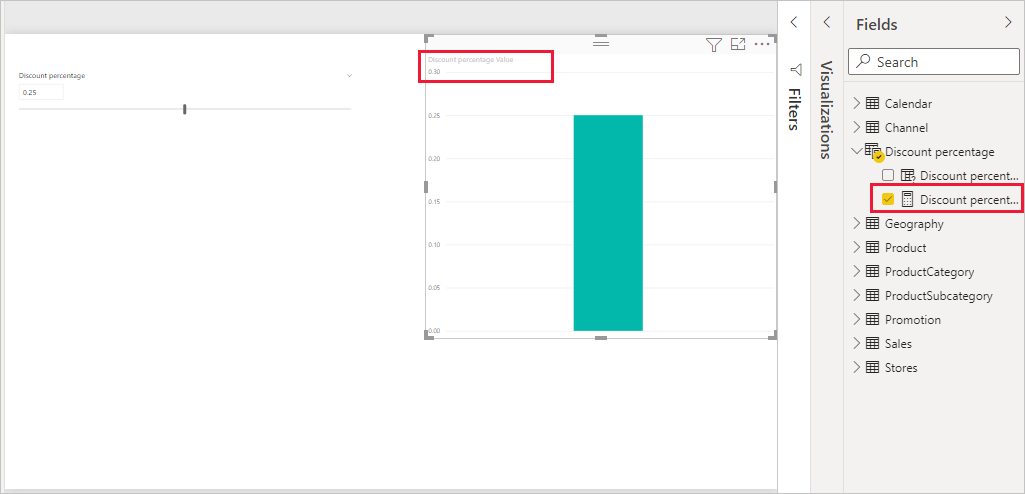
It's important and useful to note that after you create a parameter, both the parameter and the measure become part of your model. So, they're available throughout the report and can be used on other report pages. And, since they're part of the model, you can delete the slicer from the report page. If you want it back, choose the parameter from the Fields list and drag it onto the canvas, then change the visual to a slicer.
Use a numeric range parameter
This next example shows you how to use a parameter with data. You created the parameter in the previous section. Now you'll put it to use by creating a new measure whose value adjusts with the slider.
The new measure is going to be the total sales amount, with the discount rate applied. You can create complex and interesting measures that let the consumers of your reports visualize the variable of your parameter. For example, you could create a report that lets sales people see their compensation if they meet certain sales goals or percentages, or see the effect of increased sales to deeper discounts.
Enter the measure formula into the formula bar, and name the formula Sales after Discount.
Sales after Discount = SUM(Sales[SalesAmount]) - (SUM(Sales[SalesAmount]) * 'Discount percentage' [Discount percentage Value])
Then, create a column visual with OrderDate on the axis, and both SalesAmount and the just-created measure, Sales after Discount as the values.
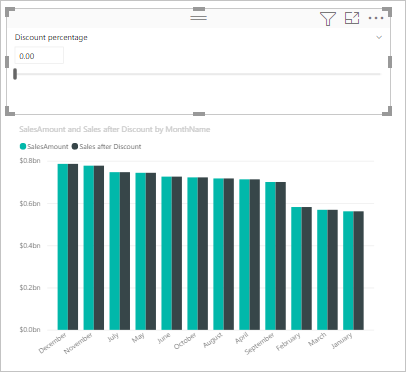
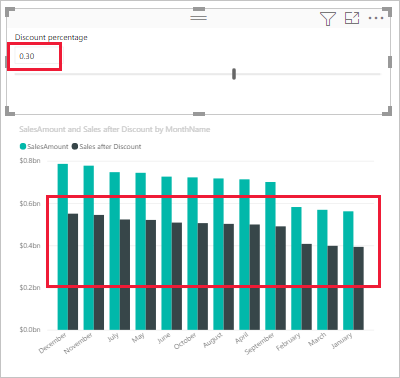
Then, as you move the slider, you'll see that the Sales after Discount column reflects the discounted sales amount.
This process is how you create parameters for any data you might want to work with. You can use parameters in all sorts of situations. These parameters enable the consumers of reports to interact with different scenarios that you create in your reports.
Considerations and limitations
There are a couple considerations and limitations for parameters to keep in mind:
Parameters can only have 1,000 unique values. For parameters with more than 1,000 unique values, the parameter values will be evenly sampled.
Parameters are designed for measures within visuals, and might not calculate properly when used in a dimension calculation.
Related content
You might also be interested in the following articles:
Feedback
Coming soon: Throughout 2024 we will be phasing out GitHub Issues as the feedback mechanism for content and replacing it with a new feedback system. For more information see: https://aka.ms/ContentUserFeedback.
Submit and view feedback for