Describe wait statistics
One holistic way of monitoring server performance is to evaluate what the server is waiting on. Wait statistics are complex, and SQL Server is instrumented with hundreds of waiting types, which monitors each running thread and logs what the thread is waiting on.
Detecting and troubleshooting SQL Server performance issues require an understanding of how wait statistics work, and how the database engine uses them while processing a request.
Wait statistics are broken down into three types of waits: resource waits, queue waits, and external waits.
- Resource waits occur when a worker thread in SQL Server requests access to a resource that is currently being used by a thread. Examples of resources wait are locks, latches, and disk I/O waits.
- Queue waits occur when a worker thread is idle and waiting for work to be assigned. Example queue waits are deadlock monitoring and deleted record cleanup.
- External waits occur when SQL Server is waiting on an external process like a linked server query to complete. An example of an external wait is a network wait related to returning a large result set to a client application.
You can check sys.dm_os_wait_stats system view to explore all the waits encountered by threads that executed, and sys.dm_db_wait_stats for Azure SQL Database. The sys.dm_exec_session_wait_stats system view lists active waiting sessions.
These system views allow the DBA to get an overview of the performance of the server, and to readily identify configuration or hardware issues. This data is persisted from the time of instance startup, but the data can be cleared as needed to identify changes.
Wait statistics are evaluated as a percentage of the total waits on the server.
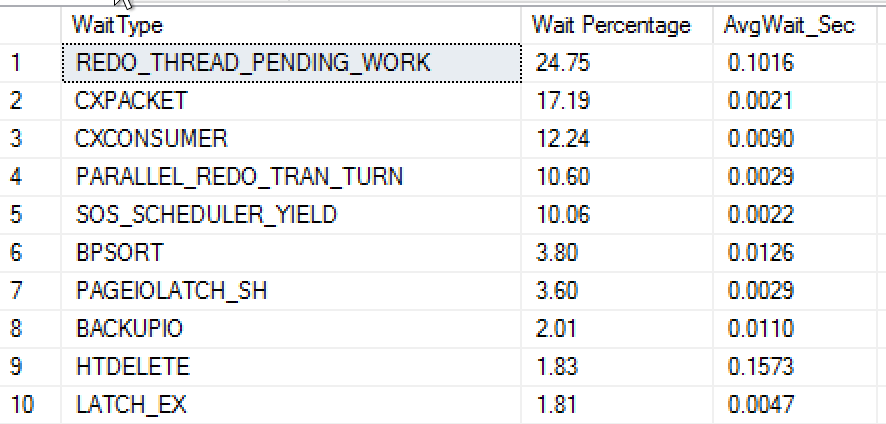
The result of this query from sys.dm_os_wait_stats shows the wait type, and the aggregation of percent of time waiting (Wait Percentage column) and the average wait time in seconds for each wait type.
In this case, the server has Always On Availability Groups in place, as indicated by the REDO_THREAD_PENDING_WORK and PARALLEL_REDO_TRAN_TURN wait types. The relatively high percentage of CXPACKET and SOS_SCHEDULER_YIELD waits indicates that this server is under some CPU pressure.
As DMVs provide a list of wait types with the highest time accumulated since the last SQL Server startup, collecting and storing wait statistic data periodically could help you understand and correlate performance problems with other database events.
Considering that DMVs provide you with a list of wait types with the highest time accumulated since the last SQL Server startup, collecting and storing wait statistics periodically might help you understand and correlate performance problems with other database events.
There are several types of waits available in SQL Server, but some of them are common.
RESOURCE_SEMAPHORE—this wait type is indicative of queries waiting on memory to become available, and may indicate excessive memory grants to some queries. This problem is typically observed by long query runtimes or even time outs. These wait types can be caused by out-of-date statistics, missing indexes, and excessive query concurrency.
LCK_M_X—frequent occurrences of this wait type can indicate a blocking problem, that can be solved by either changing to the
READ COMMITTED SNAPSHOTisolation level, or making changes in indexing to reduce transaction times, or possibly better transaction management within T-SQL code.PAGEIOLATCH_SH—this wait type can indicate a problem with indexes (or a lack of useful indexes), where SQL Server is scanning too much data. Alternatively, if the wait count is low, but the wait time is high, it can indicate storage performance problems. You can observe this behavior by analyzing the data in the waiting_tasks_count and the wait_time_ms columns in the
sys.dm_os_wait_statssystem view, to calculate an average wait time for a given wait type.SOS_SCHEDULER_YIELD—this wait type can indicate high CPU utilization, which is correlated with either high number of large scans, or missing indexes, and often with high numbers of CXPACKET waits.
CXPACKET—if this wait type is high it can indicate improper configuration. Prior to SQL Server 2019, the max degree of parallelism default setting is to use all available CPUs for queries. Additionally, the cost threshold for parallelism setting defaults to 5, which can lead to small queries being executed in parallel, which can limit throughput. Lowering MAXDOP and increasing the cost threshold for parallelism can reduce this wait type, but the CXPACKET wait type can also indicate high CPU utilization, which is typically resolved through index tuning.
PAGEIOLATCH_UP—this wait type on data pages 2:1:1 can indicate TempDB contention on Page Free Space (PFS) data pages. Each data file has one PFS page per 64 MB of data. This wait is typically caused by only having one TempDB file, as prior to SQL Server 2016 the default behavior was to use one data file for TempDB. The best practice is to use one file per CPU core up to eight files. It's also important to ensure your TempDB data files are the same size and have the same autogrowth settings to ensure they're used evenly. SQL Server 2016 and higher control the growth of TempDB data files to ensure they grow in a consistent, simultaneous fashion.
In addition to the aforementioned DMVs, the Query Store also tracks waits associated with a given query. However, waits data tracked by Query Store isn't tracked at the same granularity as the data in the DMVs, but it can provide a nice overview of what a query is waiting on.