Monitor Azure Stack HCI clusters from Windows Admin Center
Applies to: Azure Stack HCI, versions 22H2 and 21H2; Windows Server 2022, Windows Server 2019
This article provides instructions for connecting to an Azure Stack HCI cluster and monitoring both cluster and storage performance using Windows Admin Center.
Install Windows Admin Center
Windows Admin Center is a locally deployed, browser-based app for managing Azure Stack HCI. The simplest way to install Windows Admin Center is on a local management PC (desktop mode), although you can also install it on a server (service mode).
Note
For Azure AD authentication, install Windows Admin Center on a server.
If you install Windows Admin Center on a server, tasks that require CredSSP, such as cluster creation and installing updates and extensions, require using an account that's a member of the Gateway Administrators group on the Windows Admin Center server. For more information, see the first two sections of Configure User Access Control and Permissions.
Add and connect to an Azure Stack HCI cluster
After you have completed the installation of Windows Admin Center, you can add a cluster to manage from the main overview page.
Select + Add under All connections.

Select Add under Server clusters to add an Azure Stack HCI cluster:
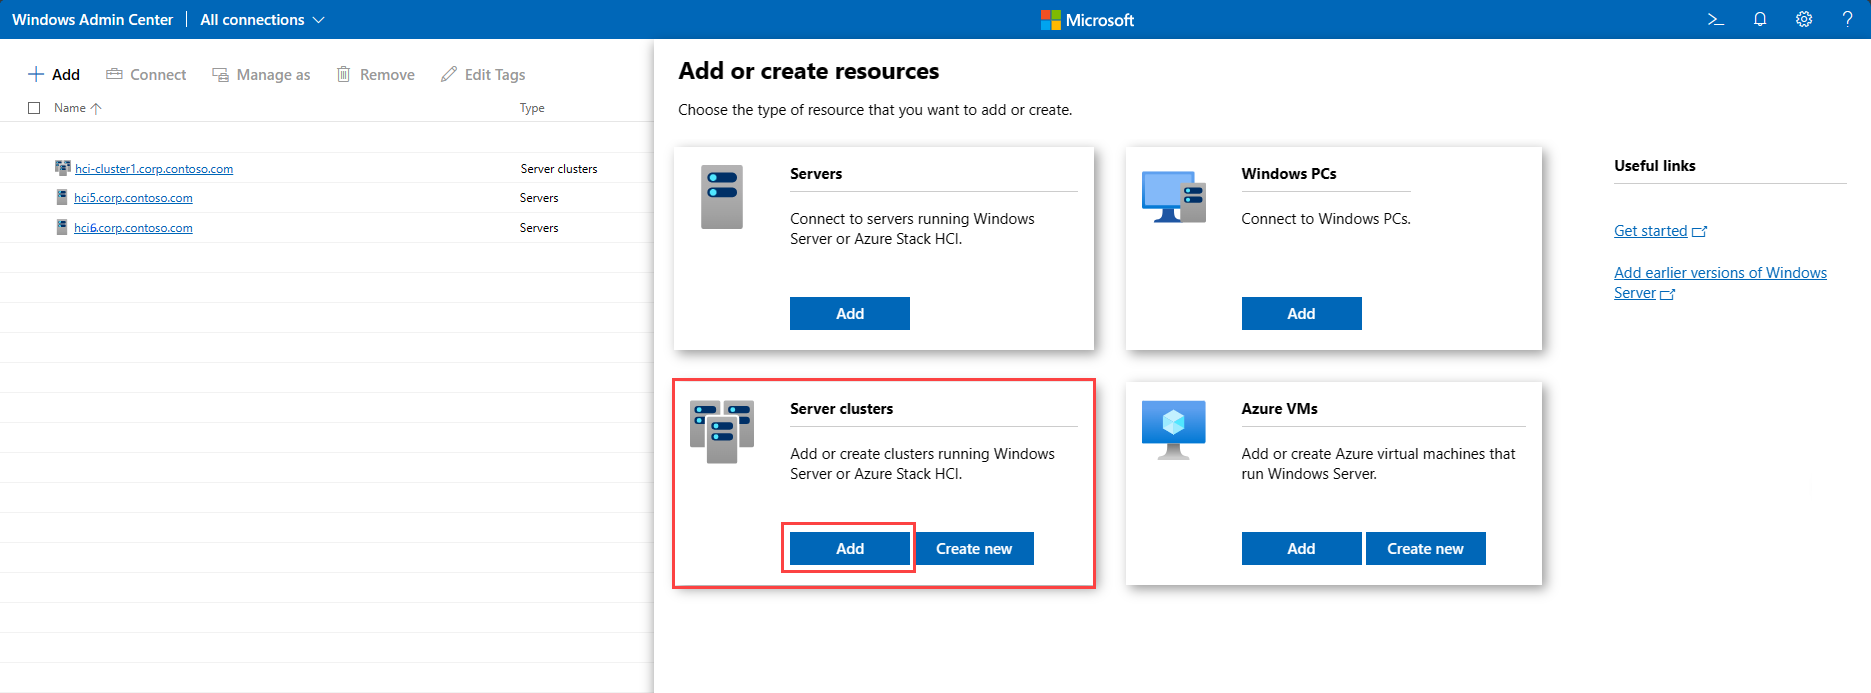
Type the name of the cluster to manage and select Add. The cluster will be added to your connection list on the overview page.
Under All connections, select the name of the cluster you just added. Windows Admin Center will start Cluster Manager and take you directly to the Windows Admin Center dashboard for that cluster.


Monitor using Windows Admin Center dashboard
The Windows Admin Center dashboard provides alerts and health information about servers, drives, and volumes, as well as details about CPU, memory, and storage usage. The top of the Windows Admin Center dashboard prominently displays critical alerts as soon as you sign in. The bottom of the dashboard displays cluster performance information, such as input/output operations/second (IOPS) and latency by hour, day, week, month, or year.

Monitor virtual machines
It's important to understand the health of the virtual machines (VMs) on which your applications and databases run. If a VM is not assigned enough CPU or memory for the workloads running on it, performance could slow, or the application could become unavailable. If a VM responds to less than three heartbeats for a period of five minutes or longer, there may be a problem.
To monitor VMs in Windows Admin Center, select Virtual machines from the Tools menu on the left.

To view a complete inventory of VMs running on the cluster, select Inventory at the top of the page. You'll see a table with information about each VM, including:
Name: The name of the VM.
State: Indicates if the VM is running or stopped.
Host server: Indicates which server in the cluster the VM is running on.
CPU usage: The percentage of the cluster's total CPU resources that the VM is consuming.
Memory pressure: The percentage of available memory resources that the VM is consuming.
Memory demand: The amount of assigned memory (GB or MB) that the VM is consuming.
Assigned memory: The total amount of memory assigned to the VM.
Uptime: How long the VM has been running in days:hours:minutes:seconds.
Heartbeat: Indicates whether the cluster can communicate with the VM.
Disaster recovery status: Shows whether the VM is signed into Azure Site Recovery.


Monitor servers
You can monitor the host servers that comprise an Azure Stack HCI cluster directly from Windows Admin Center. If host servers are not configured with sufficient CPU or memory to provide the resources VMs require, they can be a performance bottleneck.
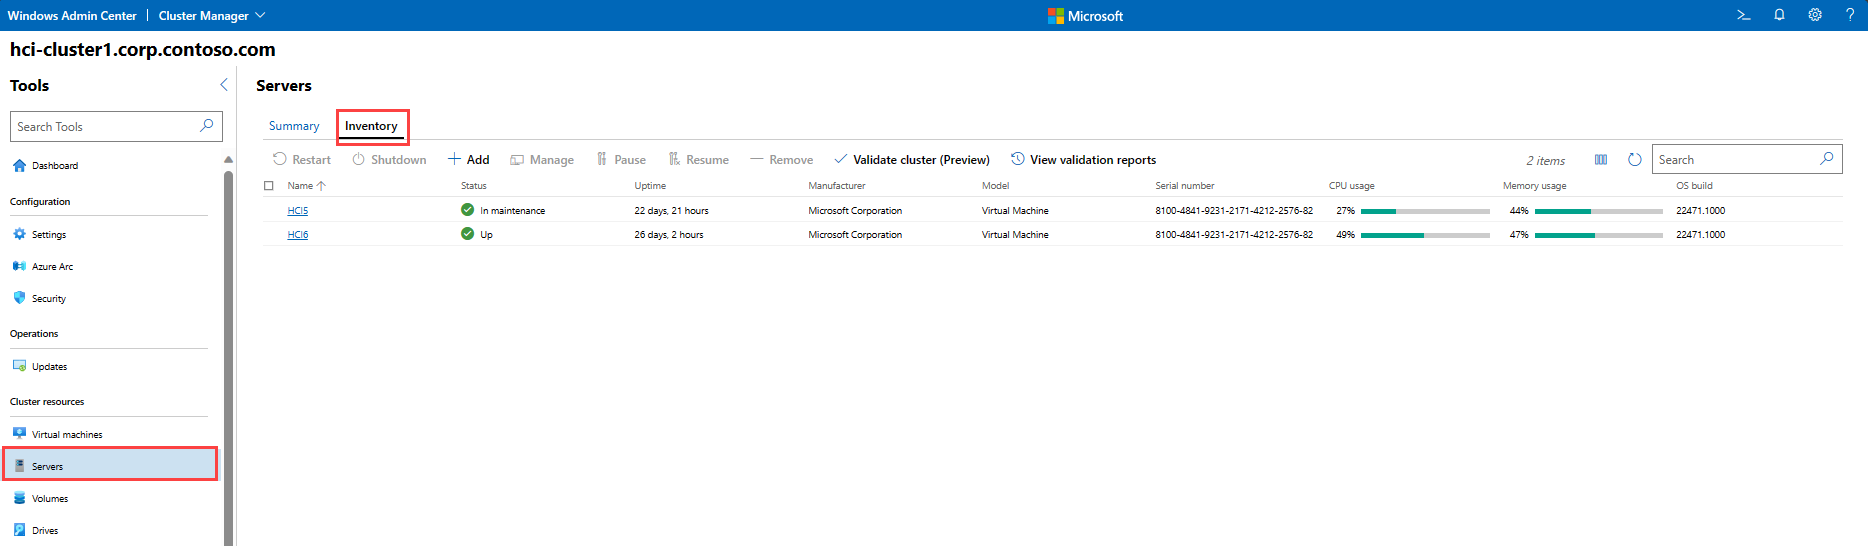
To monitor servers in Windows Admin Center, select Servers from the Tools menu on the left.

To view a complete inventory of servers in the cluster, select Inventory at the top of the page. You'll see a table with information about each server, including:
Name: The name of the host server in the cluster.
Status: Indicates if the server is up or down.
Uptime: How long the server has been up.
Manufacturer: The hardware manufacturer of the server.
Model: The model of the server.
Serial number: The serial number of the server.
CPU usage: The percentage of the host server's CPU that is being utilized. No server in the cluster should use more than 85 percent of its CPU for longer than 10 minutes.
Memory usage: The percentage of the host server's memory that is being utilized. If a server has less than 100MB of memory available for 10 minutes or longer, consider adding memory.

Monitor volumes
Storage volumes can fill up quickly, making it important to monitor them on a regular basis to avoid any application impact.
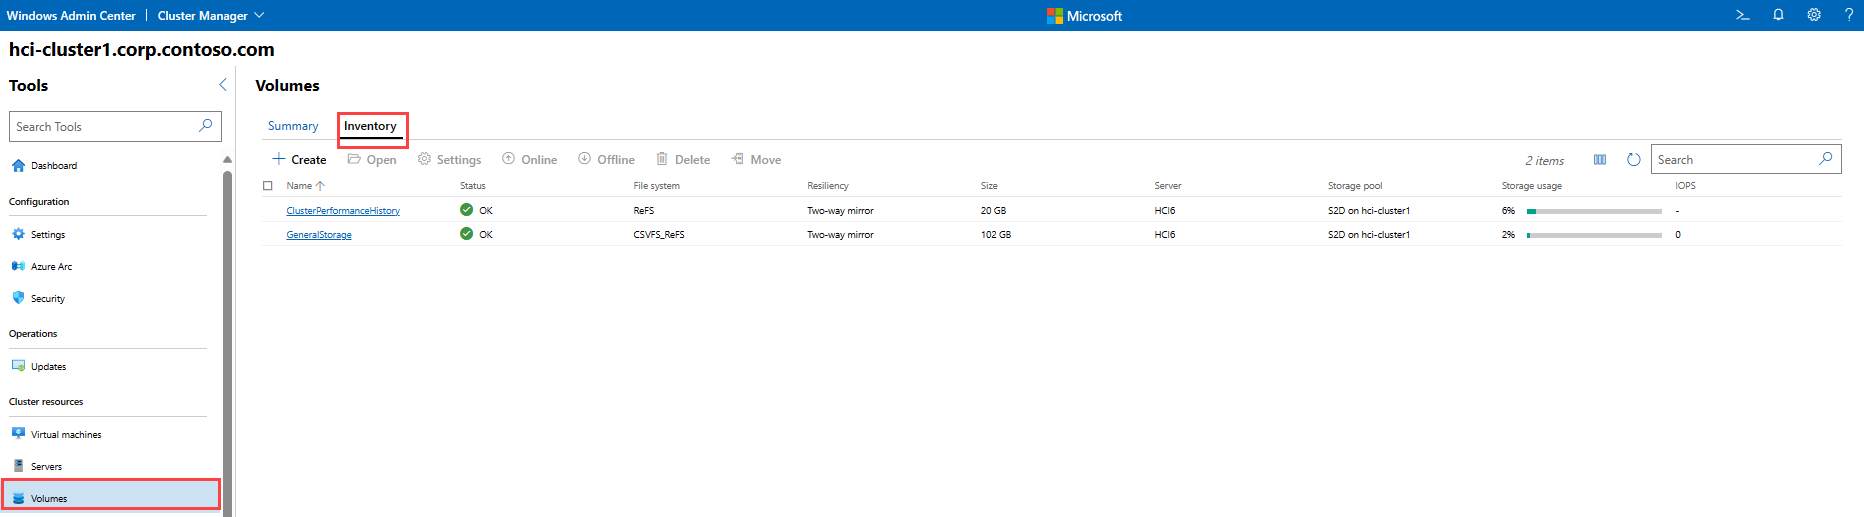
To monitor volumes in Windows Admin Center, select Volumes from the Tools menu on the left.

To view a complete inventory of storage volumes on the cluster, select Inventory at the top of the page. You'll see a table with information about each volume, including:
Name: The name of the volume.
Status: "OK" indicates that the volume is healthy; otherwise, a warning or error is reported.
File system: File system on the volume (ReFS, CSVFS).
Resiliency: Indicates whether the volume is a two-way mirror, three-way mirror, or mirror-accelerated parity.
Size: Size of the volume (TB/GB)
Storage pool: The storage pool the volume belongs to.
Storage usage: The percentage of the volume's storage capacity that is being used.
IOPS: Number of input/output operations per second.

Monitor drives
Azure Stack HCI virtualizes storage in such a way that losing an individual drive will not significantly impact the cluster. However, failed drives will need to be replaced, and drives can impact performance by filling up or introducing latency. If the operating system cannot communicate with a drive, the drive may be loose or disconnected, its connector may have failed, or the drive itself may have failed. Windows automatically retires drives after 15 minutes of lost communication.
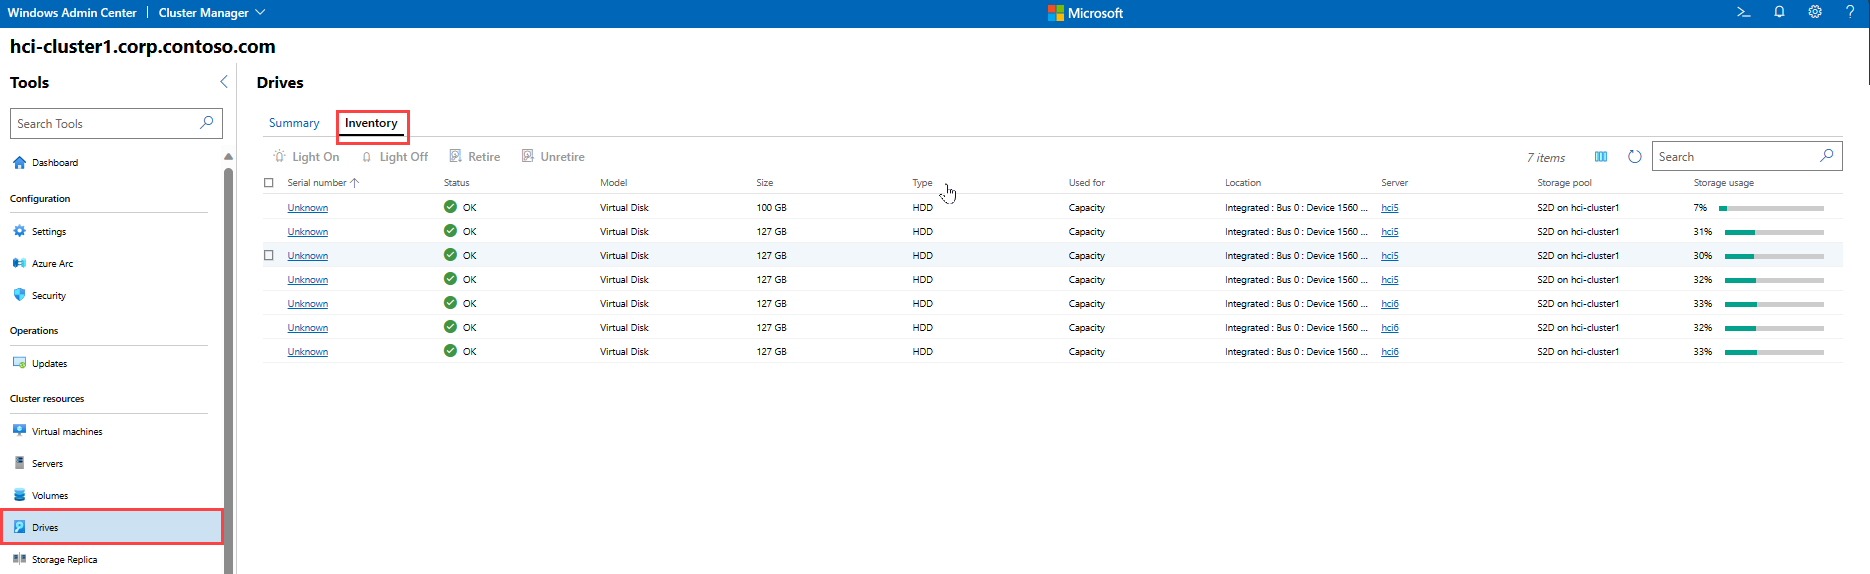
To monitor drives in Windows Admin Center, select Drives from the Tools menu on the left.

To view a complete inventory of drives on the cluster, select Inventory at the top of the page. You'll see a table with information about each drive, including:
Serial number: The serial number of the drive.
Status: "OK" indicates that the drive is healthy; otherwise, a warning or error is reported.
Model: The model of the drive.
Size: The total capacity of the drive (TB/GB).
Type: Drive type (SSD, HDD).
Used for: Indicates whether the drive is used for cache or capacity.
Location: The storage adapter and port the drive is connected to.
Server: The name of the server the drive is connected to.
Storage pool: The storage pool the drive belongs to.
Storage usage: The percentage of the drive's storage capacity that is being used.

Virtual switches
To view the settings for a virtual switch in the cluster, select Virtual switches from the Tools menu on the left, then select the name of the virtual switch you want to display the settings for. Windows Admin Center will display the network adapters associated with the virtual switch, including their IP addresses, connection state, link speed, and MAC address.

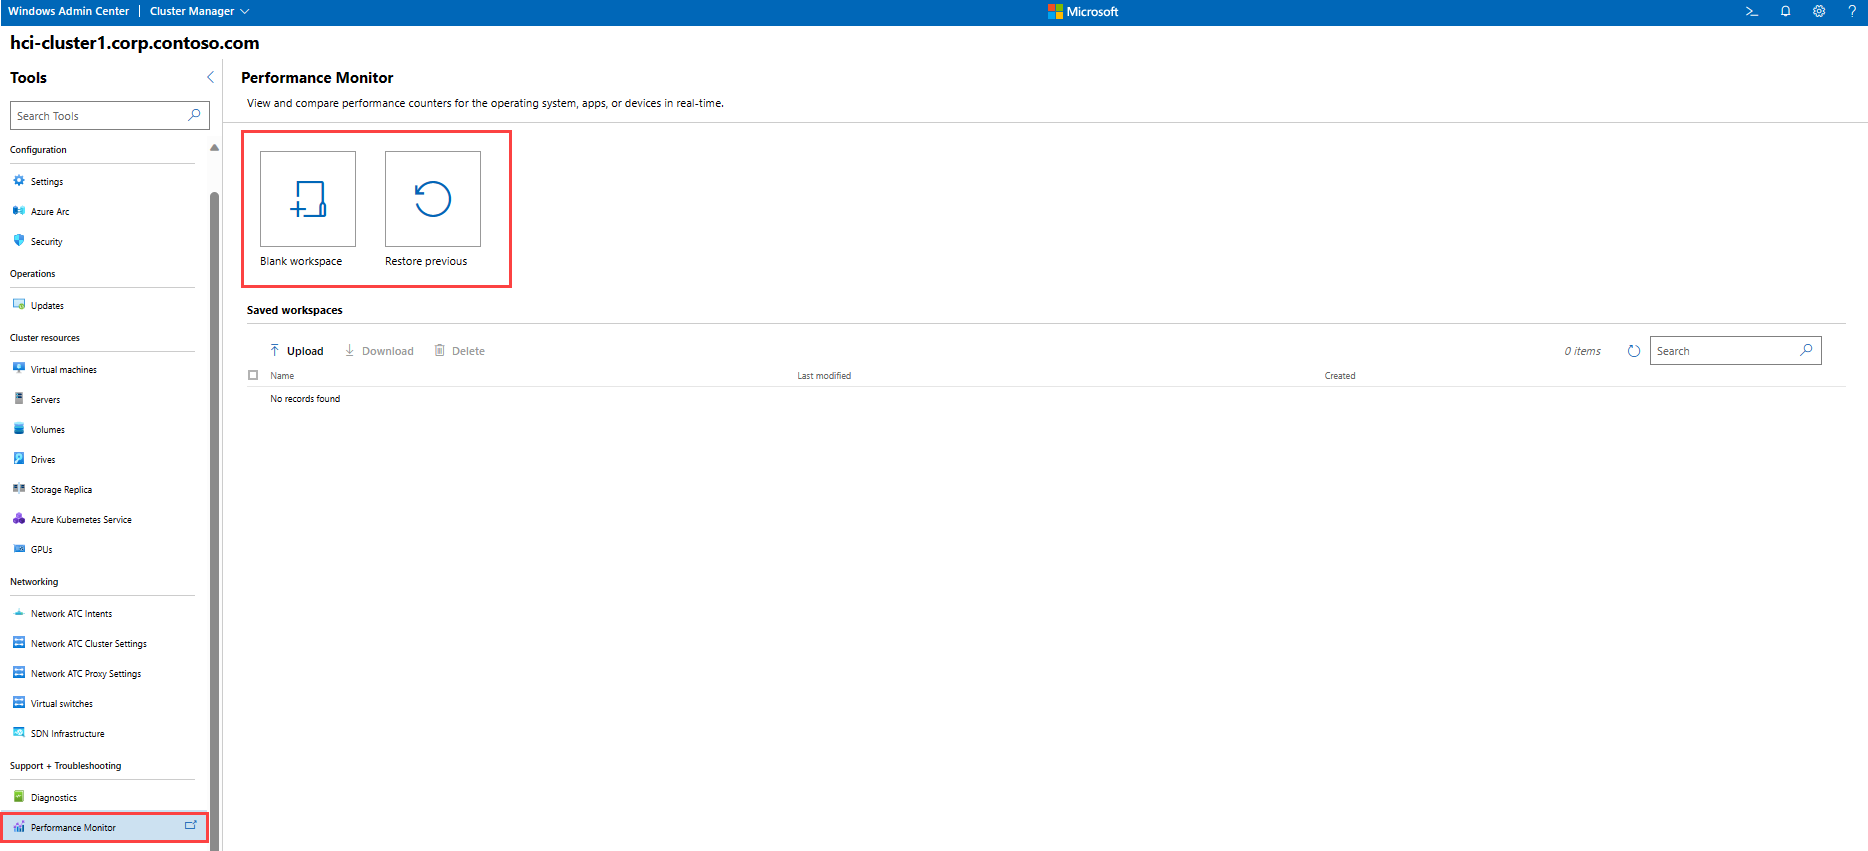
Add counters with the Performance Monitor tool
Use the Performance Monitor tool in Windows Admin Center to view and compare performance counters for Windows, apps, or devices in real-time.
Select Performance Monitor from the Tools menu on the left.
Select Blank workspace to start a new workspace, or Restore previous to restore a previous workspace.
If creating a new workspace, select the Add counter button and select one or more source servers to monitor, or select the entire cluster.
Select the object and instance you wish to monitor, as well as the counter and graph type to view dynamic performance information.
Save the workspace by choosing Save > Save As from the top menu.

Query and process performance history with PowerShell
You can also monitor Azure Stack HCI clusters using PowerShell cmdlets that return information about the cluster and its components. See Performance history for Storage Spaces Direct.
Use the Health Service feature
Any Health Service fault on the cluster should be investigated. See Health Service in Windows Server to learn how to run reports and identify faults.
Troubleshoot health and operational states
To understand the health and operational states of storage pools, virtual disks, and drives, see Troubleshoot Storage Spaces and Storage Spaces Direct health and operational states.
Monitor performance using storage QoS
Storage Quality of Service (QoS) provides a way to centrally monitor and manage storage I/O for VMs to mitigate noisy neighbor issues and provide consistent performance. See Storage Quality of Service.
Monitor from Azure portal
You can Monitor Azure Stack HCI clusters from Azure portal and use Azure Stack HCI Insights to monitor cluster health, performance, and usage.
Next steps
For related information, see also:
Feedback
Coming soon: Throughout 2024 we will be phasing out GitHub Issues as the feedback mechanism for content and replacing it with a new feedback system. For more information see: https://aka.ms/ContentUserFeedback.
Submit and view feedback for