Azure Resource Manager metrics in Azure Monitor
When you create and manage resources in Azure, your requests are orchestrated through Azure's control plane, Azure Resource Manager. This article describes how to monitor the volume and latency of control plane requests made to Azure.
With these metrics, you can observe traffic and latency for control plane requests throughout your subscriptions. For example, you can now figure out when your requests have been throttled or failed by filtering for specific status codes by examining throttled requests and examining server errors.
The metrics are available for up to three months (93 days) and only track synchronous requests. For a scenario like a VM creation, the metrics do not represent the performance or reliability of the long running asynchronous operation.
Accessing Azure Resource Manager metrics
You can access control plane metrics via the Azure Monitor REST APIs, SDKs, and the Azure portal (by selecting the "Azure Resource Manager" metric). For an overview on Azure Monitor, see Azure Monitor Metrics.
There is no opt-in or sign-up process to access control plane metrics.
For guidance on how to retrieve a bearer token and make requests to Azure, see Azure REST API reference.
Metric definition
The definition for Azure Resource Manager metrics in Azure Monitor is only accessible through the 2017-12-01-preview API version. To retrieve the definition, you can run the following snippet, with your subscription ID replacing "00000000-0000-0000-0000-000000000000":
curl --location --request GET 'https://management.azure.com/subscriptions/00000000-0000-0000-0000-000000000000/providers/microsoft.insights/metricDefinitions?api-version=2017-12-01-preview&metricnamespace=microsoft.resources/subscriptions' \
--header 'Authorization: bearer {{bearerToken}}'
This snippet returns the definition for the metrics schema. Notably, this schema includes the dimensions you can filter on with the Monitor API:
| Dimension Name | Description |
|---|---|
| ResourceUri | The full Resource ID for a particular resource. |
| RequestRegion | The Azure Resource Manager region where your control plane requests land, like "EastUS2". This region is not the resource's location. |
| StatusCode | Response type from Azure Resource Manager for your control plane request. Possible values are (but not limited to): - 0 - 200 - 201 - 400 - 404 - 429 - 500 - 502 |
| StatusCodeClass | The class for the status code returned from Azure Resource Manager. Possible values are: - 2xx - 4xx - 5xx |
| Namespace | The namespace for the Resource Provider, in all caps, like "MICROSOFT.COMPUTE" |
| ResourceType | Any resource type in Azure that you have created or sent a request to, in all caps, like "VIRTUALMACHINES" |
| Method | The HTTP method used in the request made to Azure Resource Manager. Possible values are: - GET - HEAD - PUT - POST - PATCH - DELETE |
Examples
Now, let's look at some scenarios that can help you exploring Azure Resource Manager metrics.
Query traffic and latency control plane metrics via Azure portal
First, navigate to the Azure Monitor blade within the portal:
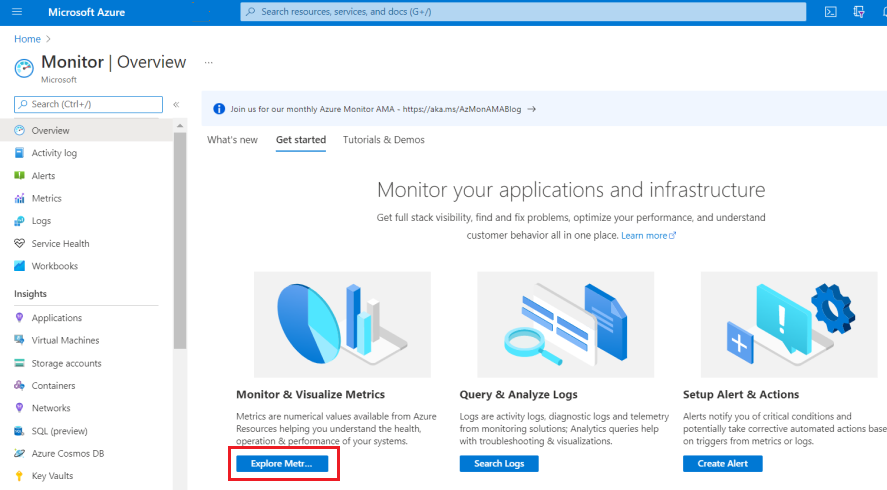
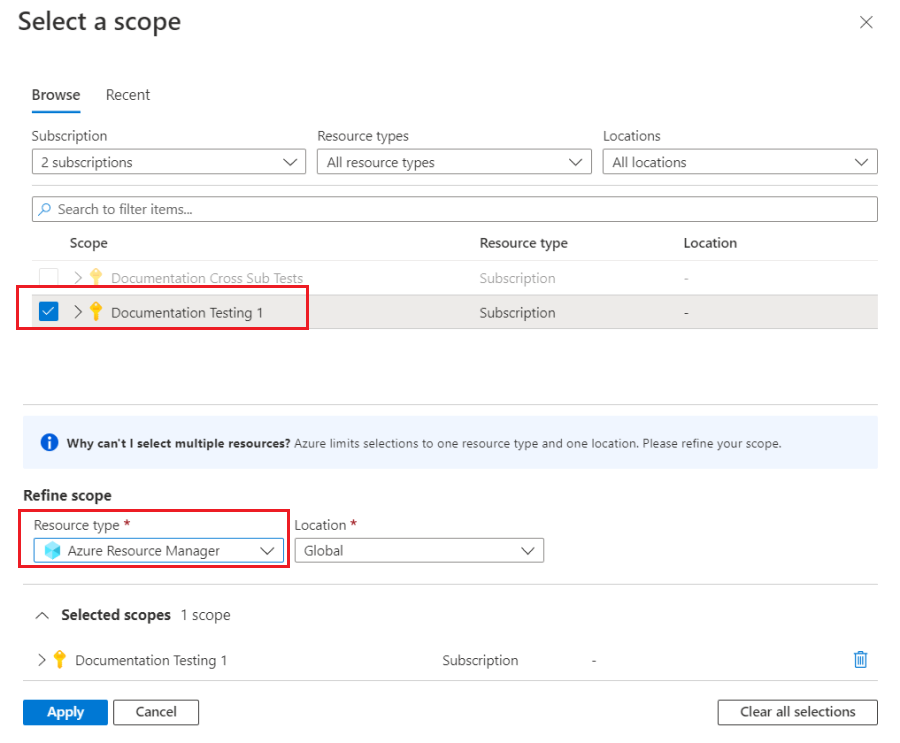
After selecting Explore Metrics, select a single subscription and then select the Azure Resource Manager metric:
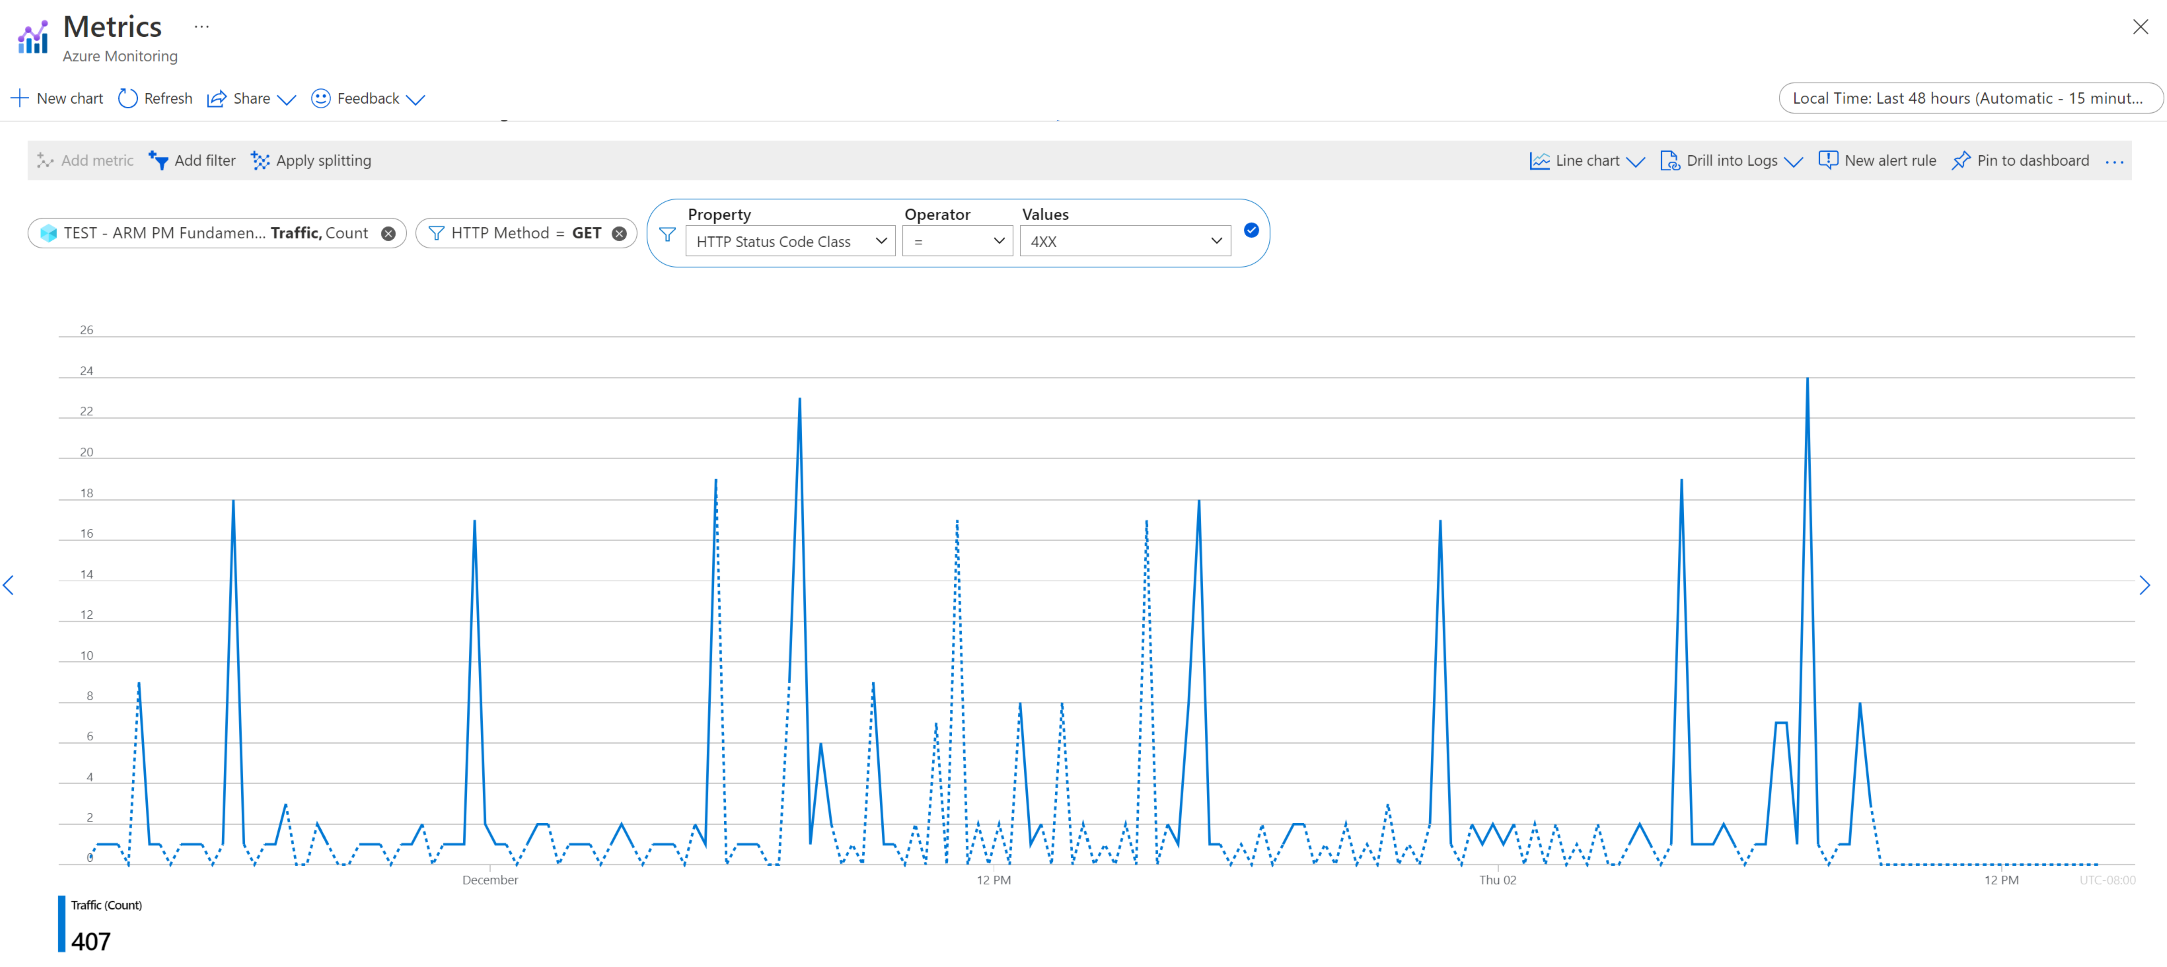
Then, after selecting Apply, you can visualize your Traffic or Latency control plane metrics with custom filtering and splitting:
Query traffic and latency control plane metrics via REST API
After you are authenticated with Azure, you can make a request to retrieve control plane metrics for your subscription. In the script, replace "00000000-0000-0000-0000-000000000000" with your subscription ID. The script will retrieve the average request latency (in seconds) and the total request count for the two day timespan, broken down by one day intervals:
curl --location --request GET "https://management.azure.com/subscriptions/00000000-0000-0000-0000-000000000000/providers/microsoft.insights/metrics?api-version=2021-05-01&interval=P1D&metricnames=Latency&metricnamespace=microsoft.resources/subscriptions®ion=global&aggregation=average,count×pan=2021-11-01T00:00:00Z/2021-11-03T00:00:00Z" \
--header "Authorization: bearer {{bearerToken}}"
In the case of Azure Resource Manager metrics, you can retrieve the traffic count by using the Latency metric and including the 'count' aggregation. You'll see a JSON response for the request:
{
    "cost": 5758,
    "timespan": "2021-11-01T00:00:00Z/2021-11-03T00:00:00Z",
    "interval": "P1D",
    "value": [
        {
            "id": "subscriptions/00000000-0000-0000-0000-000000000000/providers/Microsoft.Insights/metrics/Latency",
            "type": "Microsoft.Insights/metrics",
            "name": {
                "value": "Latency",
                "localizedValue": "Latency"
            },
            "displayDescription": "Latency data for all requests to Azure Resource Manager",
            "unit": "Seconds",
            "timeseries": [
                {
                    "metadatavalues": [],
                    "data": [
                        {
                            "timeStamp": "2021-11-01T00:00:00Z",
                            "count": 1406.0,
                            "average": 0.19345163584637273
                        },
                        {
                            "timeStamp": "2021-11-02T00:00:00Z",
                            "count": 1517.0,
                            "average": 0.28294792353328935
                        }
                    ]
                }
            ],
            "errorCode": "Success"
        }
    ],
    "namespace": "microsoft.resources/subscriptions",
    "resourceregion": "global"
}
If you want to retrieve only the traffic count, then you can utilize the Traffic metric with the 'count' aggregation:
curl --location --request GET 'https://management.azure.com/subscriptions/00000000-0000-0000-0000-000000000000/providers/microsoft.insights/metrics?api-version=2021-05-01&interval=P1D&metricnames=Traffic&metricnamespace=microsoft.resources/subscriptions®ion=global&aggregation=count×pan=2021-11-01T00:00:00Z/2021-11-03T00:00:00Z' \
--header 'Authorization: bearer {{bearerToken}}'
The response for the request is:
{
    "cost": 2879,
    "timespan": "2021-11-01T00:00:00Z/2021-11-03T00:00:00Z",
    "interval": "P1D",
    "value": [
        {
            "id": "subscriptions/00000000-0000-0000-0000-000000000000/providers/Microsoft.Insights/metrics/Traffic",
            "type": "Microsoft.Insights/metrics",
            "name": {
                "value": "Traffic",
                "localizedValue": "Traffic"
            },
            "displayDescription": "Traffic data for all requests to Azure Resource Manager",
            "unit": "Count",
            "timeseries": [
                {
                    "metadatavalues": [],
                    "data": [
                        {
                            "timeStamp": "2021-11-01T00:00:00Z",
                            "count": 1406.0
                        },
                        {
                            "timeStamp": "2021-11-02T00:00:00Z",
                            "count": 1517.0
                        }
                    ]
                }
            ],
            "errorCode": "Success"
        }
    ],
    "namespace": "microsoft.resources/subscriptions",
    "resourceregion": "global"
}
For the metrics supporting dimensions, you need to specify the dimension value to see the corresponding metrics values. For example, if you want to focus on the Latency for successful requests to ARM, you need to filter the StatusCodeClass dimension with 2XX.
If you want to look at the number of requests made in your subscription for Networking resources, like Virtual Networks and Load Balancers, you would need to filter the Namespace dimension for MICROSOFT.NETWORK.
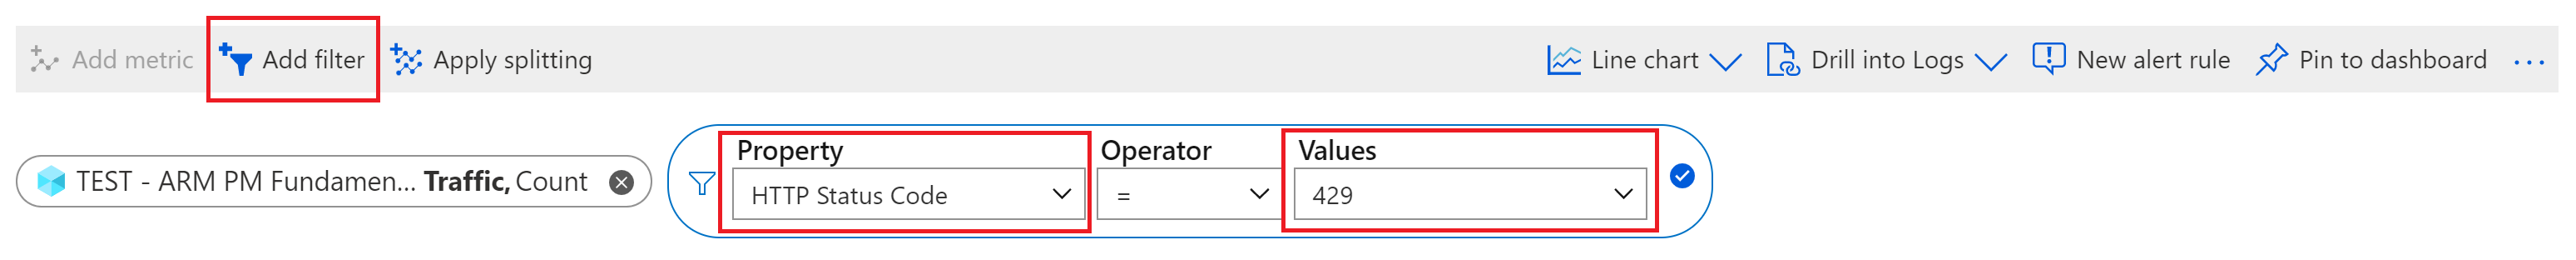
Examining Throttled Requests
To view only your throttled requests, you need to filter for 429 status code responses only. For REST API calls, filtering is accomplished via the $filter property and the StatusCode dimension by appending: $filter=StatusCode eq '429' as seen at the end of the request in the following snippet:
curl --location --request GET 'https://management.azure.com/subscriptions/00000000-0000-0000-0000-000000000000/providers/microsoft.insights/metrics?api-version=2021-05-01&interval=P1D&metricnames=Latency&metricnamespace=microsoft.resources/subscriptions®ion=global&aggregation=count,average×pan=2021-11-01T00:00:00Z/2021-11-03T00:00:00Z&$filter=StatusCode%20eq%20%27429%27' \
--header 'Authorization: bearer {{bearerToken}}'
You can also filter directly in portal:
Examining Server Errors
Similar to looking at throttled requests, you view all requests that returned a server error response code by filtering 5xx responses only. For REST API calls, filtering is accomplished via the $filter property and the StatusCodeClass dimension by appending: $filter=StatusCodeClass eq '5xx' as seen at the end of the request in the following snippet:
curl --location --request GET 'https://management.azure.com/subscriptions/00000000-0000-0000-0000-000000000000/providers/microsoft.insights/metrics?api-version=2021-05-01&interval=P1D&metricnames=Latency&metricnamespace=microsoft.resources/subscriptions®ion=global&aggregation=count,average×pan=2021-11-01T00:00:00Z/2021-11-03T00:00:00Z&$filter=StatusCodeClass%20eq%20%275xx%27' \
--header 'Authorization: bearer {{bearerToken}}'
You can also accomplish generic server errors filtering within portal by setting the filter property to 'StatusCodeClass' and the value to '5xx', similar to what was done in the throttling example.
Next steps
Feedback
Coming soon: Throughout 2024 we will be phasing out GitHub Issues as the feedback mechanism for content and replacing it with a new feedback system. For more information see: https://aka.ms/ContentUserFeedback.
Submit and view feedback for