Use your Kanban board
Azure DevOps Services | Azure DevOps Server 2022 - Azure DevOps Server 2019
Kanban boards provide an intuitive and visual way to manage your projects, track work items, and collaborate with your team effectively. If you have a project, you already have a Kanban board. Let's get started!
In this article, learn how to:
- Open your Kanban board
- Map the flow of how your team works
- Set work in progress limits
- Track work in progress
- Add work items
- Update work item status
- Update card fields
- Filter your board
- Invite others to work on your board
- Monitor metrics
Note
You can only create or add Kanban boards to a project by adding another team. Kanban boards only get created when a project or team gets created. For more information, see About teams and Agile tools.
Prerequisites
Boards are automatically created when you create a project or add a team. Each team has access to their own product and portfolio boards as described in About teams and Agile tools.
- You must connect to a project. If you don't have a project yet, create one.
- You must be added to a team or project.
- To add work items and exercise all board features, you must be granted Basic access or higher.
- To view or modify work items, your View work items in this node and Edit work items in this node permissions set to Allow. By default, the Contributors group has this permission set. For more information, see Set permissions and access for work tracking.
- Users with Stakeholder access for a private project can add work items and update status through drag-and-drop, but cannot update fields displayed on cards. They can add tasks and change task status.
- Users with Stakeholder access for a public project have full access to board features just like users with Basic access.
- You must connect to a project. If you don't have a project yet, create one.
- You must be added to a team or project.
- To add work items and exercise all board features, you must be granted Basic access or higher.
- To view or modify work items, your View work items in this node and Edit work items in this node permissions set to Allow. By default, the Contributors group has this permission set. For more information, see Set permissions and access for work tracking.
- Users with Stakeholder access for a private project can add work items and update status through drag-and-drop, but cannot update fields displayed on cards. They can add tasks and change task status.
- You must connect to a project. If you don't have a project yet, create one.
- You must be added to a team or project.
- To add work items and exercise all board features, you must be granted Basic access or higher.
- To view or modify work items, your View work items in this node and Edit work items in this node permissions set to Allow. By default, the Contributors group has this permission set. For more information, see Set permissions and access for work tracking.
- Users with Stakeholder access can't exercise these board features: add work items, drag-and-drop work items to update status, or update fields displayed on cards. They can add tasks and change task status.
Note
Both Kanban boards and Taskboards support visualizing the flow of work and monitoring metrics to optimize that flow. Kanban boards track requirements, are sprint-independent, and provide a cumulative flow chart for monitoring progress. Each sprint is associated with a Taskboard that supports tracking tasks defined for the sprint. You can monitor progress through capacity charts and the sprint burndown chart. For guidance on using the Taskboard, see Update and monitor your Taskboard.
Open your Kanban board from the web portal
Your Kanban board is one of two types of boards available to you. The other is the sprint Taskboard. Kanban boards track requirements, are sprint-independent, and provide a cumulative flow chart for monitoring progress. Each sprint is associated with a Taskboard that supports tracking tasks defined for the sprint. You can monitor progress through capacity charts and the sprint burndown chart. For guidance on using the Taskboard, see Update and monitor your Taskboard. For an overview of the features supported on each backlog and board, see Backlogs, boards, and plans.
Check that you selected the right project, and select Boards > Boards. Then select the correct team from the team selector menu.
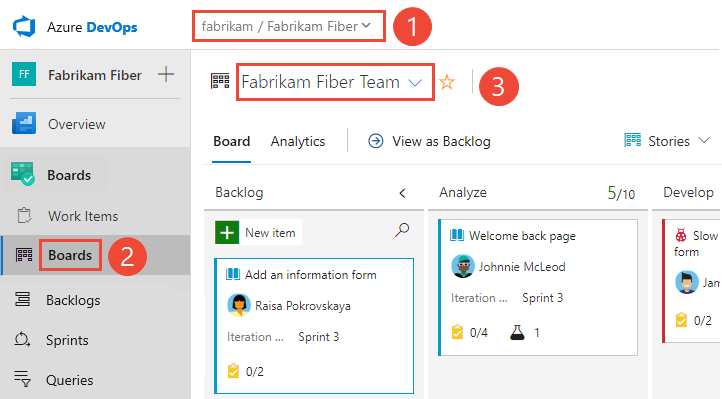
To select another team's board, open the selector. Then select a different team, or select the
 Browse all team boards option. Or, you can enter a keyword in the search box to filter the list of team backlogs for the project.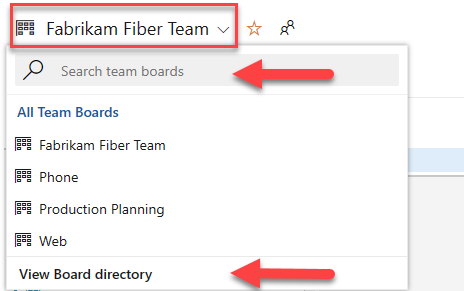
Tip
Select the
 star icon to make a team board a favorite. Favorite artifacts (
 favorite icon) appear at the top of the team selector list.
Check that you selected Backlog items for Scrum, Stories for Agile, or Requirements for CMMI as the backlog level.

To switch to the product backlog, select Stories backlog. To switch to a Taskboard, see Update and monitor your Taskboard.
Check that you selected the right project, and select Boards > Boards. Then select the correct team from the team selector menu.
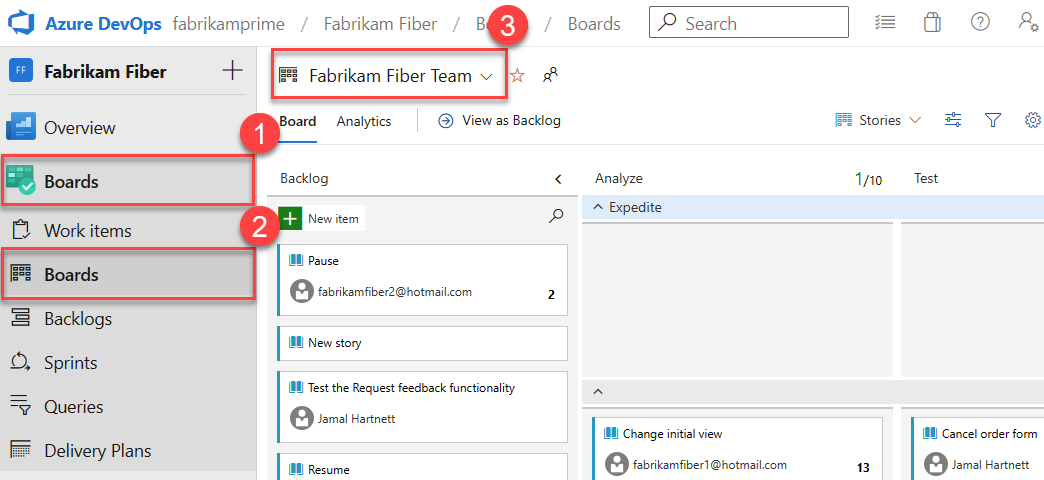
To select another team's board, open the selector. Then select a different team, or select the
Browse all team boards option. Or, you can enter a keyword in the search box to filter the list of team backlogs for the project.Tip
Select the
star icon to make a team board a favorite. Favorite artifacts (
favorite icon) appear at the top of the team selector list.Check that you selected Backlog items for Scrum, Stories for Agile, or Requirements for CMMI as the backlog level.
To switch to the product backlog, select Stories backlog. To switch to a Taskboard, see Update and monitor your Taskboard.
Map the flow of how your team works
When you first open your Kanban board, you have one column for each workflow state. Your actual columns vary based on the process used to create your project.
Identify your team's workflow stages, which most likely don't map to the default states. For your team to have a functional board, configure the board to match your workflow stages.
For example, for user stories, the New, Active, Resolved, and Closed states track progress from idea to completion.
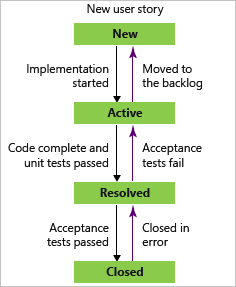
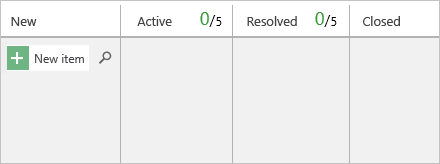
Manage your Kanban columns, so they match your workflow stages. Keep the number of columns to a minimum while still representing the key handoffs that occur for your team.
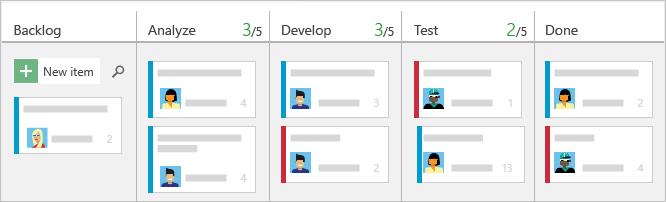
Set WIP limits
Set WIP limits for each workflow stage, so that when work items exceed the limit, the column count displays as red. Teams can use this color as a signal to focus immediately on activities to bring the number of items in the column down. For more information, see Set WIP limits.
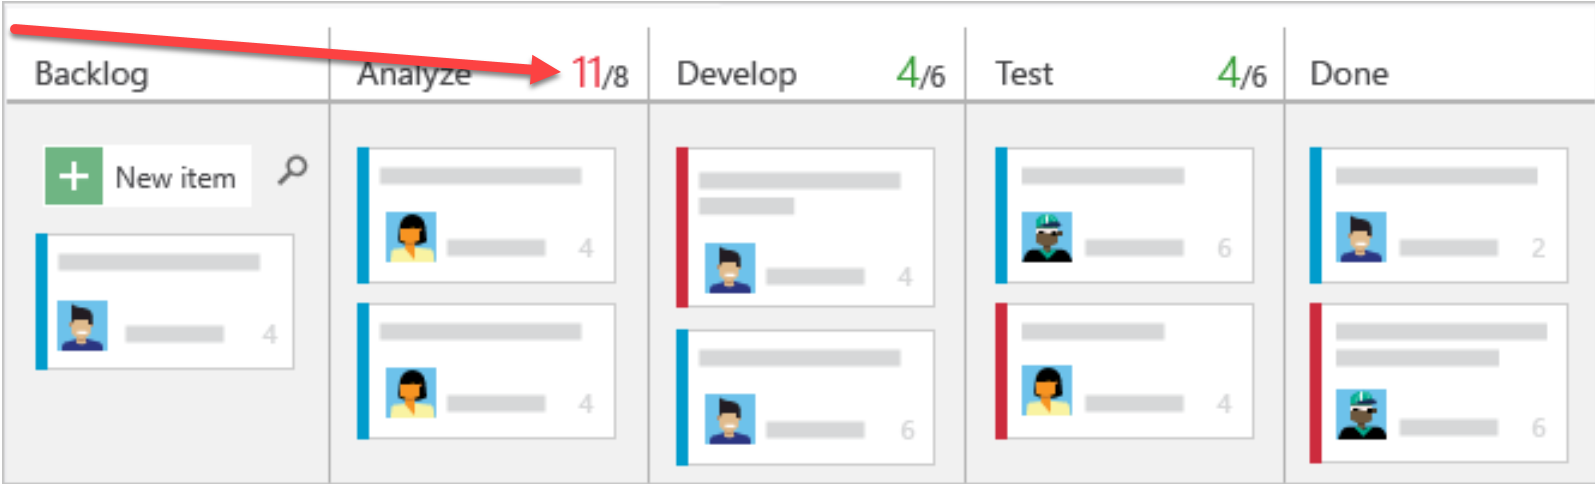
Track work in progress
See the estimated size of work for each item that displays at the bottom right of each card. Add items to your backlog in the first column. When priorities change, move items up and down within a column. And, as work completes in one stage, update the status of an item by moving it to a downstream stage.
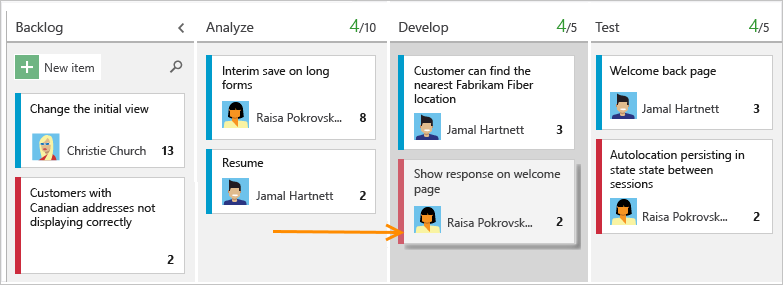
Update your Kanban board as work progresses to help keep your team in sync. Also, you can see and share the value stream your team is delivering to customers.
Important
Work items that appear on more than one team's Kanban board can yield results that don't meet your expectations because each team can customize its Kanban board columns and swimlanes. The values assigned to Kanban Board Column, Board Column Done, and Board Lane fields might differ from what you expect when another team updates the work item from a different board. For more information, see Add, review, and update work items in Azure Boards.
Add work items
To add a work item, select the  plus sign, enter a title, and then select Enter.
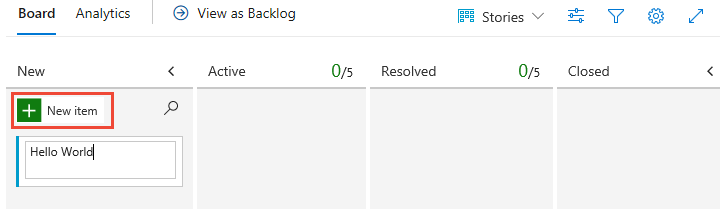
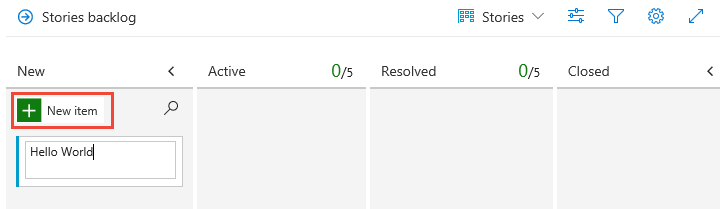
The system automatically saves the work item with the title you entered. You can add as many work items you want by using this method.
To add details to any work item, select the title. Or, you can directly modify any field that displays. For example, you can reassign a work item by selecting Assigned To. For a description of each field, see Create your backlog, Add details and estimates. You can also add tasks or child items as checklists on your cards.
Note
You can only assign work to a single user. If you need to assign work to more than one user, add a work item for each user and distinguish the work to be done by title and description. The Assigned To field only accepts user accounts that have been added to a project or team.
Update work item status
As work completes in one stage, update the status of an item by dragging it to a downstream stage.
Note
Completed or closed work items don't display on the backlogs and boards after their Changed Date value is greater than 183 days (about a half a year). You can still list these items by using a query. If you want them to show up on a backlog or board, you can make a minor change to them, which resets the clock.
Note
Completed or closed work items don't display on the backlogs and boards after their Changed Date value is greater than a year old. You can still list these items by using a query. If you want them to show up on a backlog or board, you can make a minor change to them, which resets the clock.
Note
Users assigned Stakeholder access can't use the drag-and-drop feature to update status.
Update card fields
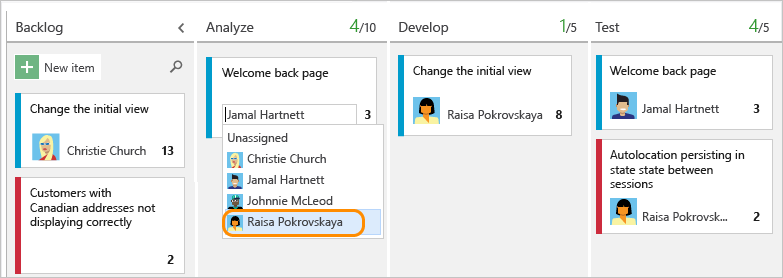
You can quickly update a field or reassign ownership directly from the board. If the field you want to update isn't showing, then customize the card, so it displays. For more information, see Customize cards.
Filter your board with keywords, field values, or tags
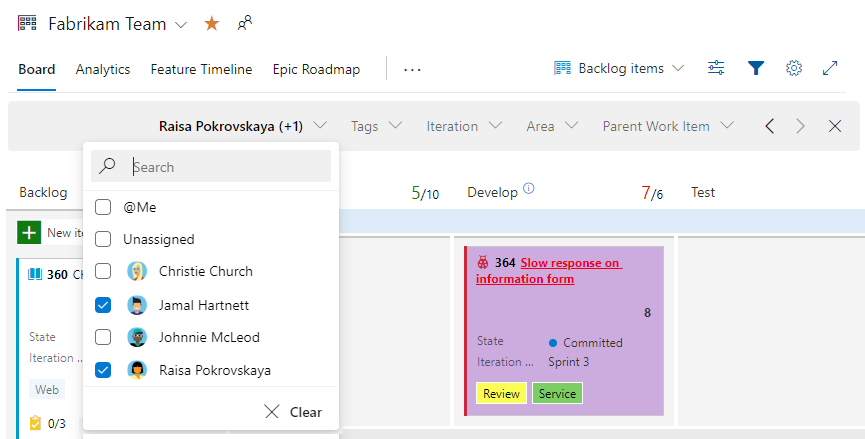
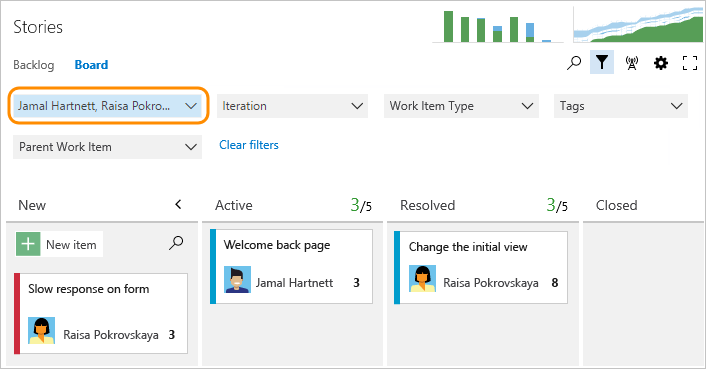
You can apply filters interactively to focus on a subset of work. For example, you can filter the board to focus on work assigned to at team member for a specific sprint. To start filtering, choose Filter  . For more information, see Filter your backlogs, boards, and plans.
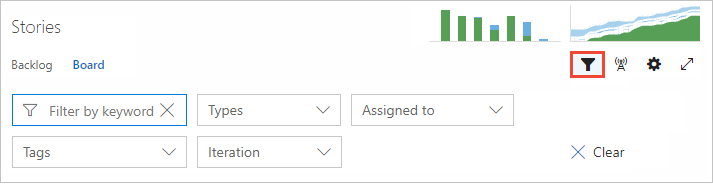
In the following example image, we filtered all items assigned to Jamal and Raisa.
Invite others to work on your Kanban board
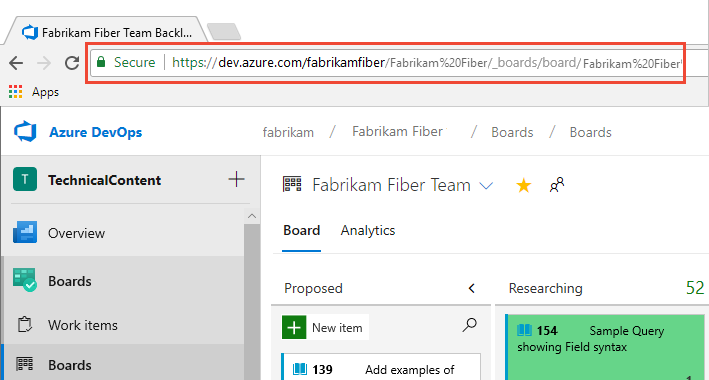
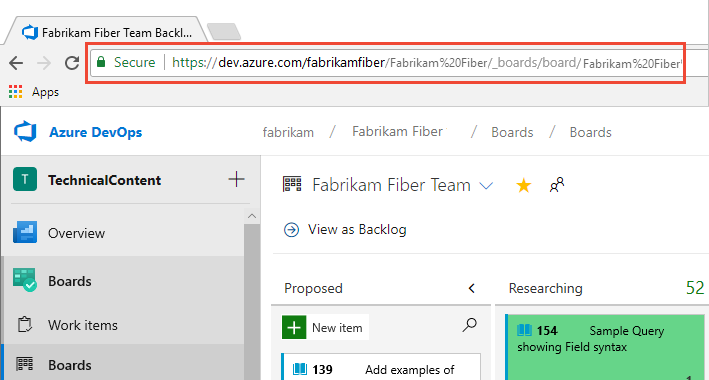
All members of a project can view and contribute to your Kanban board. To invite users to contribute, copy the URL of your Kanban board and send it to those users.
To add users to your project, see Add users to a project.
Monitor metrics
As with most Agile practices, Kanban encourages monitoring key metrics to fine tune your processes. After your team uses the Kanban board for several weeks, check out your Cumulative Flow Diagram (CFD).
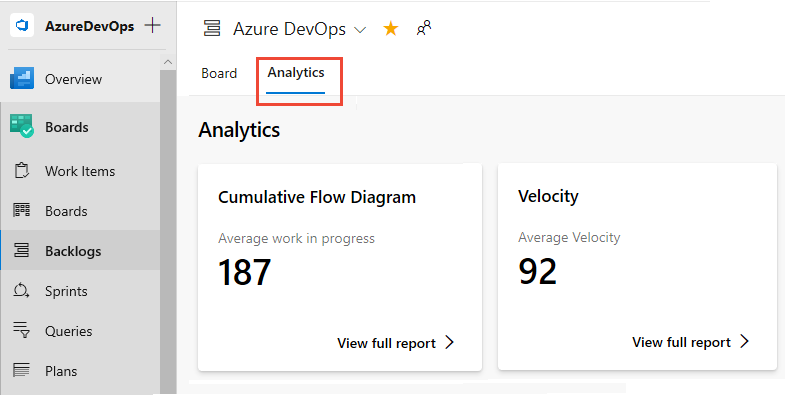
Choose the Analytics tab, and then choose View full report for the CFD as shown in the following image.
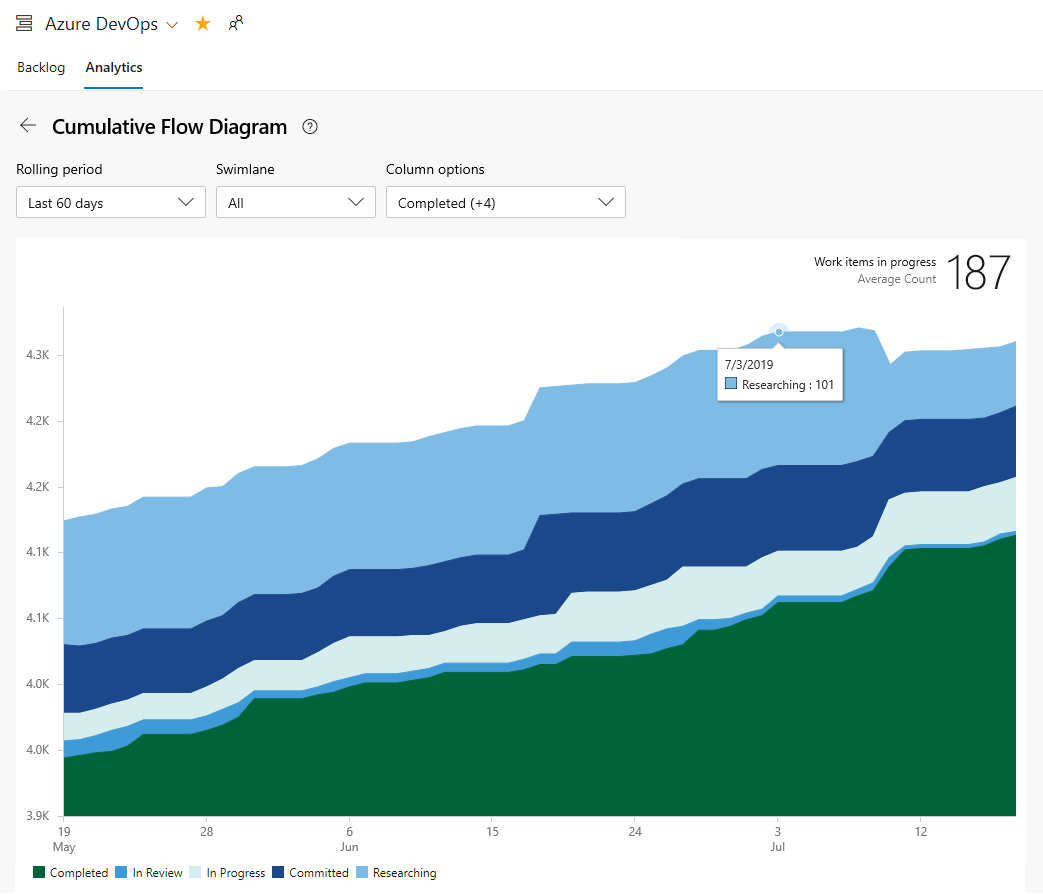
Use the interactive controls to choose the time frame, swimlanes, and workflow states or Kanban board columns.
Hover over a point in time to show how many work items are in a particular state.
The following example image shows that on July 3, 101 items were in a Researching state.
Tip
The selections you make only get set for you, and persist across sessions until you change them.
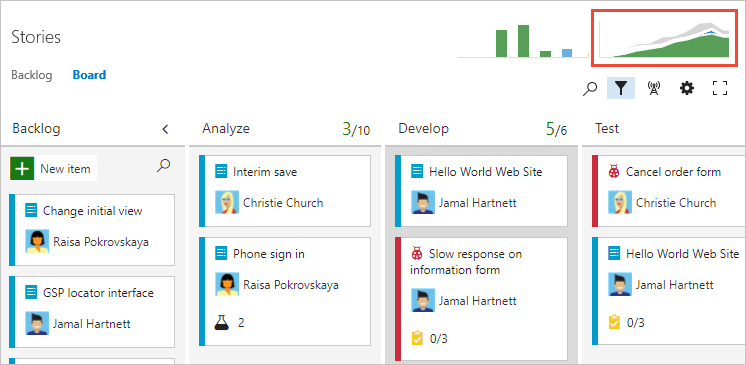
Choose the chart as shown in the following image.
The CFD shows the count of items in each Kanban column for the past 30 weeks or less. From this chart, you can gain an idea of the amount of work in progress and lead time. Work in progress counts unfinished requirements. Lead time indicates the amount of time it takes to complete a requirement from the time it was first proposed.
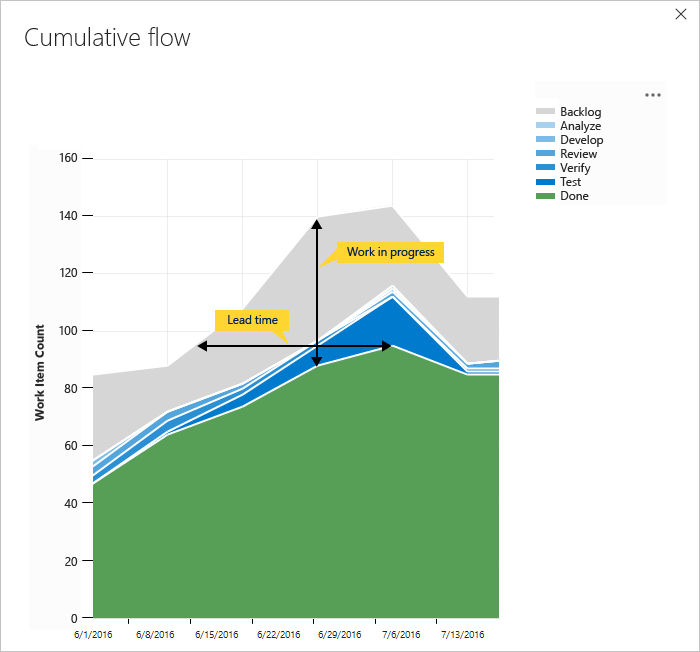
By monitoring these metrics, you can gain insight into how to optimize your processes and minimize lead time. For more information, see Configure a cumulative flow chart.
You can also add Analytics widgets to your dashboard. The Analytics Service is in preview and provides access to several widgets. For more information, see the following articles:
Can I view a Kanban board of work items defined by a query?
The Query Based Boards Marketplace extension supports viewing a flat-list query of work items as a Kanban board. The query can contain different work item types and work items defined in different projects.
Next steps
Related articles
Feedback
Coming soon: Throughout 2024 we will be phasing out GitHub Issues as the feedback mechanism for content and replacing it with a new feedback system. For more information see: https://aka.ms/ContentUserFeedback.
Submit and view feedback for