Analyze logs for Apache Kafka on HDInsight
Learn how to use Azure Monitor logs to analyze logs generated by Apache Kafka on HDInsight.
Note
This article was recently updated to use the term Azure Monitor logs instead of Log Analytics. Log data is still stored in a Log Analytics workspace and is still collected and analyzed by the same Log Analytics service. We are updating the terminology to better reflect the role of logs in Azure Monitor. See Azure Monitor terminology changes for details.
Logs location
Apache Kafka logs in the cluster are located at /var/log/kafka. Kafka logs aren't saved or persisted across cluster life cycles, regardless if managed disks are used. The following table shows the available logs.
| Log | Description |
|---|---|
| kafka.out | stdout and stderr of the Kafka process. You'll find Kafka startup and shutdown logs in this file. |
| server.log | The main Kafka server log. All Kafka broker logs end up here. |
| controller.log | Controller logs if the broker is acting as controller. |
| statechange.log | All state change events to brokers are logged in this file. |
| kafka-gc.log | Kafka Garbage Collection stats. |
Enable Azure Monitor logs for Apache Kafka
The steps to enable Azure Monitor logs for HDInsight are the same for all HDInsight clusters. Use the following links to understand how to create and configure the required services:
Create a Log Analytics workspace. For more information, see the Logs in Azure Monitor document.
Create a Kafka on HDInsight cluster. For more information, see the Start with Apache Kafka on HDInsight document.
Configure the Kafka cluster to use Azure Monitor logs. For more information, see the Use Azure Monitor logs to monitor HDInsight document.
Important
It may take around 20 minutes before data is available for Azure Monitor logs.
Query logs
From the Azure portal, select your Log Analytics workspace.
From the left menu, under General, select Logs. From here, you can search the data collected from Kafka. Enter a query in the query window and then select Run. The following are some example searches:
Disk usage:
Perf
| where ObjectName == "Logical Disk" and CounterName == "Free Megabytes" and InstanceName == "_Total" and ((Computer startswith_cs "hn" and Computer contains_cs "-") or (Computer startswith_cs "wn" and Computer contains_cs "-"))
| summarize AggregatedValue = avg(CounterValue) by Computer, bin(TimeGenerated, 1h)
CPU usage:
Perf
| where CounterName == "% Processor Time" and InstanceName == "_Total" and ((Computer startswith_cs "hn" and Computer contains_cs "-") or (Computer startswith_cs "wn" and Computer contains_cs "-"))
| summarize AggregatedValue = avg(CounterValue) by Computer, bin(TimeGenerated, 1h)
Incoming messages per second: (Replace
your_kafka_cluster_namewith your cluster name.)metrics_kafka_CL | where ClusterName_s == "your_kafka_cluster_name" and InstanceName_s == "kafka-BrokerTopicMetrics-MessagesInPerSec-Count" | summarize AggregatedValue = avg(kafka_BrokerTopicMetrics_MessagesInPerSec_Count_value_d) by HostName_s, bin(TimeGenerated, 1h)Incoming bytes per second: (Replace
wn0-kafkawith a worker node host name.)metrics_kafka_CL | where HostName_s == "wn0-kafka" and InstanceName_s == "kafka-BrokerTopicMetrics-BytesInPerSec-Count" | summarize AggregatedValue = avg(kafka_BrokerTopicMetrics_BytesInPerSec_Count_value_d) by bin(TimeGenerated, 1h)Outgoing bytes per second: (Replace
your_kafka_cluster_namewith your cluster name.)metrics_kafka_CL | where ClusterName_s == "your_kafka_cluster_name" and InstanceName_s == "kafka-BrokerTopicMetrics-BytesOutPerSec-Count" | summarize AggregatedValue = avg(kafka_BrokerTopicMetrics_BytesOutPerSec_Count_value_d) by bin(TimeGenerated, 1h)You can also enter
*to search all types logged. Currently the following logs are available for queries:Log type Description log_kafkaserver_CL Kafka broker server.log log_kafkacontroller_CL Kafka broker controller.log metrics_kafka_CL Kafka JMX metrics 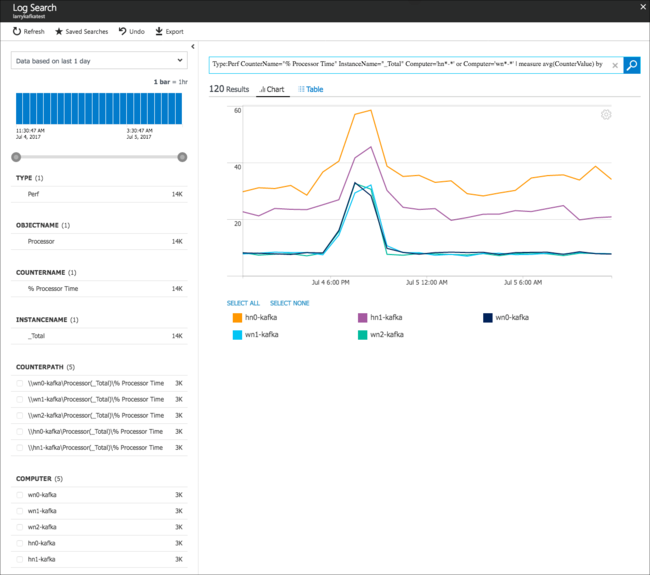
Next steps
For more information on Azure Monitor, see Azure Monitor overview, and Query Azure Monitor logs to monitor HDInsight clusters.
For more information on working with Apache Kafka, see the following documents:
Feedback
Coming soon: Throughout 2024 we will be phasing out GitHub Issues as the feedback mechanism for content and replacing it with a new feedback system. For more information see: https://aka.ms/ContentUserFeedback.
Submit and view feedback for