Using Insights to monitor and configure your Azure Load Balancer
Through Azure Monitor for networks, you're provided functional dependency visualizations and preconfigured metrics dashboard for your Load Balancers. These visuals help empower you to make informed design decisions and rapidly localize, diagnose, and resolve any faults.
Note
Please note this feature is in Preview and the functional dependency view and preconfigured dashboard may change to improve this experience
Important
The Standard Load Balancer is required to see metrics from the Load Balancer namespace in the pre-configured metrics dashboard. You will still be able to see metrics from the VM, virtual machine scale set, and Connection Monitor namespaces however, we recommend upgrading to Standard for any production workloads to take advantage of the robust set of Load Balancer metrics.
Functional dependency view
The functional dependency view enables you to picture even the most complex load balancer setups. With visual feedback on your latest Load Balancer configuration, you can make updates while keeping your configuration in mind.
You can access this view by visiting the Insights page of your Load Balancer resource in Azure.
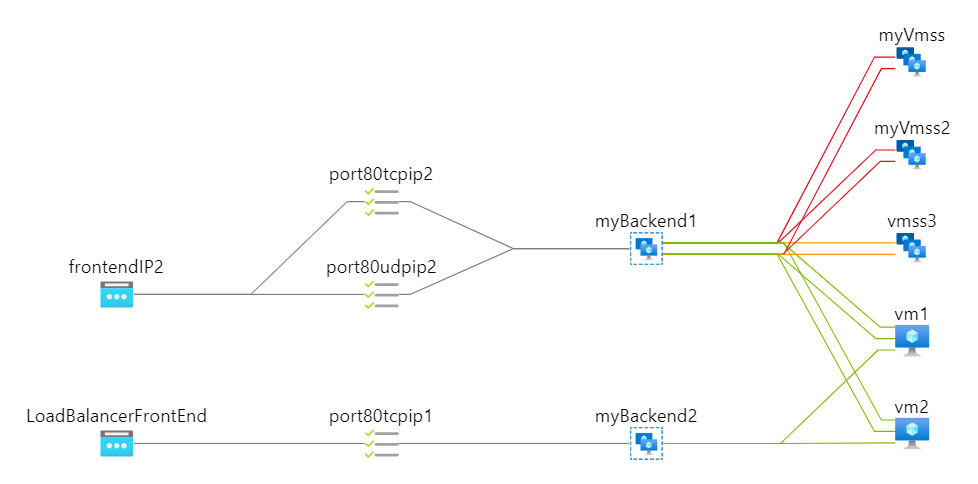
For Standard Load Balancers, your backend pool resources are color-coded with Health Probe status indicating the current availability of your backend pool to serve traffic. Alongside the above topology you're presented with a time-wise graph of health status, giving a snapshot view of the health of your application.
Metrics dashboard
From the Insights page of your Load Balancer, you can select More Detailed Metrics to view a preconfigured Azure Monitor Workbook containing metrics visuals relevant to specific aspects of your Load Balancer. This dashboard shows the Load Balancer status and links to relevant documentation at the top of the Overview tab.
You can navigate through the available tabs each of which contain visuals relevant to a specific aspect of your Load Balancer. Explicit guidance for each is available in the dashboard at the bottom of each tab.
The dashboard tabs currently available are:
- Overview
- Frontend and Backend Availability
- Data Throughput
- Flow Distribution
- Connection Monitors
- Metric Definitions
[!NOTE] Displays on the Flow Distribution tab are not supported for load balancer backend pools configured by IP addresses. These are virtual machine-level metrics and can be seen by from the virtual machines / VMSS resources associated with the IP addresses attached instead.
Overview tab
The Overview tab contains a searchable grid with the overall Data Path Availability and Health Probe Status for each of the Frontend IPs attached to your Load Balancer. These metrics indicate whether the Frontend IP is responsive and the compute instances in your Backend Pool are individually responsive to inbound connections.
You can also view the overall data throughput for each Frontend IP on this page to get a sense of whether you're producing and receive expected traffic levels. The guidance at the bottom of the page directs you to the appropriate tab should you see any irregular values.
Frontend and Backend Availability tab
The Frontend and Backend Availability tabs show the Data Path Throughput and Health Probe Status metrics presented in a few useful views. The first graph shows the aggregate value so you can determine whether there's an issue. The rest of the graphs show these metrics split by various dimensions so that you can troubleshoot and identify the sources of any inbound availability issues.
A workflow for viewing these graphs is provided at the bottom of the page with common causes for various symptoms.
Data Throughput tab
The Data Throughput tab allows you to review your inbound and outbound throughput to identify if your traffic patterns are as expected. It shows the inbound and outbound data throughput split by Frontend IP and Frontend Port so that you can identify if how the services you have running are performing individually.
Flow Distribution
The Flow Distribution Tab helps you visualize and manage the number of flows your backend instances are receiving and producing. It shows the Flow Creation Rate and Flow Count for inbound and outbound traffic as well as the Network Traffic each VM and Virtual Machine Scale Set instance is receiving.
These views can give you feedback on whether your Load Balancer configuration or traffic patterns are leading to imbalanced traffic. For example, if you have session affinity configured and a single client is making a disproportionate number of requests. It will also let you know if you're approaching the per VM flow limit for your machine size.
Connection Monitors
The Connection Monitors tab shows you the round-trip latency on a global map for all of the Connection Monitors you've configured. These visuals provide useful information for services with strict latency requirements. To meet your requirements, you may need to add other regional deployments or move to a cross-regional load balancing model
Metric Definitions
The Metric Definitions tab contains all the information shown in the Multi-dimensional Metrics article.
Next steps
- Review the dashboard and provide feedback using the below link if there's anything that can be improved
- Review the metrics documentation to ensure you understand how each metric is calculated
- Create Connection Monitors for your Load Balancer
- Create your own workbooks, you can take inspiration by clicking on the edit button in your detailed metrics dashboard
Feedback
Coming soon: Throughout 2024 we will be phasing out GitHub Issues as the feedback mechanism for content and replacing it with a new feedback system. For more information see: https://aka.ms/ContentUserFeedback.
Submit and view feedback for