Distributed tracing and correlation through Service Bus messaging
One of the common problems in micro services development is the ability to trace operation from a client through all the services that are involved in processing. It's useful for debugging, performance analysis, A/B testing, and other typical diagnostics scenarios. One part of this problem is tracking logical pieces of work. It includes message processing result and latency and external dependency calls. Another part is correlation of these diagnostics events beyond process boundaries.
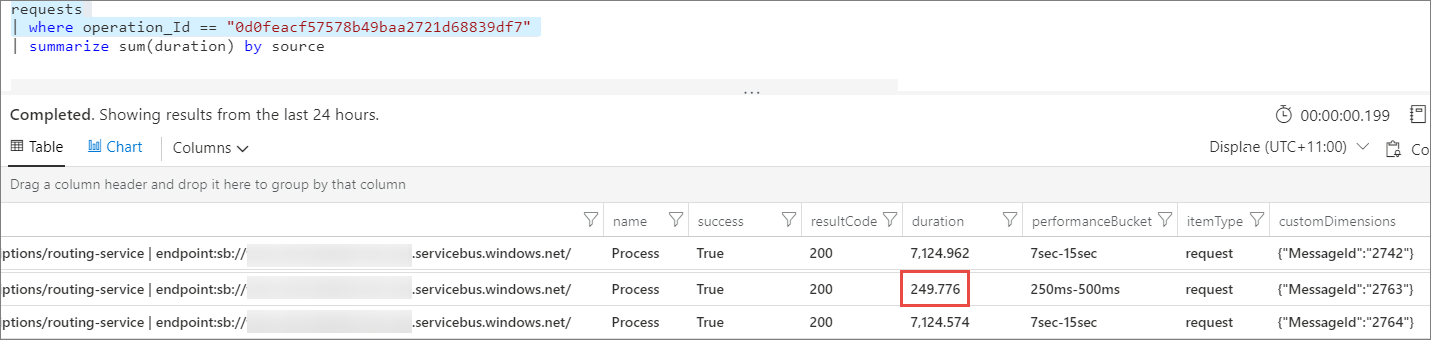
When a producer sends a message through a queue, it typically happens in the scope of some other logical operation, initiated by some other client or service. The same operation is continued by consumer once it receives a message. Both producer and consumer (and other services that process the operation), presumably emit telemetry events to trace the operation flow and result. In order to correlate such events and trace operation end-to-end, each service that reports telemetry has to stamp every event with a trace context.
Microsoft Azure Service Bus messaging has defined payload properties that producers and consumers should use to pass such trace context. The protocol is based on the W3C Trace-Context.
| Property Name | Description |
|---|---|
| Diagnostic-Id | Unique identifier of an external call from producer to the queue. Refer to W3C Trace-Context traceparent header for the format |
Service Bus .NET Client autotracing
The ServiceBusProcessor class of Azure Messaging Service Bus client for .NET provides tracing instrumentation points that can be hooked by tracing systems, or piece of client code. The instrumentation allows tracking all calls to the Service Bus messaging service from client side. If message processing is done by using ProcessMessageAsync of ServiceBusProcessor (message handler pattern), the message processing is also instrumented.
Tracking with Azure Application Insights
Microsoft Application Insights provides rich performance monitoring capabilities including automagical request and dependency tracking.
Depending on your project type, install Application Insights SDK:
- ASP.NET - install version 2.5-beta2 or higher
- ASP.NET Core - install version 2.2.0-beta2 or higher. These links provide details on installing SDK, creating resources, and configuring SDK (if needed). For non-ASP.NET applications, refer to Azure Application Insights for Console Applications article.
If you use ProcessMessageAsync of ServiceBusProcessor (message handler pattern) to process messages, the message processing is also instrumented. All Service Bus calls done by your service are automatically tracked and correlated with other telemetry items. Otherwise refer to the following example for manual message processing tracking.
Trace message processing
async Task ProcessAsync(ProcessMessageEventArgs args)
{
    ServiceBusReceivedMessage message = args.Message;
    if (message.ApplicationProperties.TryGetValue("Diagnostic-Id", out var objectId) && objectId is string diagnosticId)
    {
        var activity = new Activity("ServiceBusProcessor.ProcessMessage");
        activity.SetParentId(diagnosticId);
        // If you're using Microsoft.ApplicationInsights package version 2.6-beta or higher, you should call StartOperation<RequestTelemetry>(activity) instead
        using (var operation = telemetryClient.StartOperation<RequestTelemetry>("Process", activity.RootId, activity.ParentId))
        {
            telemetryClient.TrackTrace("Received message");
            try
            {
            // process message
            }
            catch (Exception ex)
            {
                telemetryClient.TrackException(ex);
                operation.Telemetry.Success = false;
                throw;
            }

            telemetryClient.TrackTrace("Done");
        }
    }
}
In this example, request telemetry is reported for each processed message, having a timestamp, duration, and result (success). The telemetry also has a set of correlation properties. Nested traces and exceptions reported during message processing are also stamped with correlation properties representing them as 'children' of the RequestTelemetry.
In case you make calls to supported external components during message processing, they're also automatically tracked and correlated. Refer to Track custom operations with Application Insights .NET SDK for manual tracking and correlation.
If you're running any external code in addition to the Application Insights SDK, expect to see longer duration when viewing Application Insights logs.
It doesn't mean that there was a delay in receiving the message. In this scenario, the message has already been received since the message is passed in as a parameter to the SDK code. And, the name tag in the App Insights logs (Process) indicates that the message is now being processed by your external event processing code. This issue isn't Azure-related. Instead, these metrics refer to the efficiency of your external code given that the message has already been received from Service Bus.
Tracking with OpenTelemetry
Service Bus .NET Client library version 7.5.0 and later supports OpenTelemetry in experimental mode. For more information, see Distributed tracing in .NET SDK.
Tracking without tracing system
In case your tracing system doesn't support automatic Service Bus calls tracking you may be looking into adding such support into a tracing system or into your application. This section describes diagnostics events sent by Service Bus .NET client.
Service Bus .NET Client is instrumented using .NET tracing primitives System.Diagnostics.Activity and System.Diagnostics.DiagnosticSource.
Activity serves as a trace context while DiagnosticSource is a notification mechanism.
If there's no listener for the DiagnosticSource events, instrumentation is off, keeping zero instrumentation costs. DiagnosticSource gives all control to the listener:
- listener controls which sources and events to listen to
- listener controls event rate and sampling
- events are sent with a payload that provides full context so you can access and modify Message object during the event
Familiarize yourself with DiagnosticSource User Guide before proceeding with implementation.
Let's create a listener for Service Bus events in ASP.NET Core app that writes logs with Microsoft.Extension.Logger. It uses System.Reactive.Core library to subscribe to DiagnosticSource (it's also easy to subscribe to DiagnosticSource without it)
public void Configure(IApplicationBuilder app, IHostingEnvironment env, ILoggerFactory factory, IApplicationLifetime applicationLifetime)
{
    // configuration...

    var serviceBusLogger = factory.CreateLogger("Azure.Messaging.ServiceBus");

    IDisposable innerSubscription = null;
    IDisposable outerSubscription = DiagnosticListener.AllListeners.Subscribe(delegate (DiagnosticListener listener)
    {
        // subscribe to the Service Bus DiagnosticSource
        if (listener.Name == "Azure.Messaging.ServiceBus")
        {
            // receive event from Service Bus DiagnosticSource
            innerSubscription = listener.Subscribe(delegate (KeyValuePair<string, object> evnt)
            {
                // Log operation details once it's done
                if (evnt.Key.EndsWith("Stop"))
                {
                    Activity currentActivity = Activity.Current;
                    serviceBusLogger.LogInformation($"Operation {currentActivity.OperationName} is finished, Duration={currentActivity.Duration}, Id={currentActivity.Id}, StartTime={currentActivity.StartTimeUtc}");
                }
            });
        }
    });

    applicationLifetime.ApplicationStopping.Register(() =>
    {
        outerSubscription?.Dispose();
        innerSubscription?.Dispose();
    });
}
In this example, listener logs duration, result, unique identifier, and start time for each Service Bus operation.
Events
All events will have the following properties that conform with the open telemetry specification: https://github.com/open-telemetry/opentelemetry-specification/blob/master/specification/trace/api.md.
message_bus.destination– queue/topic/subscription pathpeer.address– fully qualified namespacekind– either producer, consumer, or client. Producer is used when sending messages, consumer when receiving, and client when settling.component–servicebus
All events also have Entity and Endpoint properties.
Entity- - Name of the entity (queue, topic, and so on.)Endpoint- Service Bus endpoint URL
Instrumented operations
Here's the full list of instrumented operations:
| Operation Name | Tracked API |
|---|---|
| ServiceBusSender.Send | ServiceBusSender.SendMessageAsync ServiceBusSender.SendMessagesAsync |
| ServiceBusSender.Schedule | ServiceBusSender.ScheduleMessageAsync ServiceBusSender.ScheduleMessagesAsync |
| ServiceBusSender.Cancel | ServiceBusSender.CancelScheduledMessageAsync ServiceBusSender.CancelScheduledMessagesAsync |
| ServiceBusReceiver.Receive | ServiceBusReceiver.ReceiveMessageAsync ServiceBusReceiver.ReceiveMessagesAsync |
| ServiceBusReceiver.ReceiveDeferred | ServiceBusReceiver.ReceiveDeferredMessagesAsync |
| ServiceBusReceiver.Peek | ServiceBusReceiver.PeekMessageAsync ServiceBusReceiver.PeekMessagesAsync |
| ServiceBusReceiver.Abandon | ServiceBusReceiver.AbandonMessagesAsync |
| ServiceBusReceiver.Complete | ServiceBusReceiver.CompleteMessagesAsync |
| ServiceBusReceiver.DeadLetter | ServiceBusReceiver.DeadLetterMessagesAsync |
| ServiceBusReceiver.Defer | ServiceBusReceiver.DeferMessagesAsync |
| ServiceBusReceiver.RenewMessageLock | ServiceBusReceiver.RenewMessageLockAsync |
| ServiceBusSessionReceiver.RenewSessionLock | ServiceBusSessionReceiver.RenewSessionLockAsync |
| ServiceBusSessionReceiver.GetSessionState | ServiceBusSessionReceiver.GetSessionStateAsync |
| ServiceBusSessionReceiver.SetSessionState | ServiceBusSessionReceiver.SetSessionStateAsync |
| ServiceBusProcessor.ProcessMessage | Processor callback set on ServiceBusProcessor. ProcessMessageAsync property |
| ServiceBusSessionProcessor.ProcessSessionMessage | Processor callback set on ServiceBusSessionProcessor. ProcessMessageAsync property |
Filtering and sampling
In some cases, it's desirable to log only part of the events to reduce performance overhead or storage consumption. You could log 'Stop' events only (as in preceding example) or sample percentage of the events.
DiagnosticSource provide way to achieve it with IsEnabled predicate. For more information, see Context-Based Filtering in DiagnosticSource.
IsEnabled may be called multiple times for a single operation to minimize performance impact.
IsEnabled is called in following sequence:
IsEnabled(<OperationName>, string entity, null)for example,IsEnabled("ServiceBusSender.Send", "MyQueue1"). Note there's no 'Start' or 'Stop' at the end. Use it to filter out particular operations or queues. If the callback method returnsfalse, events for the operation aren't sent.- For the 'Process' and 'ProcessSession' operations, you also receive
IsEnabled(<OperationName>, string entity, Activity activity)callback. Use it to filter events based onactivity.Idor Tags properties.
- For the 'Process' and 'ProcessSession' operations, you also receive
IsEnabled(<OperationName>.Start)for example,IsEnabled("ServiceBusSender.Send.Start"). Checks whether 'Start' event should be fired. The result only affects 'Start' event, but further instrumentation doesn't depend on it.
There's no IsEnabled for 'Stop' event.
If some operation result is exception, IsEnabled("ServiceBusSender.Send.Exception") is called. You could only subscribe to 'Exception' events and prevent the rest of the instrumentation. In this case, you still have to handle such exceptions. Since other instrumentation is disabled, you shouldn't expect trace context to flow with the messages from consumer to producer.
You can use IsEnabled also implement sampling strategies. Sampling based on the Activity.Id or Activity.RootId ensures consistent sampling across all tires (as long as it's propagated by tracing system or by your own code).
In presence of multiple DiagnosticSource listeners for the same source, it's enough for just one listener to accept the event, so there's no guarantee that IsEnabled is called.
Next steps
- Application Insights Correlation
- Application Insights Monitor Dependencies to see if REST, SQL, or other external resources are slowing you down.
- Track custom operations with Application Insights .NET SDK
Feedback
Coming soon: Throughout 2024 we will be phasing out GitHub Issues as the feedback mechanism for content and replacing it with a new feedback system. For more information see: https://aka.ms/ContentUserFeedback.
Submit and view feedback for