Azure Monitor Insights for Virtual WAN
Azure Monitor Insights for Azure Virtual WAN gives users and operators the ability to view the state and status of a Virtual WAN, presented via an autodiscovered topological map. Resource state and status overlays on the map give you a snapshot view of the overall health of the Virtual WAN. You can navigate resources on the map via one-click access to the resource configuration pages of the Virtual WAN portal.
Virtual WAN resource-level metrics are collected and presented via a pre-packaged Virtual WAN metrics workbook. The workbook shows the metrics at Virtual WAN, hub, gateway, and connection levels. This article walks you through the steps to use Azure Monitor Insights for Virtual WAN to view your Virtual WAN topology and metrics all in a single place.
Note
The Insights menu option is in the Virtual WAN portal under Monitoring. You can also access the Virtual WAN Topology and Metrics Workbook by using Azure Monitor for Networks. For more information, see Azure Monitor for Networks.
Before you begin
To complete the steps in this article, you need to have a Virtual WAN with one or more hubs. To create a Virtual WAN and a hub, follow the steps in these articles:
View VWAN topology
Go to Azure portal > Virtual WAN. In the Monitor menu in the left pane, select Insights (preview). The Insights view appears. It shows the Virtual WAN Dependency map and high-level Metrics mini workbook.
Figure 1: Monitor > Insights menu

In the Insights view, you can view the autodiscovered Virtual WAN resources. These resources include hubs, gateways, firewalls, connections and spoke virtual networks, third-party NVAs, and branches in an end-to-end Virtual WAN. For an example, see Figure 2.
The resource state and status are color-coded and overlaid on the resource icons in the map. High-level Virtual WAN metrics, like hub capacities and gateway utilization, appear on the right side of the window in a mini workbook.
Figure 2: Insights view

Dependency view
The Dependency view for Virtual WAN helps you visualize the interconnected view of all the Virtual WAN resources broadly organized into a hub-and-spoke architecture.
Figure 3: VWAN Dependency view

The Dependency view map displays the following resources as a connected graph:
- Virtual WAN hubs across the various Azure regions.
- Spoke virtual networks that are directly connected to the hub.
- VPN and Azure ExpressRoute branch sites and P2S users that are connected to each hub via their respective ExpressRoute, S2S, and P2S connections, and virtual network gateways.
- Azure firewalls (including third-party firewall proxies) deployed in a hub (secured hub).
- Third-party NVAs (network virtual appliances) that are deployed in spoke virtual networks.
The dependency map also displays indirectly connected virtual networks (virtual networks that are peered with Virtual WAN spoke virtual networks).
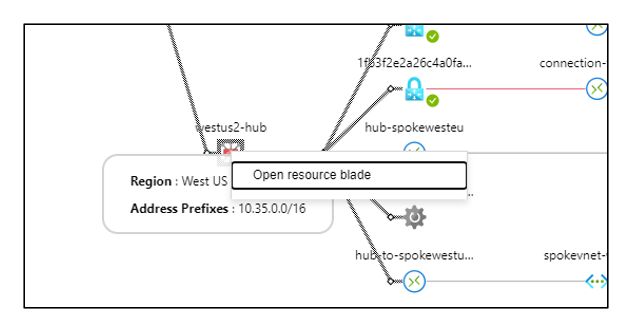
The dependency map enables easy navigation to the configuration settings of each resource. For example, you can hover over the hub resource to view the basic resource configuration, like hub region and hub prefix. Right-click to access the Azure portal page of the hub resource.
Figure 4: Navigate to resource-specific information
The search and filter bar in the Dependency view provides an easy way to search through the graph. Various filters provide help to narrow your search down to a specific path and state.
Figure 5: Search and filtering

Detailed metrics
You can select View detailed metrics to access the detailed Metrics page. The Metrics page is a dashboard that's preconfigured with separate tabs. These tabs provide insights into your Virtual WAN resource capacity, performance, and utilization at the Virtual-WAN level and hub level, and at the level of individual connections.
Figure 6: Detailed Metrics dashboard

Next steps
- To learn more, see Metrics in Azure Monitor.
- For a full description of all the Virtual WAN metrics, see Monitoring Virtual WAN data reference.
- For additional Virtual WAN monitoring information, see Monitoring Azure Virtual WAN
Feedback
Coming soon: Throughout 2024 we will be phasing out GitHub Issues as the feedback mechanism for content and replacing it with a new feedback system. For more information see: https://aka.ms/ContentUserFeedback.
Submit and view feedback for