Daily, Monthly, and Rolling Thirty Day Overview and Totals reports
Introduction
PlayFab offers a set of daily and monthly Key Performance Indicator (KPI) reports, including:
- Total Logins
- Unique Logins: Daily reports (DAU) or Monthly and Rolling Thirty Day Reports (MAU)
- New Users
- Unique Paying Users
- Transaction Revenue
- Purchases
- Total API Calls
- Total Successful API Calls
- Total API Call Errors
- Average Revenue Per User (ARPU)
- Average Revenue Per Paying User (ARPPU)
- Average Purchase Price
An Overview report contains trend charts of each metric during the past 24 hours (daily), past 30 days (rolling 30-day), and in last month (monthly).
A Totals report contains the summary of each metric shown in the overview report. Daily and Rolling Thirty Day reports are generated on a daily basis, whereas Monthly reports are generated on the first day of each month.
Report times are based on Coordinated Universal Time (UTC). For additional details on metrics, see Metrics and Terminology.
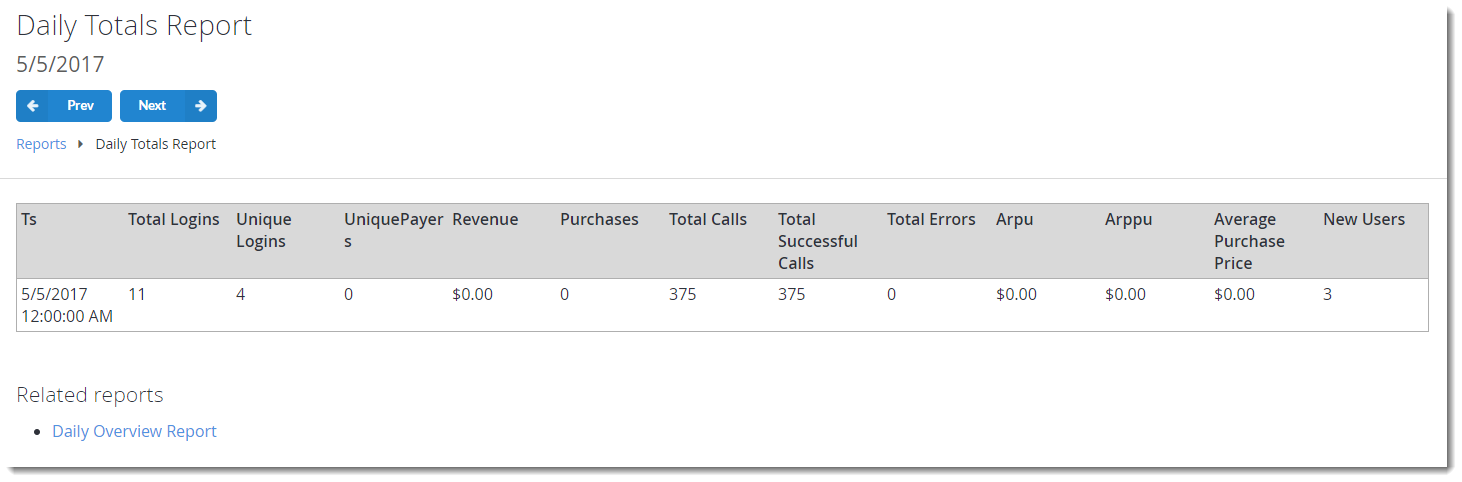
Totals reports
Totals reports include a table, which contains the 12 Key Performance metrics described in the introduction.
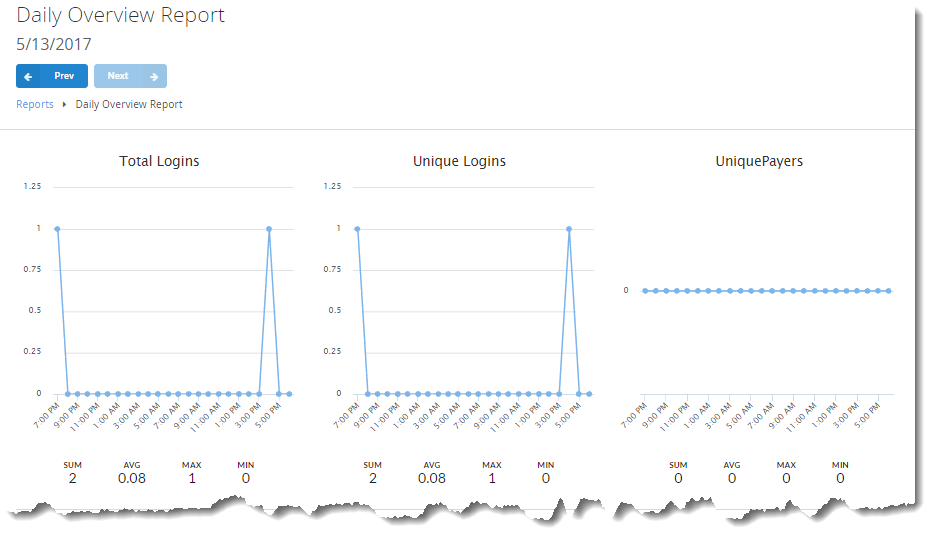
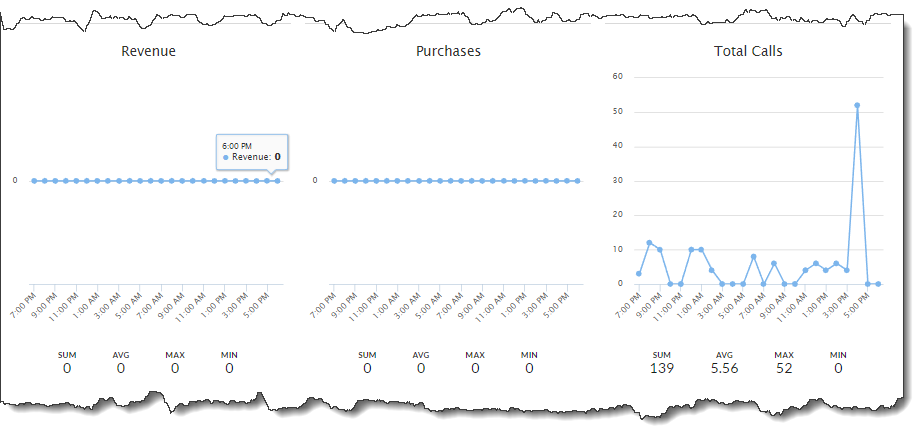
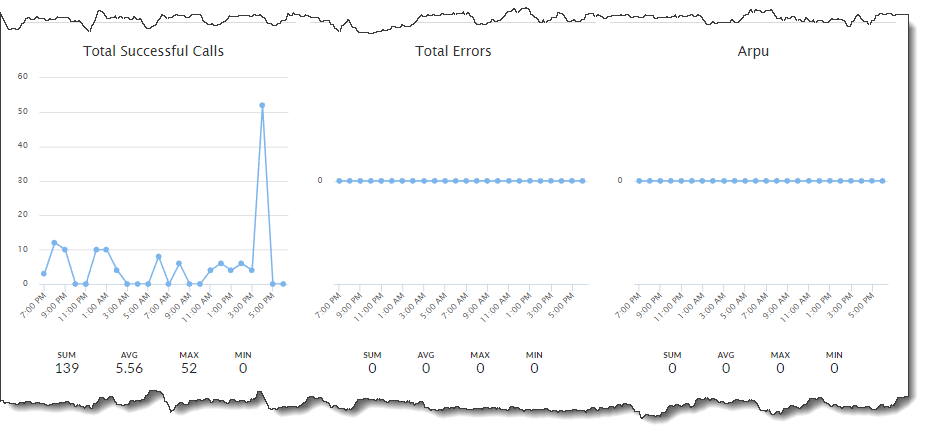
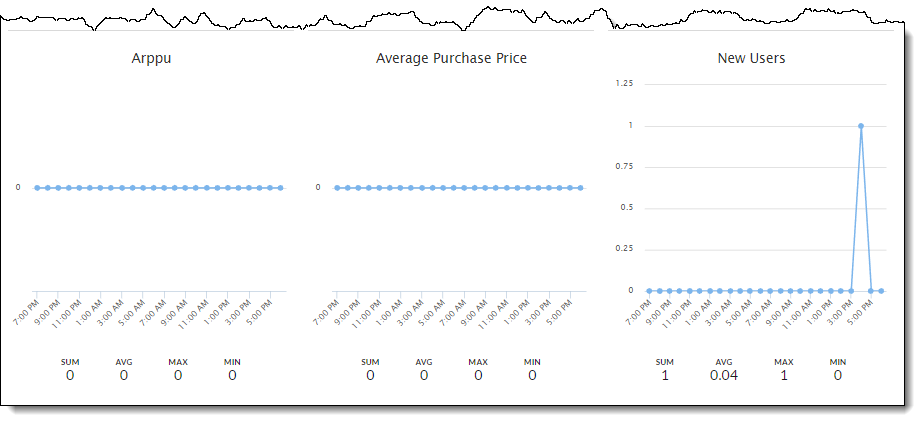
Overview reports
Overview reports consist of 12 trend charts - one for each metric described in the introduction. Working with charts is described later in this tutorial.
Populating the reports
Any API call may introduce new data for total API calls, total successful API calls, and total API call errors.
- Once executed, an API call will be added to total API calls.
- If there is an error that is introduced, it will be recorded to total API call errors.
- If no error is introduced, it will belong to total successful API calls.
Please consult our PlayFab API Reference documentation to review all available API calls.
The following API calls will introduce new data for total logins and total unique logins:
- LoginWithAndroidDeviceID
- LoginWithCustomID
- LoginWithEmailAddress
- LoginWithFacebook
- LoginWithGameCenter
- LoginWithGoogleAccount
- LoginWithIOSDeviceID
- LoginWithKongregate
- LoginWithPlayFab
- LoginWithSteam
- LoginWithTwitch
LoginWithWindowsHello
The API calls shown below will introduce new data for total new users.
- RegisterPlayFabUser
RegisterWithWindowsHello
The API calls shown below will introduce new data for total new users if the CreateAccount flag is set.
- LoginWithAndroidDeviceID
- LoginWithCustomID
- LoginWithFacebook
- LoginWithGameCenter
- LoginWithGoogleAccount
- LoginWithIOSDeviceID
- LoginWithKongregate
- LoginWithSteam
- LoginWithTwitch
The unique paying users, revenue, purchases, Average Revenue Per User (ARPU), Average Revenue Per Paying User (ARPPU) and average purchase price metrics are used to analyze purchases and payments.
See the Non-receipt Payment Processing tutorial, for more information on conducting payments.
How to work with report charts
PlayFab report charts all follow the same model:
In the top space of the page, view the report name, time period, and Prev/Next buttons to switch between the time periods.
Move your cursor along the timeline in the chart to view the associated interactive data.
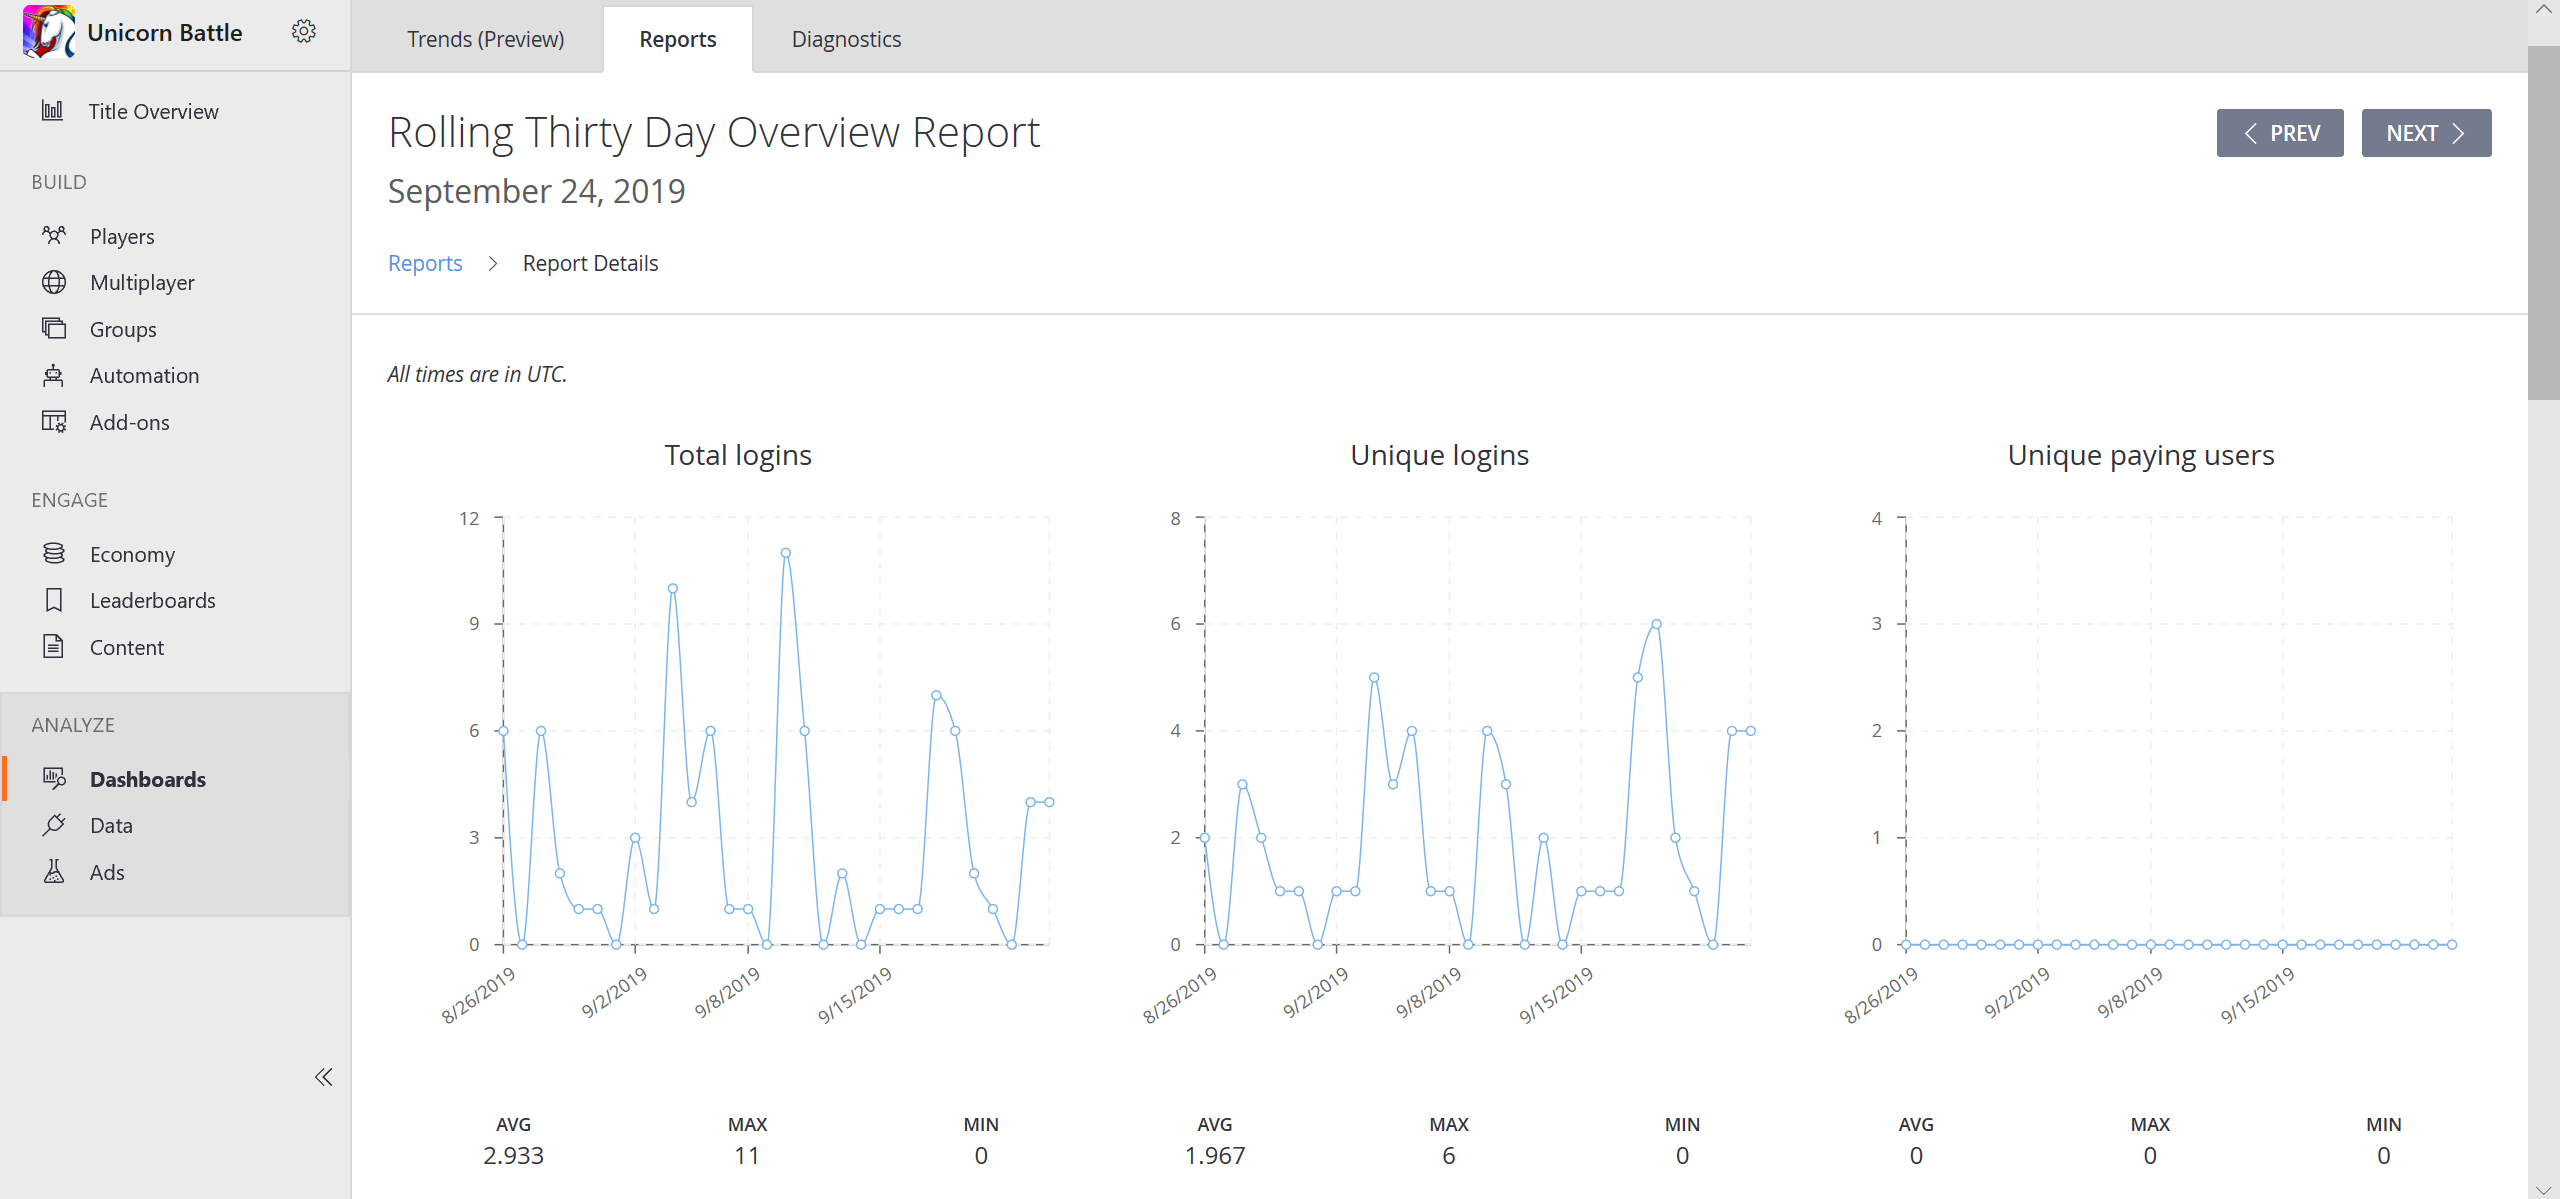
Metrics available in the chart timeline include:
- The average number of instances through all the timestamps (AVG).
- The peak value (MAX).
- The lowest value (MIN).
Feedback
Coming soon: Throughout 2024 we will be phasing out GitHub Issues as the feedback mechanism for content and replacing it with a new feedback system. For more information see: https://aka.ms/ContentUserFeedback.
Submit and view feedback for