Meetings insights score – People experiences
Check out all of our small business content on Small business help & learning.
Adoption Score provides insights into your organization's digital transformation journey through its use of Microsoft 365 and the technology experiences that support it. Your organization's score reflects people and technology experience measurements and can be compared to benchmarks from organizations similar to yours. The meetings category is part of the people experiences measures. To learn more, check out the Adoption Score overview and read Microsoft's Privacy Statement.
Note
This documentation is for the newest version of Meetings insights. If you're still using the previous version of Meetings insights, see the article for Meetings insights (Previous Version).
Prerequisites
To get started with Meetings insights, people in your organization need to be licensed for:
- Microsoft Teams
For more information, see assign licenses to users.
After people have been active in Teams at least once in the last 28 days, you'll start to see the insights.
Why your organization's meetings score matters
Meetings, where people explore ideas, plan, solve problems, and make decisions, are a fundamental pillar for organizational productivity. Research indicates that when people use online meeting tools effectively, they tend to save up to 104 minutes per week.
How we calculate the meetings score
Microsoft Teams integrates with Outlook calendar and provides a host of capabilities to make your meetings more engaging and effective. We provide an overall score for Meetings and then sub scores for each of the best practices in the Set up, Meet up and Follow up sections.
Overall score
The overall meeting score is calculated by averaging out the scores across the three phases: Set up, Meet up, and Follow up. We take into account the number of attendees and the duration of the meeting when tallying the final averaged scores.
For each meeting:
- We compute the three sub-scores (Pre, During, Post), by averaging the features, for each meeting. For example, Set Up: 30, Meet up: 40, Follow up: 20
- We then compute the average of the three sub-scores for the meeting. From the above example, 30+40+20/3 = 30
- We compute the weight of each meeting based on the meeting duration and meeting size. The longer or bigger a meeting, the more impact it has in the final score.
- We then perform a weighted sum average on scores from all meetings of the tenant based on meeting weights to compute the final meeting score for the tenant.
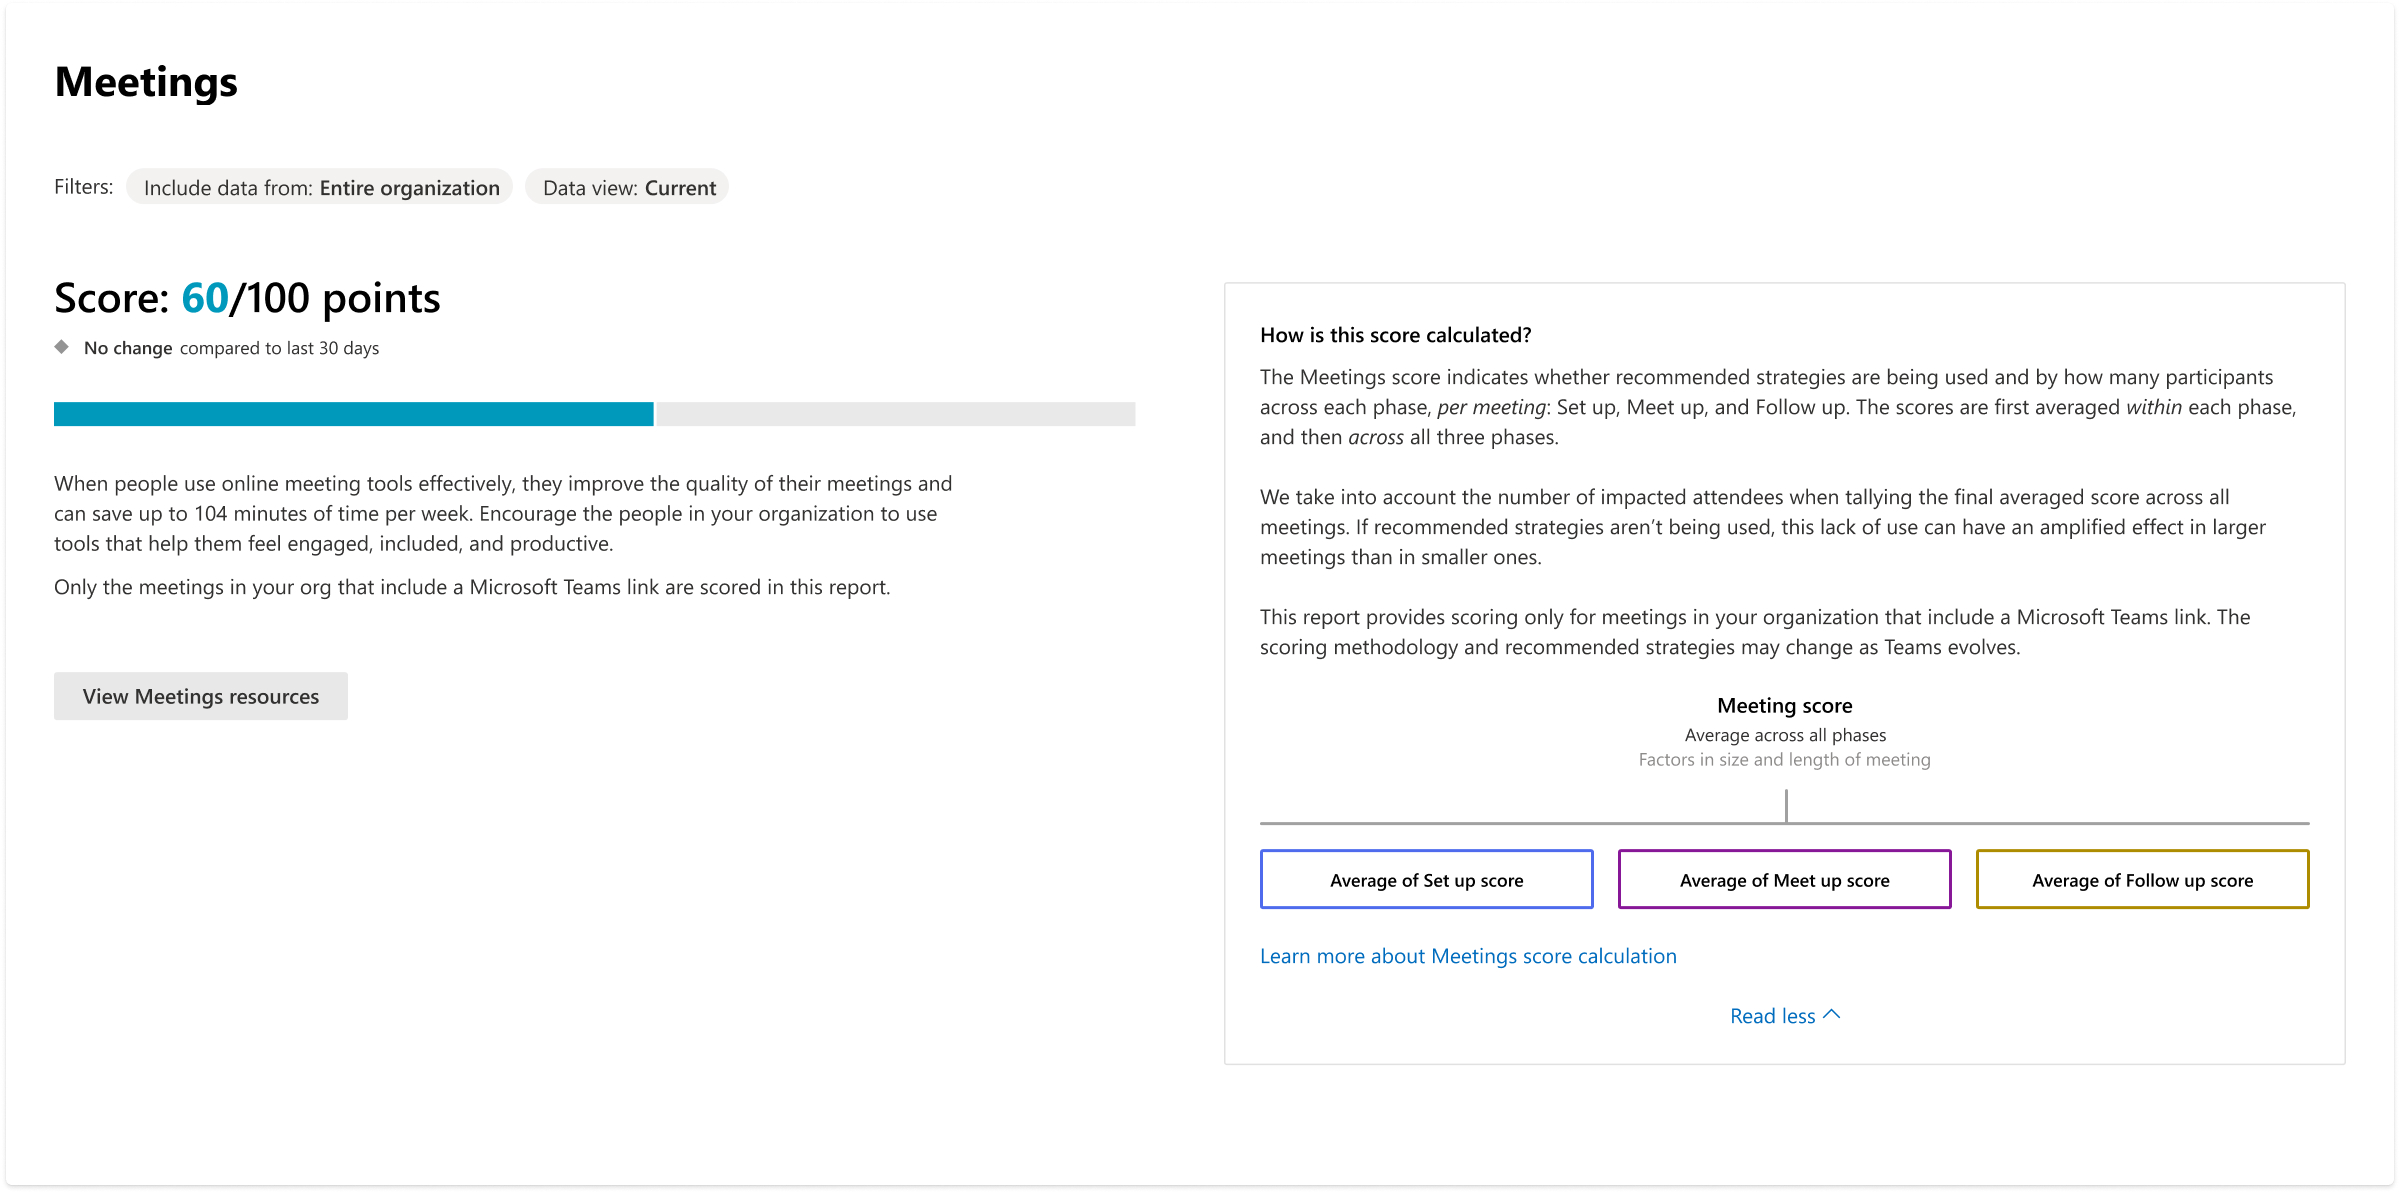
- Header: Shows the score, out of 100, based on the average of Set Up, Meet Up and Follow Up phases for online meetings on Microsoft Teams held in the past 28 days.
- Body: Provides more information on how using online meeting tools effectively can make meetings more effective.
- Visualization (current state): In this horizontal bar chart, the blue (colored) portion represents the score (out of 100) shown in the header.
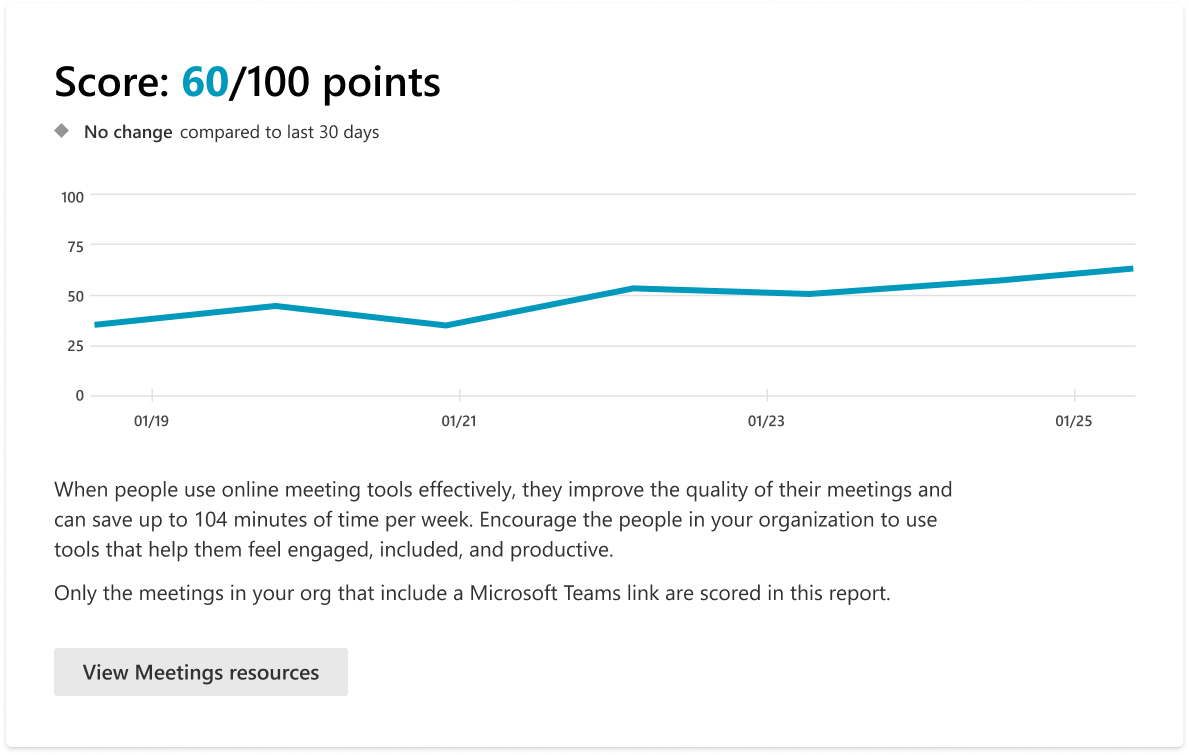
Trend visualization of the score
The following chart shows the trend-line of score over the selected period. Each data point on the line chart is an aggregate of activity for the last 28 days.
What makes up my score?
We provide you with supporting data on each of the Set Up, Meet up and Follow Up phases. The score for each insight is calculated out of 100.
Set up
This represents the phase that involves scheduling and sharing the details of the meeting and participants joining the meeting.
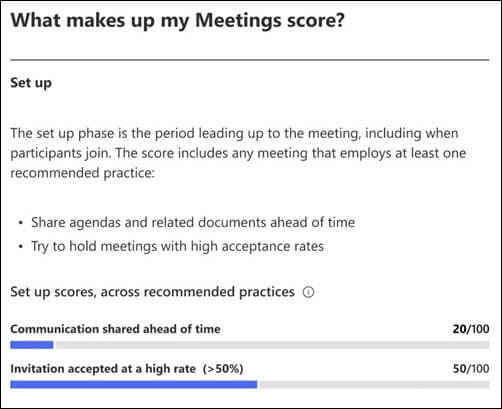
- Communication shared ahead of time: This represents the score for Microsoft Teams meetings that had a Teams conversation meeting chat started before conducting the meeting. For this to be tracked, a user must go to the meeting chat with the participants and send a message to the participants, before the scheduled meeting time.
- Invitation accepted at a high rate (>50%): This represents the score for Microsoft Teams meetings that had more than 50% of invited participants accept the meeting invite.
Meet up
This represents the phase of when attendees are in the meeting.
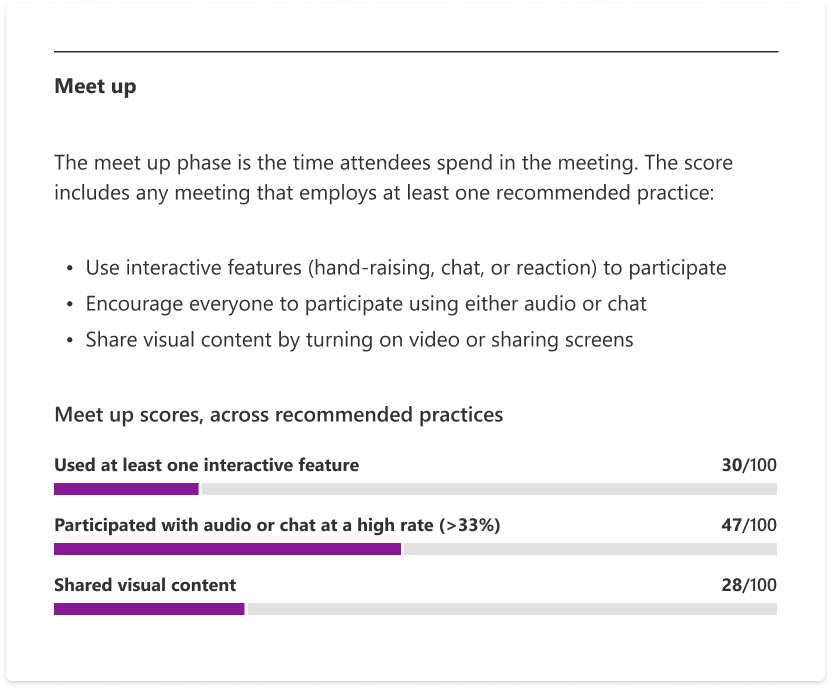
- Used at least one interactive feature: This represents the score for Microsoft Teams meetings that had attendees use at least one interactive feature. These interactive features include raising hand, sending a meeting chat message, or sending a reaction in the meeting. The score is calculated out of 100.
- Participated with audio or chat at a high rate (>33%): This represents the score for Microsoft Teams meetings that had more than 33% of the participants either speak in a meeting, send a meeting chat, or both. The score is calculated out of 100.
- Shared visual content: This represents the score for Microsoft Teams meetings that had attendees share any visual content in the meeting by either turning on their video, sharing screen, or both. The score is calculated out of 100.
Follow up
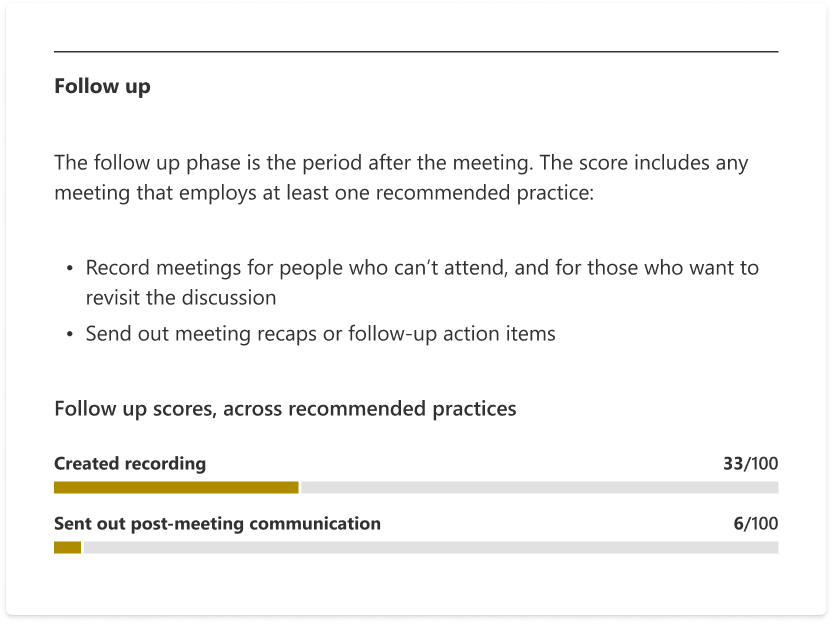
- Created recording: This represents the score for Microsoft Teams meetings that had the meeting recorded. The score is calculated out of 100.
- Sent out post-meeting communication: This represents the score for Microsoft Teams meetings that had attendee(s) share any chat messages on the meeting chat thread after the conclusion of that meeting. The score is calculated out of 100.
How can I impact my score?
This section helps understand two insights for the organization:
- Most significant growth: This section depicts the part of the score that had the highest growth in the past 28 days.
- Biggest area for improvement: This section depicts the part of the score that has the biggest room to improve and impact the org's Adoption Score in the future.
Dig deeper into meetings
This section consists of three sub-sections:
- Additional insights: Here we provide more insights that help organizations identify trends and user behaviors across meetings.
- Interesting findings: Here we provide some interesting facts about meetings being conducted in the organization.
- Microsoft Research: Here we reference Microsoft blogs and public research that provide recommended practices and their impacts to have effective meetings.
Note
The 'Dig deeper into meetings' section does not contribute to the overall score of the Meetings Page in Adoption Score People Experiences, however some insights in this section may expand on a primary insight used to calculate a score.
Related content
Microsoft 365 apps health – Technology experiences (article)
Communication – People experiences (article)
Content collaboration – People experiences (article)
Mobility – People experiences (article)
Privacy controls for Adoption Score (article)
Teamwork – People experiences (article)
Feedback
Coming soon: Throughout 2024 we will be phasing out GitHub Issues as the feedback mechanism for content and replacing it with a new feedback system. For more information see: https://aka.ms/ContentUserFeedback.
Submit and view feedback for