Teamwork – People experiences
Adoption Score provides insights into your organization's digital transformation journey through its use of Microsoft 365 and the technology experiences that support it. Your organization's score reflects people and technology experience measurements and can be compared to benchmarks from organizations similar to yours. The teamwork category is part of the measurements that falls under people experiences. To learn more, check out the Adoption Score overview and read Microsoft's Privacy Statement.
Prerequisites
To get started with teamwork insights, people in your organization need to be licensed for:
- Microsoft Teams
- SharePoint
- Exchange Online
For more information, see assign licenses to users.
After people have been active in the above products at least once in the last 28 days, you will start to see the insights.
Why your org's teamwork score matters
A fundamental pillar for organizational productivity is when a group of people with a common goal work with each other and with common resources for collective success. Research indicates that when people share information and collaborate in shared workspaces, they save up to 4 hours a week. They can find related documents, find context for previous discussions, and deliver towards shared goals. See the evidence
How we calculate the teamwork score
We provide a primary insight in the experience that contains the key metrics for this category in your organization. Then, a scoring framework, detailed below, is used for these metrics to calculate your organization’s score.
Primary insight
The primary insight looks at all the people who are communicating using email and messages on Microsoft Teams, and interacting with content on the cloud in shared workspaces. Within Microsoft 365, Microsoft 365 Groups are the foundation for people to come together in a shared workspace with the ability to send emails to the group mailbox, share files on the SharePoint team site, and send channel messages through Microsoft Teams.
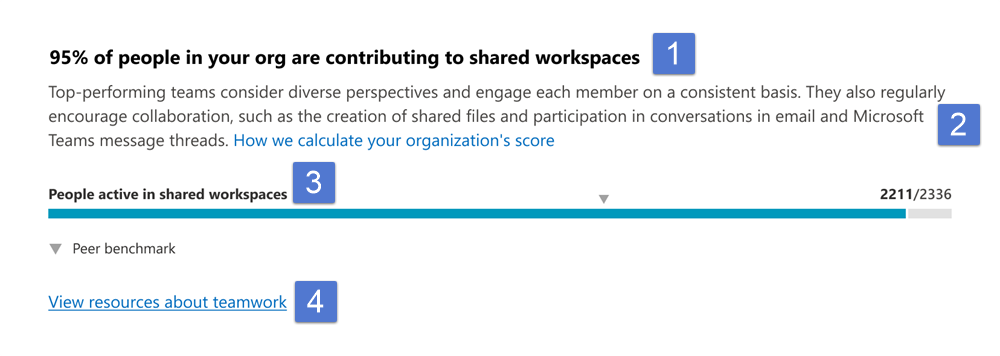
Header: Provides the key metric of people in your org performing any one the following activities:
Sending email to a group mailbox through Exchange.
Sending channel messages through Teams
Reading and creating content (what we collectively refer to as content interaction) in SharePoint team sites.
As a percentage of all people in your org who are performing any of the following activities (within or outside of shared workspaces):
Sending email through Exchange.
Sending messages (chat or channel messages) on Microsoft Teams.
Reading and creating content on OneDrive or SharePoint.
And have access to at least one of the following services: Exchange, Microsoft Teams, or SharePoint
Body: Provides more information on how communicating and interacting with content, when done within a shared workspace, can have positive outcomes for productivity in your organization.
Visualization (current state):
- Horizontal bar where the blue portion represents the percentage expressed in the header
- Highlights the fraction (numerator/denominator) used for computing the percentage shown in the header
- Numerator: The number of people in your organization who send email to a group mailbox through Exchange, OR who are sending channel messages through Teams, OR reading and creating content in SharePoint team sites.
- Denominator: The number of people in your org who send emails through Exchange, OR send messages (chat or channel messages) on Microsoft Teams, OR read and create content on OneDrive or SharePoint, AND have access to at least one of the following services: Exchange, Microsoft Teams, or SharePoint.
- The peer benchmark value of the key metric is also shown as a percentage.
View resources about teamwork: Select this link to view help content.
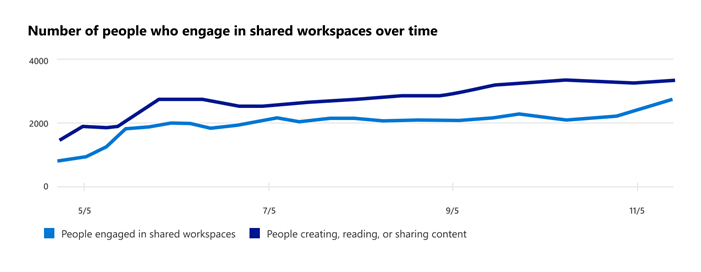
Trend visualization of the primary insight
The following chart provides the trend of the numerator and the denominator of the key metric in the primary insight. It shows the number of people engaged in shared workspaces, and the number of people communicating or interacting with content within the last 180 days. Each data point on the line chart is an aggregate of activity for the last 28 days.
Scoring framework
The teamwork score for your organization measures at an aggregate (organizational) level whether users are consistently communicating or engaging in file activity in shared workspaces within the last 28 days.
Scores are not provided at the individual user level .
Explore more about teamwork in your organization
We also provide additional information about how people in your organization work together. These additional metrics don't directly contribute to your Adoption Score, but are relevant in helping you create an action plan as part of your digital transformation.
Breakdown of how people engage in shared workspaces
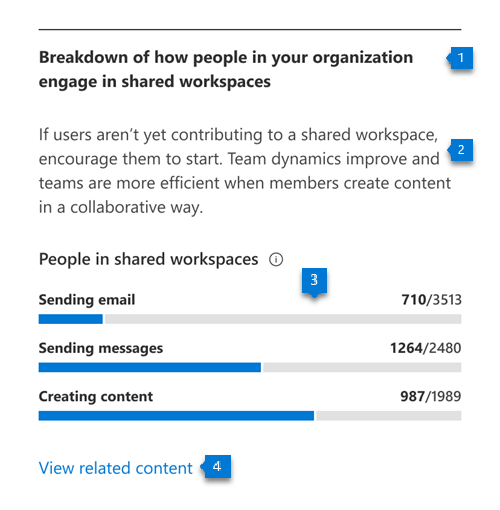
- Header: Shows a detailed breakdown across the different types of teamwork being measured.
- Body: Provides information on the value of working in shared workspaces to help teams be more effective.
- Visualization: The visualization shows the extent to which people who are communicating or interacting with content are doing so in shared workspaces, as follows:
- Sending email: The colored portion and the fraction represent the percentage of people sending email to group mailboxes. The fraction is comprised of:
- Numerator: People sending emails to group mailboxes in the last 28 days.
- Denominator: People sending emails in the last 28 days. This is the same group of people who are marked as sending email in the primary insight of communication Adoption Score.
- Sending messages: The colored portion and the fraction represent the percentage of people sending messages in channels in Microsoft Teams. The fraction is comprised of:
- Numerator: People sending channel messages within the last 28 days.
- Denominator: People sending chat or channel messages in the last 28 days. This is the same group of people who are marked as sending messages in Microsoft Teams in the primary insight of the communication category in Adoption Score.
- Creating content: The colored portion and the fraction represent the percentage of people reading or creating content on Microsoft 365 SharePoint team sites.
- Numerator: Number of people reading or creating content on Microsoft 365 group connected team sites.
- Denominator: Number of people with access to SharePoint, who read or created content of any kind in OneDrive or SharePoint sites in the last 28 days.
- Sending email: The colored portion and the fraction represent the percentage of people sending email to group mailboxes. The fraction is comprised of:
- View related content: Select this link to view help content.
Breakdown of workspace engagement by size and age
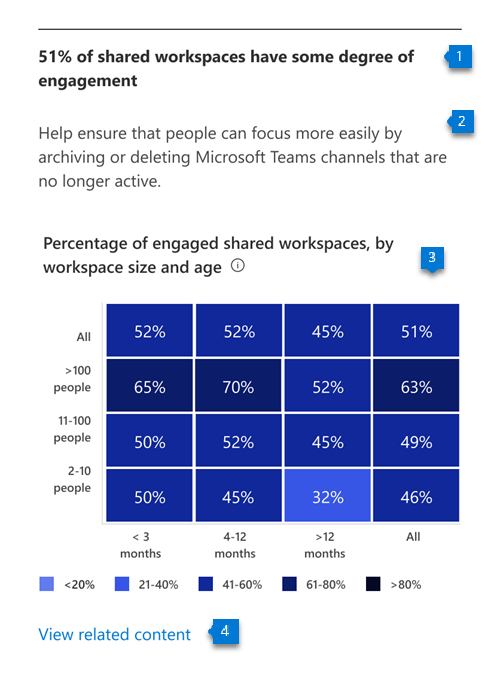
Header: Shows the categorization of engagement in workspaces, broken out by size for the number of members in the workspace, and the workspace age in months.
Body: Provides information about the value of encouraging people in your organization to keep only the workspaces that are needed to promote more effective teamwork.
Visualization: The engagement breakdown is shown in the form of a heat-map across two dimensions.
Size of workspace: Workspaces are broken down into three categories based on the number of members: 2-10 people, 11-100 people, and over 100 people. The "All" category includes all size categories.
Age of workspace: Workspaces are categorized by the number of months since the workspace was first created. The "All" category includes all age categories.
Each cell in the chart has a number and color based on the percentage of engaged workspaces that belong in that category. The workspace categories are based on the age and size shown in the intersection of that cell. For example, if the cell at the intersection of 11-100 people and 4-12 months has a value of 52%, it means that 52% of the workspaces with 11-100 members that are between 4-12 months old, have some form of engagement. The percentage is calculated as:
- Numerator: Workspaces that have engagement in the form of communication (email and channel messages) or content interaction in the last 28 days
- Denominator: all workspaces that are available in your org for the last 28 days
View related content: Select this link to view help content.
Breakdown of workspaces by level of engagement
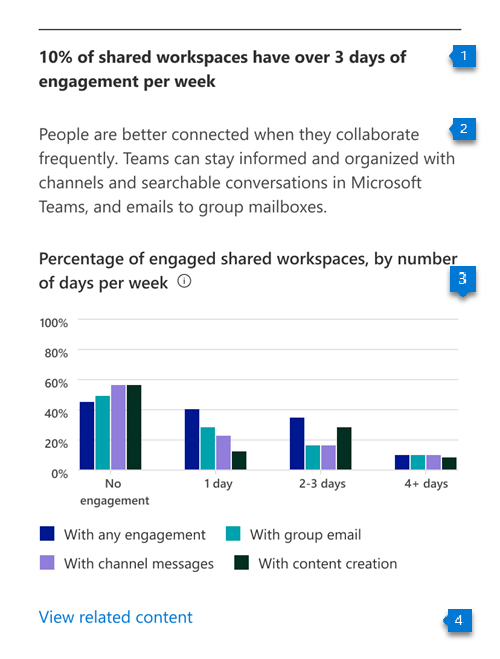
- Header: Provides a breakdown of workspaces broken out by level of engagement, using group email, channel messages, and content interaction.
- Body: Provides information on the value of consistent engagement in the shared workspaces to help make them more effective at teamwork.
- Visualization: Provides a view of the workspaces in your organization based on the intensity of engagement per week. The view includes distributions for different activity types measured within teamwork, in addition to any engagement, which covers the following categories:
- Group email: Percent of workspaces that have no days/1 day/2-3 days/4+ days of group email activity per week over the last 28 days.
- Channel messages: Percent of workspaces that have no days/1 day/2-3 days/4+ days of channel messages per week over the last 28 days.
- Content reading or creation: Percent of workspaces that have no days/1 day/2-3 days/4+ days of reading or creating content per week over the last 28 days.
- View related content: Select this link to view help content.
Use of teams within Microsoft Teams
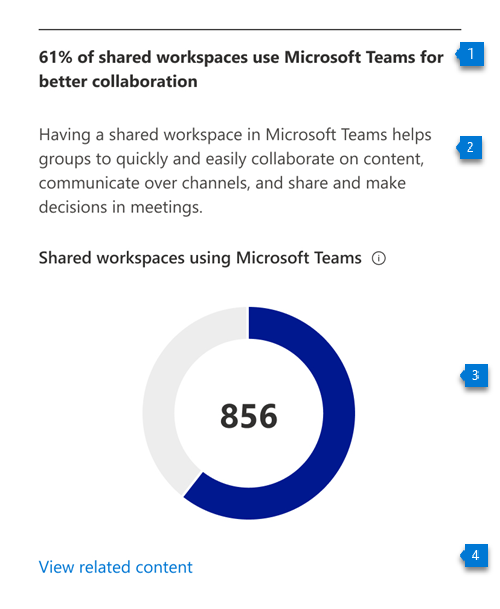
Header: Shows the number of shared workspaces that have a Microsoft Teams team associated with them.
Body: Provides information about the value of having a Microsoft Teams team attached to the shared workspaces, to help make people associated with them more effective at teamwork.
Visualization: The colored part of the donut chart reflects the percentage of workspaces that have a Microsoft Teams team attached to them. The percentage is calculated as follows:
Numerator: The number of shared workspaces in your organization that had a Microsoft Teams team associated with them in the last 28 days
Denominator: The number of shared workspaces in your org in the last 28 days
The number in the center of the donut chart represents the total number of shared workspaces that have a Microsoft Teams team associated with them.
View related content: Select this link to view help content.
View teamwork trends over time
For each of the insights above, you can see how the metrics trend over time by selecting an option from the dropdown shown below:
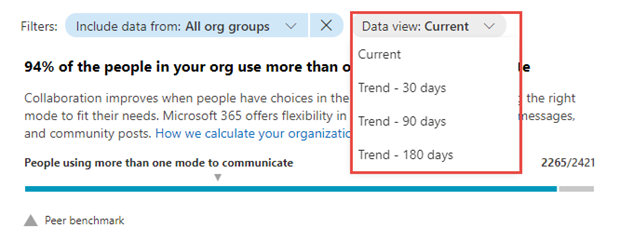
After you select an option, the charts in the report will update to show a trend over time rather than a snapshot of the past month.
Related content
Microsoft 365 apps health – Technology experiences (article)
Communication – People experiences (article)
Content collaboration – People experiences (article)
Meetings – People experiences (article)
Mobility – People experiences (article)
Privacy controls for Adoption Score (article)
Feedback
Coming soon: Throughout 2024 we will be phasing out GitHub Issues as the feedback mechanism for content and replacing it with a new feedback system. For more information see: https://aka.ms/ContentUserFeedback.
Submit and view feedback for