Prioritize incidents in the Microsoft Defender portal
The unified security operations platform in the Microsoft Defender portal applies correlation analytics and aggregates related alerts and automated investigations from different products into an incident. Microsoft Sentinel and Defender XDR also trigger unique alerts on activities that can only be identified as malicious given the end-to-end visibility in the unified platform across the entire suite of products. This view gives your security analysts the broader attack story, which helps them better understand and deal with complex threats across your organization.
Important
Microsoft Sentinel is available as part of the public preview for the unified security operations platform in the Microsoft Defender portal. For more information, see Microsoft Sentinel in the Microsoft Defender portal.
Incident queue
The Incident queue shows a collection of incidents that were created across devices, users, mailboxes, and other resources. It helps you sort through incidents to prioritize and create an informed cybersecurity response decision, a process known as incident triage.
Tip
For a limited time during January 2024, when you visit the Incidents page, Defender Boxed appears. Defender Boxed highlights your organization's security successes, improvements, and response actions during 2023. To reopen Defender Boxed, in the Microsoft Defender portal, go to Incidents, and then select Your Defender Boxed.
You can get to the incident queue from Incidents & alerts > Incidents on the quick launch of the Microsoft Defender portal. Here's an example.

Select Most recent incidents and alerts to toggle the expansion of the top section, which shows a timeline graph of the number of alerts received and incidents created in the last 24 hours.

Below that, the incident queue in the Microsoft Defender portal displays incidents seen in the last six months. The most recent incident is at the top of the list so you can see it first. You can choose a different time frame by selecting it from the drop-down at the top.
The incident queue has customizable columns (select Customize columns) that give you visibility into different characteristics of the incident or the impacted entities. This filtering helps you make an informed decision regarding the prioritization of incidents for analysis.

Incident names
For more visibility at a glance, Microsoft Defender XDR generates incident names automatically, based on alert attributes such as the number of endpoints affected, users affected, detection sources, or categories. This specific naming allows you to quickly understand the scope of the incident.
For example: Multi-stage incident on multiple endpoints reported by multiple sources.
If you onboarded Microsoft Sentinel to the unified security operations platform, then any alerts and incidents coming from Microsoft Sentinel are likely to have their names changed (regardless of whether they were created before or since the onboarding).
We recommend that you avoid using the incident name as a condition for triggering automation rules. If the incident name is a condition, and the incident name changes, the rule will not be triggered.
Filters
The incident queue also provides multiple filtering options, that when applied, enable you to perform a broad sweep of all existing incidents in your environment, or decide to focus on a specific scenario or threat. Applying filters on the incident queue can help determine which incident requires immediate attention.
The Filters list above the list of incidents shows the currently applied filters.
From the default incident queue, you can select Add filter to see the Add filter drop-down, from which you specify filters to apply to the incidents queue to limit the set of incidents shown. Here's an example.
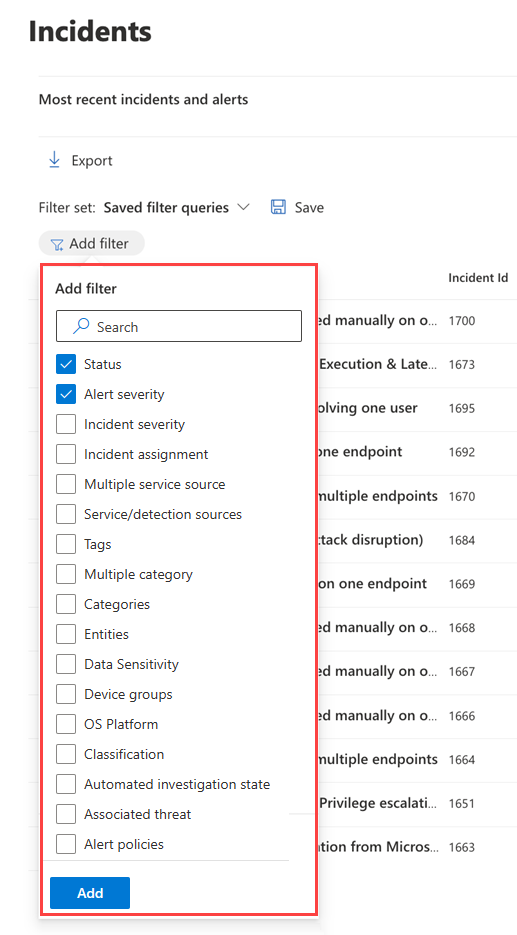
Select the filters you want to use, then select Add at the bottom of the list to make them available.
Now the filters you selected are shown along with the existing applied filters. Select the new filter to specify its conditions. For example, if you chose the "Service/detection sources" filter, select it to choose the sources by which to filter the list.
You can also see the Filter pane by selecting any of the filters in the Filters list above the list of incidents.
This table lists the filter names that are available.
| Filter name | Description/Conditions |
|---|---|
| Status | Select New, In progress, or Resolved. |
| Alert severity Incident severity |
The severity of an alert or incident is indicative of the impact it can have on your assets. The higher the severity, the bigger the impact and typically requires the most immediate attention. Select High, Medium, Low, or Informational. |
| Incident assignment | Select the assigned user or users. |
| Multiple service sources | Specify whether the filter is for more than one service source. |
| Service/detection sources | Specify incidents that contain alerts from one or more of the following: Many of these services can be expanded in the menu to reveal further choices of detection sources within a given service. |
| Tags | Select one or multiple tag names from the list. |
| Multiple category | Specify whether the filter is for more than one category. |
| Categories | Choose categories to focus on specific tactics, techniques, or attack components seen. |
| Entities | Specify the name of an asset such as a user, device, mailbox, or application name. |
| Data sensitivity | Some attacks focus on targeting to exfiltrate sensitive or valuable data. By applying a filter for specific sensitivity labels, you can quickly determine if sensitive information has potentially been compromised and prioritize addressing those incidents. This filter displays information only when you've applied sensitivity labels from Microsoft Purview Information Protection. |
| Device groups | Specify a device group name. |
| OS platform | Specify device operating systems. |
| Classification | Specify the set of classifications of the related alerts. |
| Automated investigation state | Specify the status of automated investigation. |
| Associated threat | Specify a named threat. |
| Alert policies | Specify an alert policy title. |
The default filter is to show all alerts and incidents with a status of New and In progress and with a severity of High, Medium, or Low.
You can quickly remove a filter by selecting the X in the name of a filter in the Filters list.
You can also create filter sets within the incidents page by selecting Saved filter queries > Create filter set. If no filter sets have been created, select Save to create one.

Save custom filters as URLs
Once you've configured a useful filter in the incidents queue, you can bookmark the URL of the browser tab or otherwise save it as a link on a Web page, a Word document, or a place of your choice. Bookmarking gives you single-click access to key views of the incident queue, such as:
- New incidents
- High-severity incidents
- Unassigned incidents
- High-severity, unassigned incidents
- Incidents assigned to me
- Incidents assigned to me and for Microsoft Defender for Endpoint
- Incidents with a specific tag or tags
- Incidents with a specific threat category
- Incidents with a specific associated threat
- Incidents with a specific actor
Once you have compiled and stored your list of useful filter views as URLs, use it to quickly process and prioritize the incidents in your queue and manage them for subsequent assignment and analysis.
Search
From the Search for name or ID box above the list of incidents, you can search for incidents in a number of ways, to quickly find what you're looking for.
Search by incident name or ID
Search directly for an incident by typing the incident ID or the incident name. When you select an incident from the list of search results, the Microsoft Defender portal opens a new tab with the properties of the incident, from which you can start your investigation.
Search by impacted assets
You can name an asset—such as a user, device, mailbox, application name, or cloud resource—and find all the incidents related to that asset.
Specify a time range
The default list of incidents is for those that occurred in the last six months. You can specify a new time range from the drop-down box next to the calendar icon by selecting:
- One day
- Three days
- One week
- 30 days
- 30 days
- Six months
- A custom range in which you can specify both dates and times
Next steps
After you've determined which incident requires the highest priority, select it and:
- Manage the properties of the incident for tags, assignment, immediate resolution for false positive incidents, and comments.
- Begin your investigations.
See also
Tip
Do you want to learn more? Engage with the Microsoft Security community in our Tech Community: Microsoft Defender XDR Tech Community.
Feedback
Coming soon: Throughout 2024 we will be phasing out GitHub Issues as the feedback mechanism for content and replacing it with a new feedback system. For more information see: https://aka.ms/ContentUserFeedback.
Submit and view feedback for