Interact with the DOM using the Console
The Console tool is a great way to interact with the webpage in the browser. In DevTools, you usually interact with the DOM by using the Inspect tool to select elements, and by using the Elements tool to modify the DOM, for example to add or change element attributes or styles.
The Console tool can also be used to interact with the DOM by using JavaScript code. For example, you can find elements in the DOM tree and manipulate them by using DOM APIs.
To learn more about the Inspect tool, see Analyze pages using the Inspect tool. To learn more about the Elements tool, see Inspect, edit, and debug HTML and CSS with the Elements tool.
Find an element in the DOM tree
To find an element in the DOM tree from the Console tool:
Go to the webpage that you want to inspect. For example, open the DevTools Console tool DOM interactions demo page in a new tab or window.
Press Ctrl+Shift+J (Windows, Linux) or Command+Option+J (macOS). The Console tool opens in DevTools, next to the webpage.
Type or paste the following code into the Console, and then press Enter.
document.querySelector('main');The
<main>element from the DOM tree is displayed in the Console: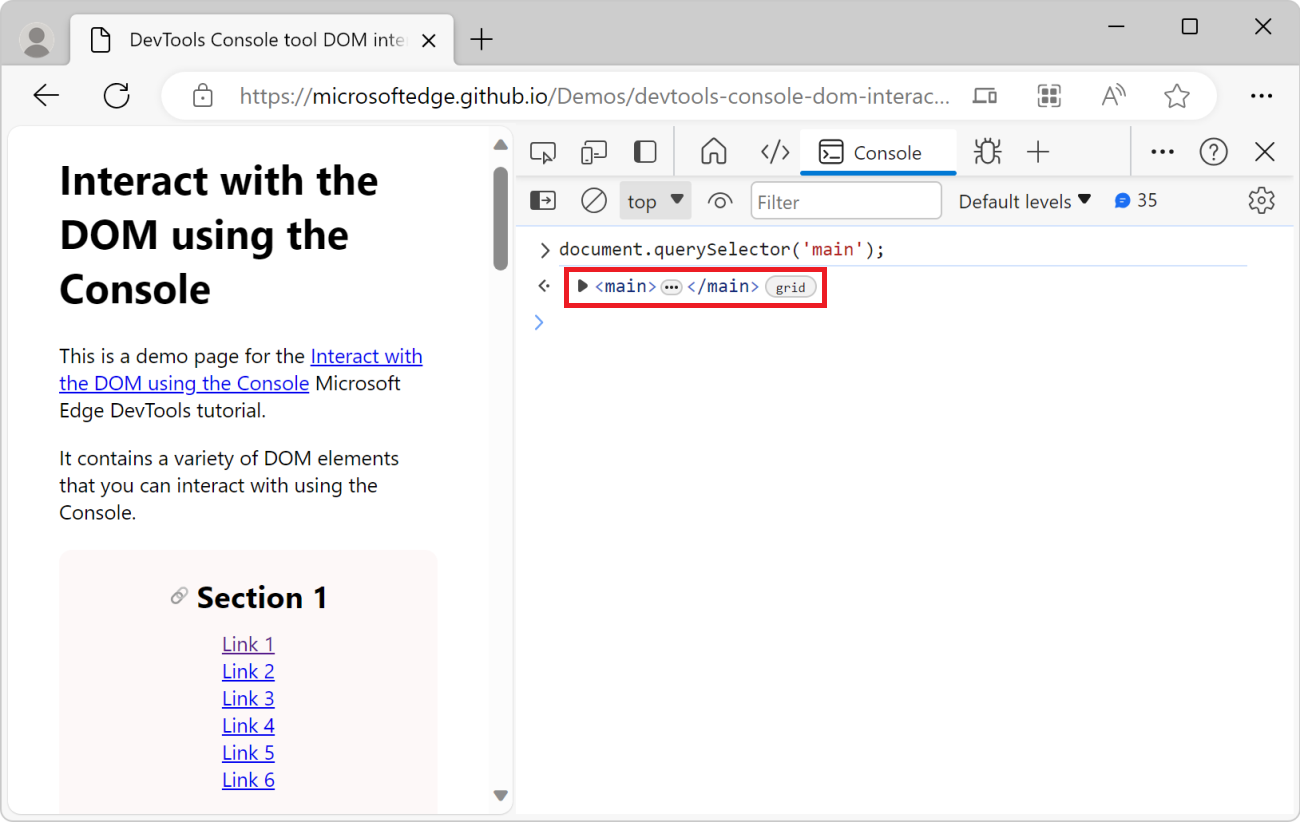
In the Console, hover over the resulting HTML
<main>element, or press Shift+Tab. In the rendered webpage, DevTools highlights the corresponding<main>element: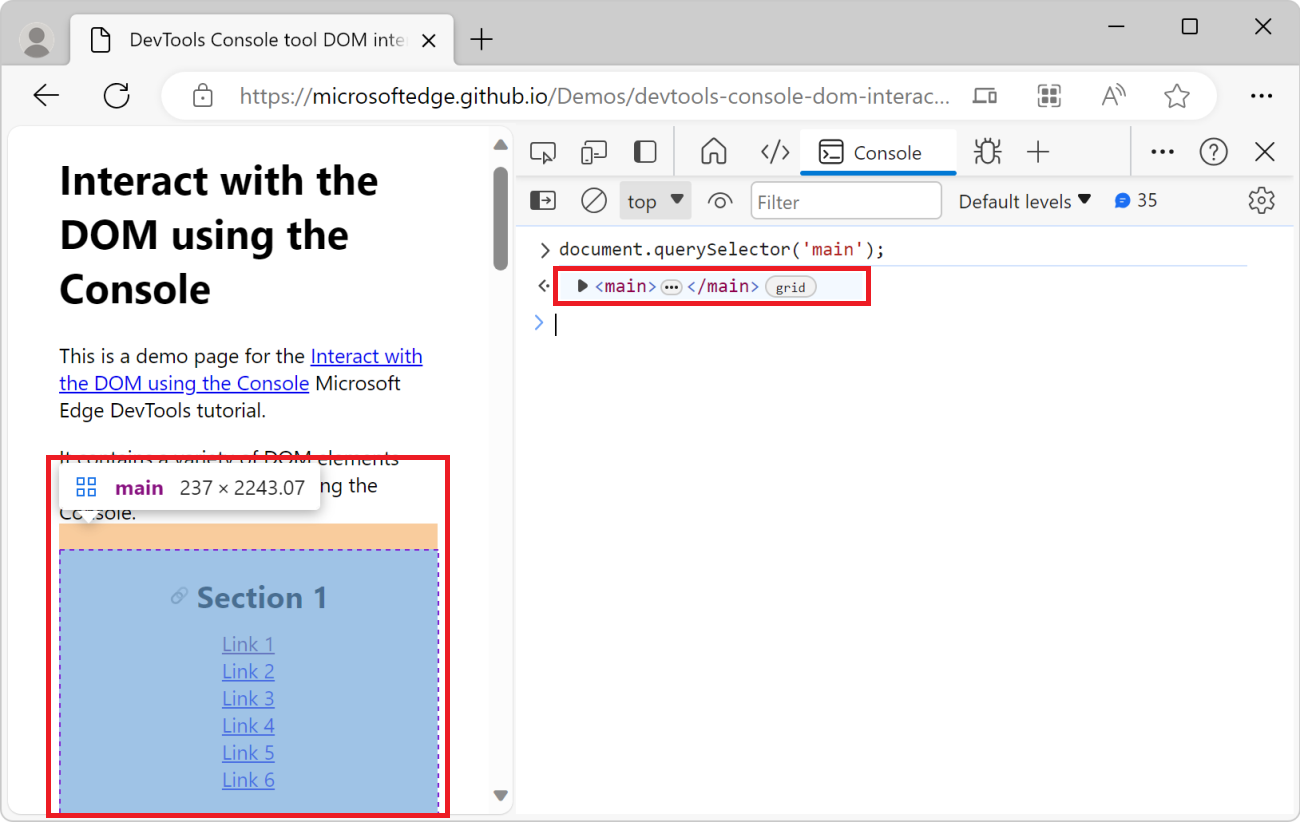
Change the DOM of the webpage
You can make changes to the DOM tree of the webpage from the Console tool. In this example, you set the value of a DOM element attribute by using the Console, to affect the element's styling: you add a grey background to the <h1> title of the page.
Go to the webpage that you want to change. For example, open the DevTools Console tool DOM interactions demo page in a new tab or window.
Press Ctrl+Shift+J (Windows, Linux) or Command+Option+J (macOS). The Console tool opens in DevTools, next to the webpage.
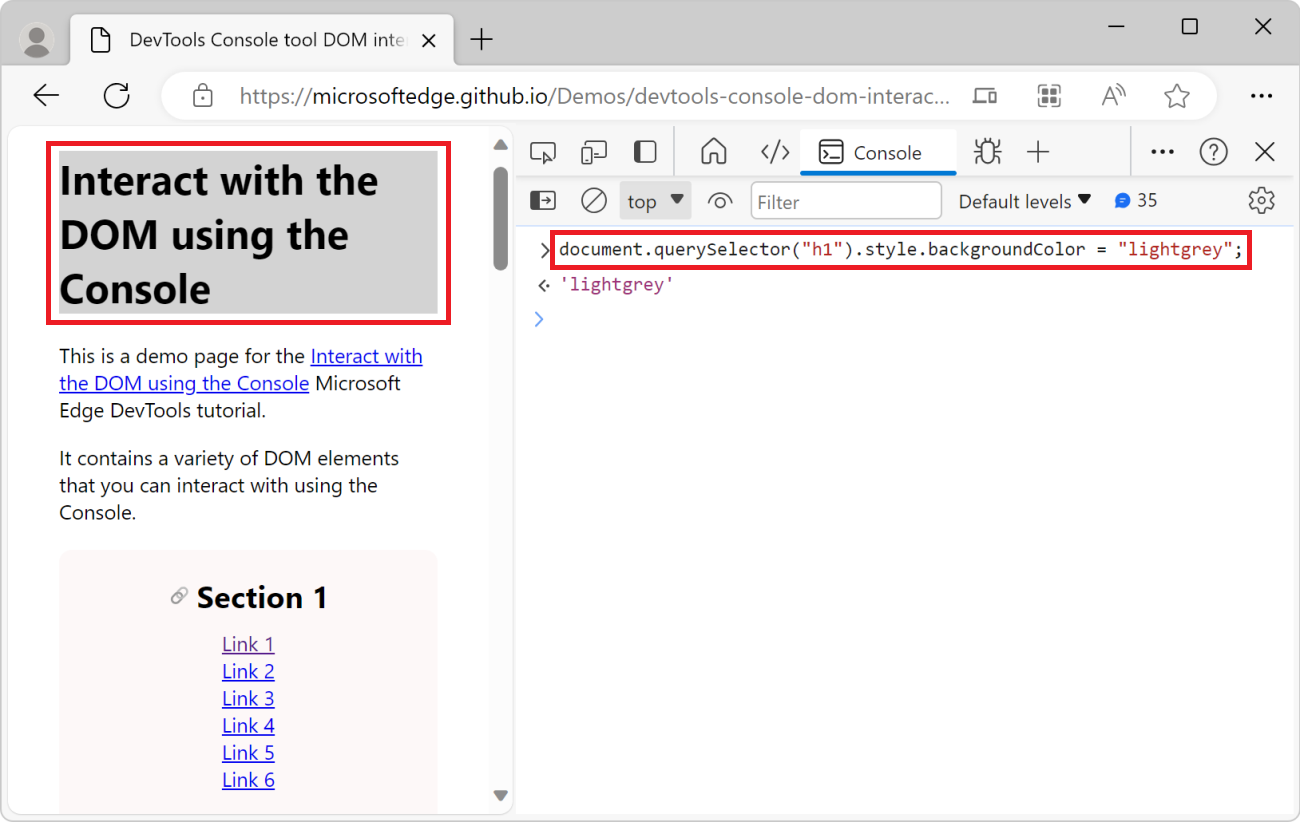
Paste the following code into the Console:
document.querySelector("h1").style.backgroundColor = "lightgrey";A grey background appears behind the page title:
Get a reference to an element
In a complex webpage, it can be hard to find the right element to change. But you can use the Inspect tool to help you. Suppose you want to change the text of the first link within the Section 1 element of the rendered page:
To get a reference to the link element that you want to change:
Go to the webpage that you want to inspect. For example, open the DevTools Console tool DOM interactions demo page in a new tab or window.
Press Ctrl+Shift+J (Windows, Linux) or Command+Option+J (macOS). The Console tool opens in DevTools, next to the webpage.
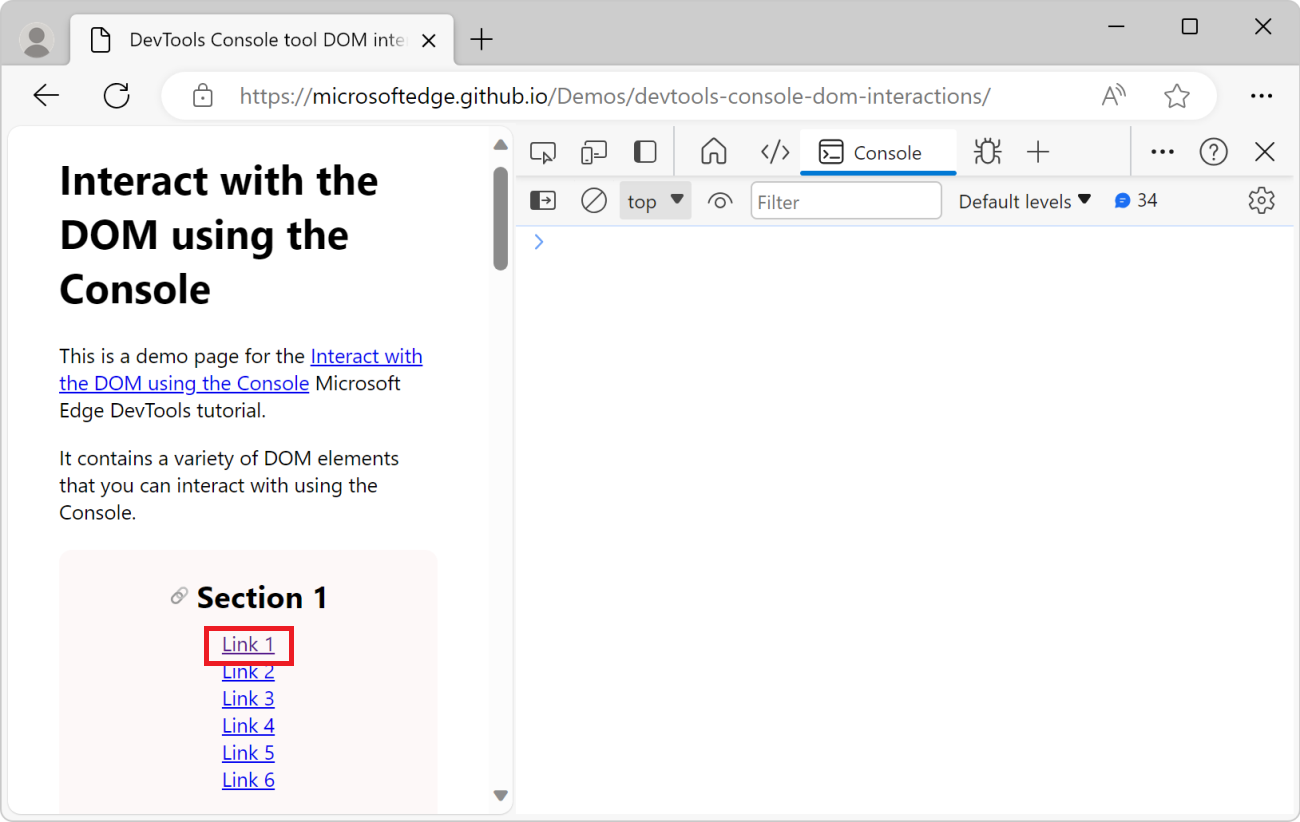
Click the Inspect (
 ) tool, and then in the rendered webpage, hover over a link, such as Link 1:
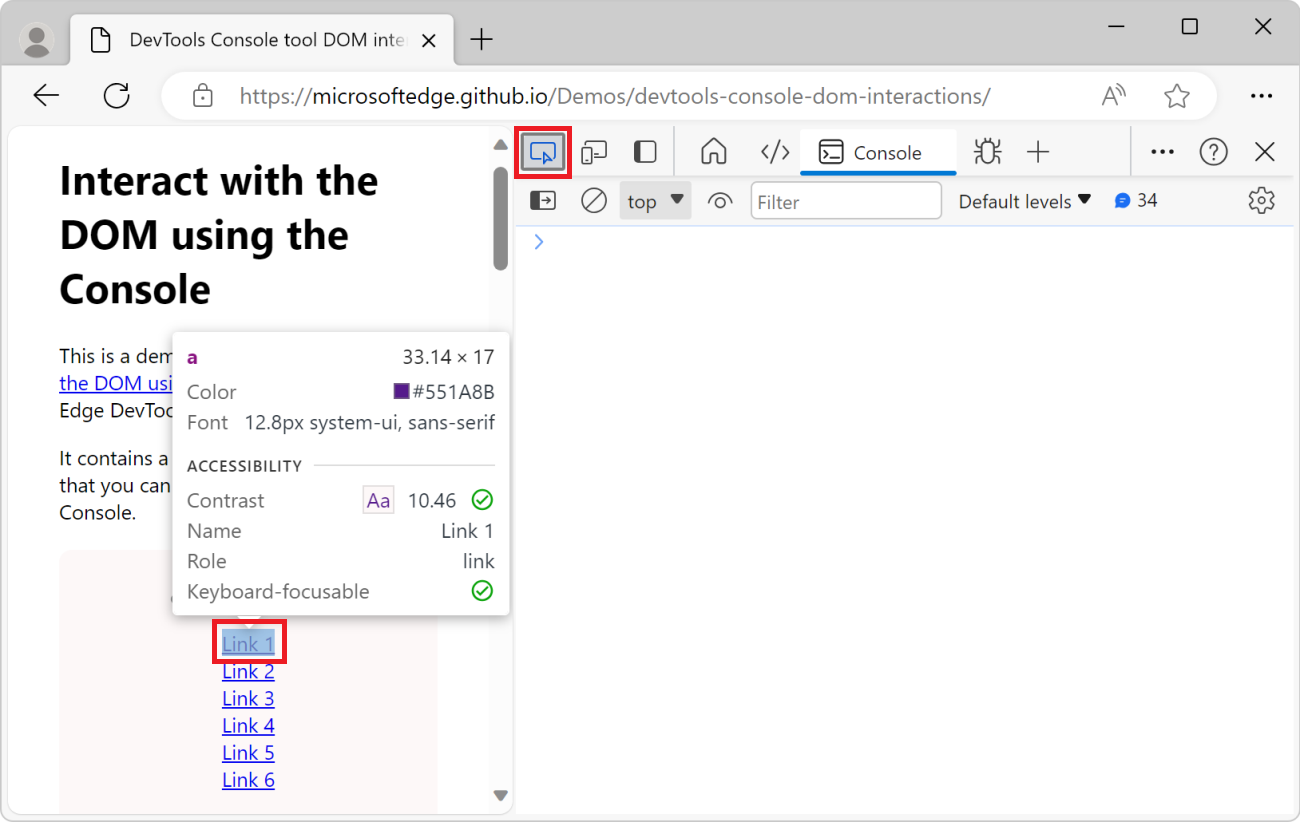
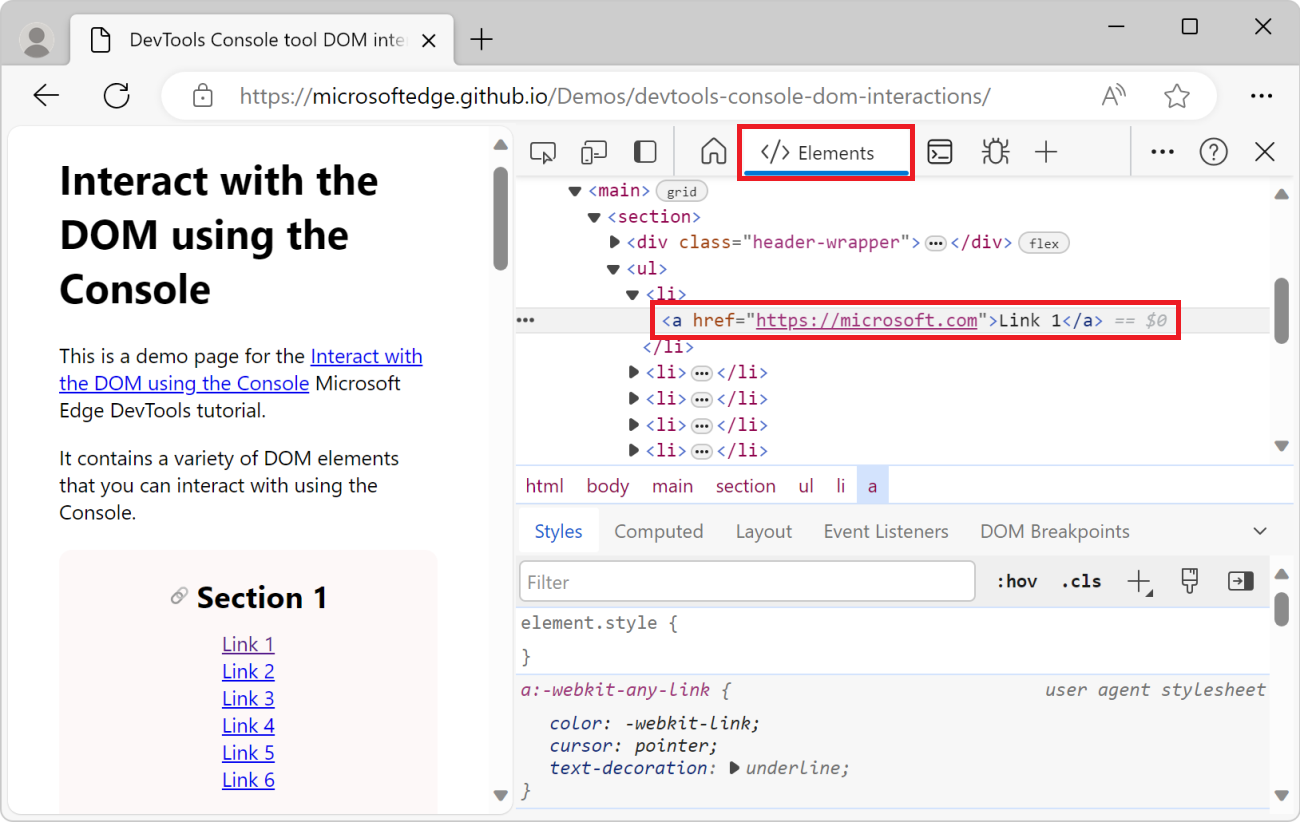
Click the hovered link on the rendered webpage. DevTools opens the Elements tool, with the corresponding element selected:
Click the
...button next to the element in the DOM tree, and then select Copy > Copy JS path: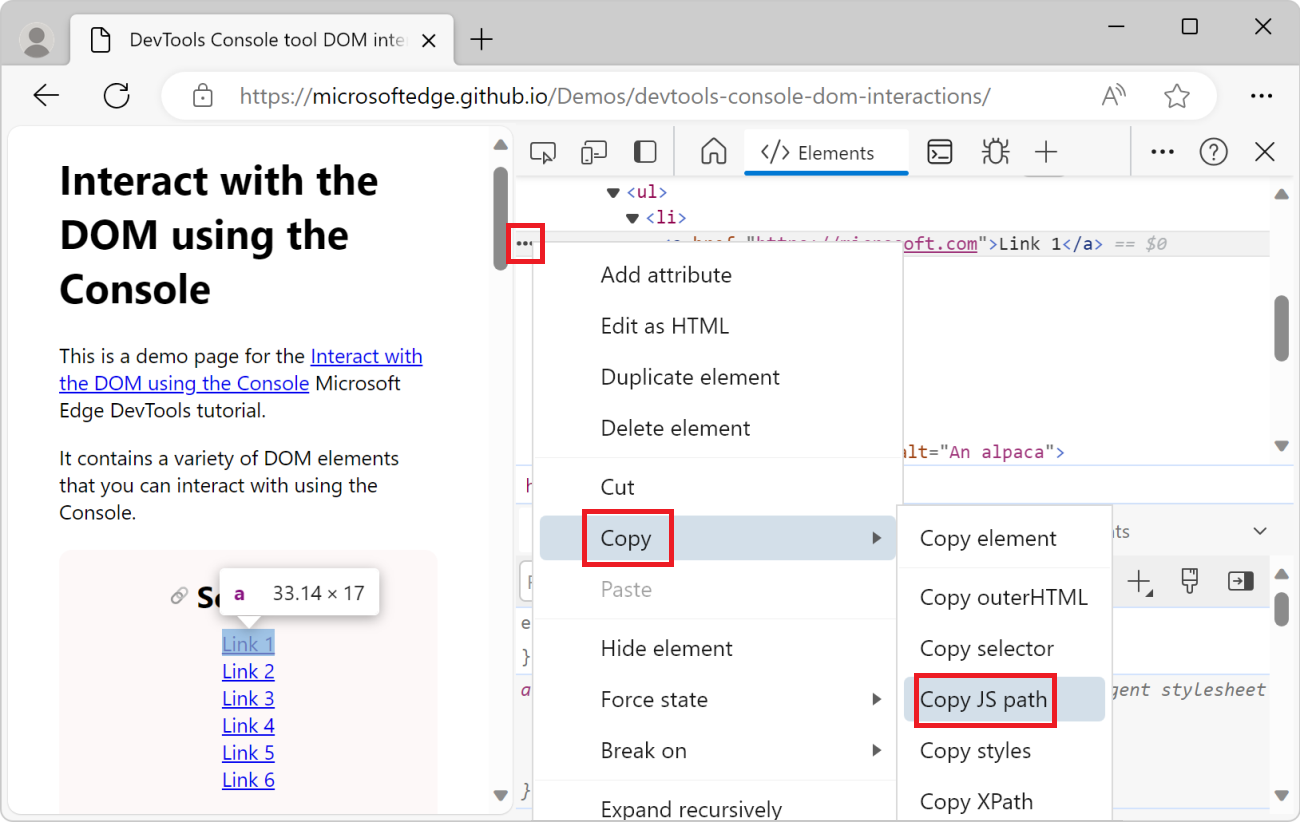
Here's the JS path you copied:
document.querySelector("body > main > section:nth-child(1) > ul > li:nth-child(1) > a")The above path is a CSS selector that points to the link element you selected by using the Inspect tool.
In the Console, paste the JavaScript path that you copied, but don't press Enter yet.
Change the text of the link to
Updated link. To do that, add.textContent = "Updated link"to the JavaScript path that you previously pasted: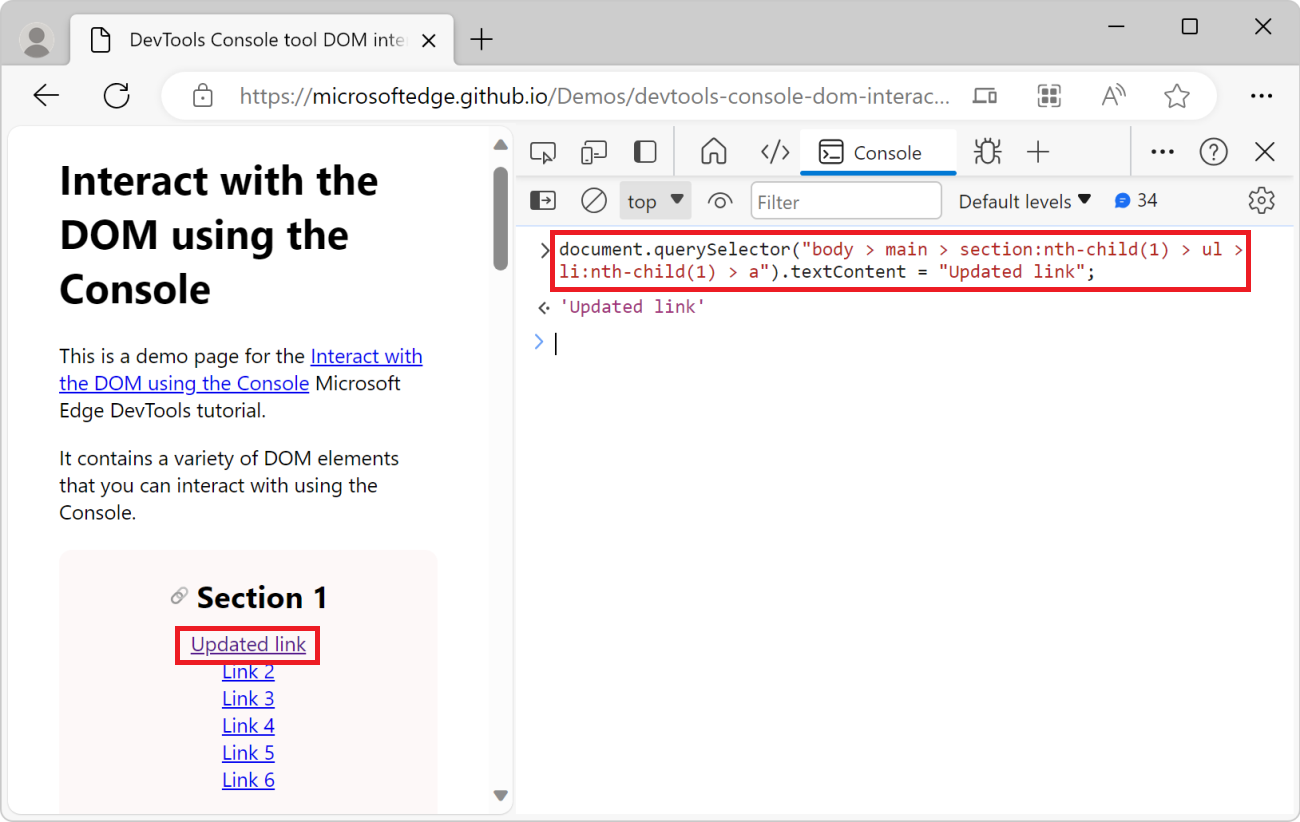
Use any DOM APIs you want to change the DOM tree in the Console. To make it more convenient, the Console comes with a few helper utility methods.
Helpful console utility functions
Many convenience methods and shortcuts are available to you as utility functions in the Console tool. Some of these utility functions are very useful for interacting with the DOM tree of a webpage, and are described below. To learn more, see Console tool utility functions and selectors.
Get elements with the $ functions and shortcuts
The $ character has a special meaning in the Console tool:
The
$()and$$()functions are shorter versions of thedocument.querySelector()anddocument.querySelectorAll()functions.$0,$1,$2,$3, and$4are shortcuts to elements that you recently selected in the Elements tool.$0is always the most recently selected element. So, in the earlier example Get a reference to an element, once you've selected the element by using the Inspect tool, you can change its text by using$0.textContent = "Updated link"to get the same effect.$x()allows you to select DOM elements using XPath.
Get all links from the page
In this example, you use the $$() utility function to list all links on the webpage. You then use that function along with the filter() array method to get rid of the links that don't start with https (such as the anchor links in the present webpage), in order to filter the list to only include external links.
Go to the webpage that you want to get the links from. For example, open the DevTools Console tool DOM interactions demo page in a new tab or window.
Press Ctrl+Shift+J (Windows, Linux) or Command+Option+J (macOS). The Console tool opens in DevTools, next to the webpage.
To get the list of all links in the page, enter the following code in the Console, and then press Enter:
$$('a');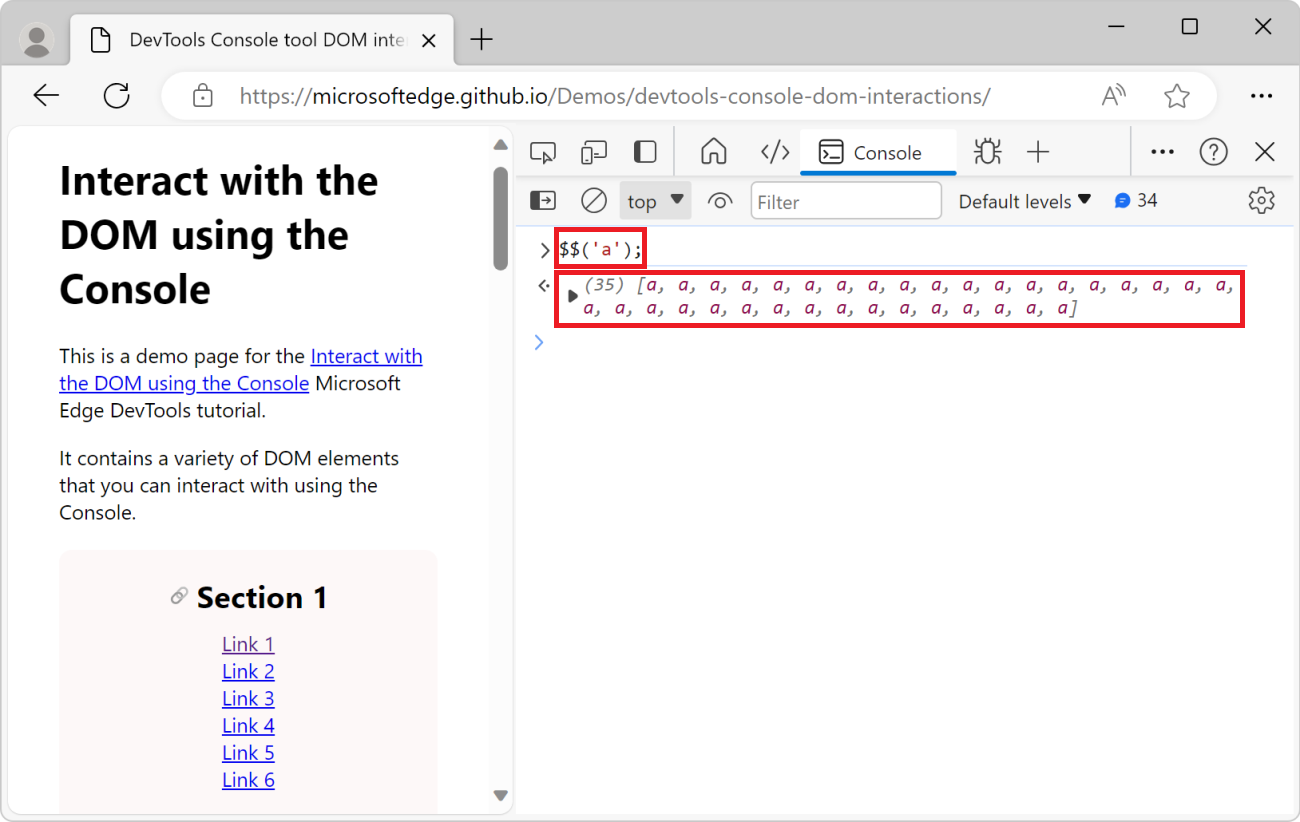
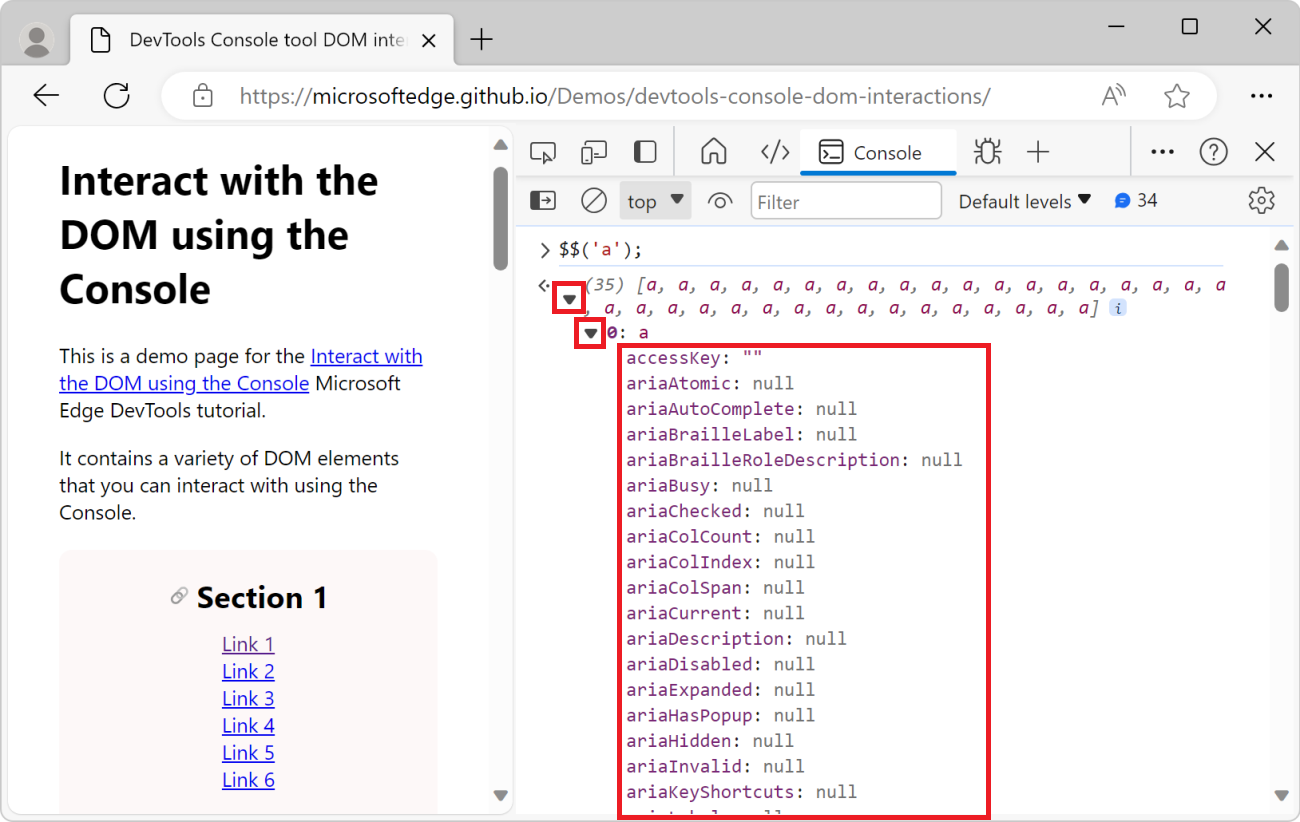
$$('a')is short fordocument.querySelectorAll('a').Expand the list of links that's logged in the Console, and then expand the first link object. The link's properties are displayed:
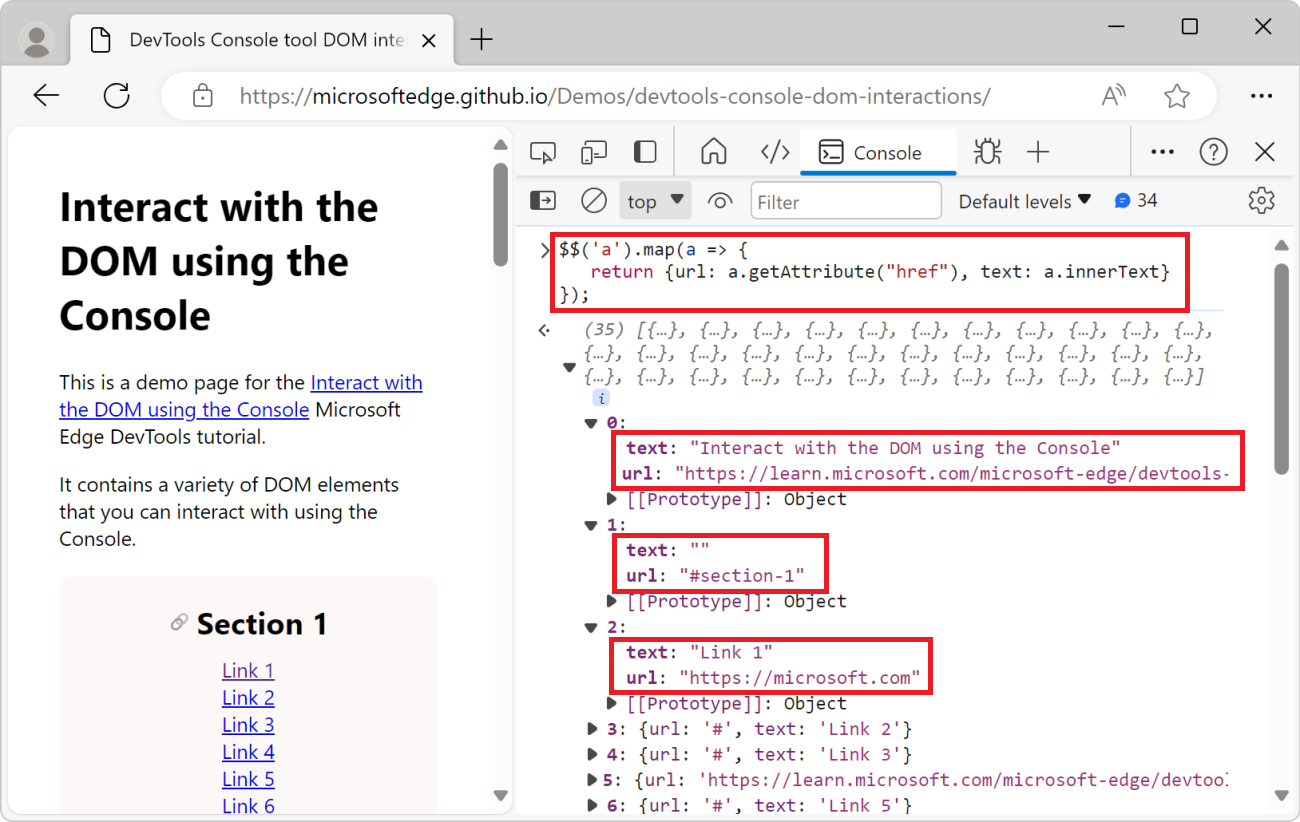
To reduce the amount of information returned by the
$$()function, use themap()array method. Themap()method works because the$$()function returns an array.$$('a').map(a => { return {url: a.getAttribute("href"), text: a.innerText} });The above code returns an array of all the links, where each link object is mapped to a JavaScript objects with the
urlandtextproperties.Expand a few of the returned link objects to see their properties:
To only list external links, use the
filter()array method to get rid of the links that don't start withhttps:$$('a').map(a => { return {url: a.getAttribute("href"), text: a.innerText} }).filter(a => { return a.url.startsWith("https"); });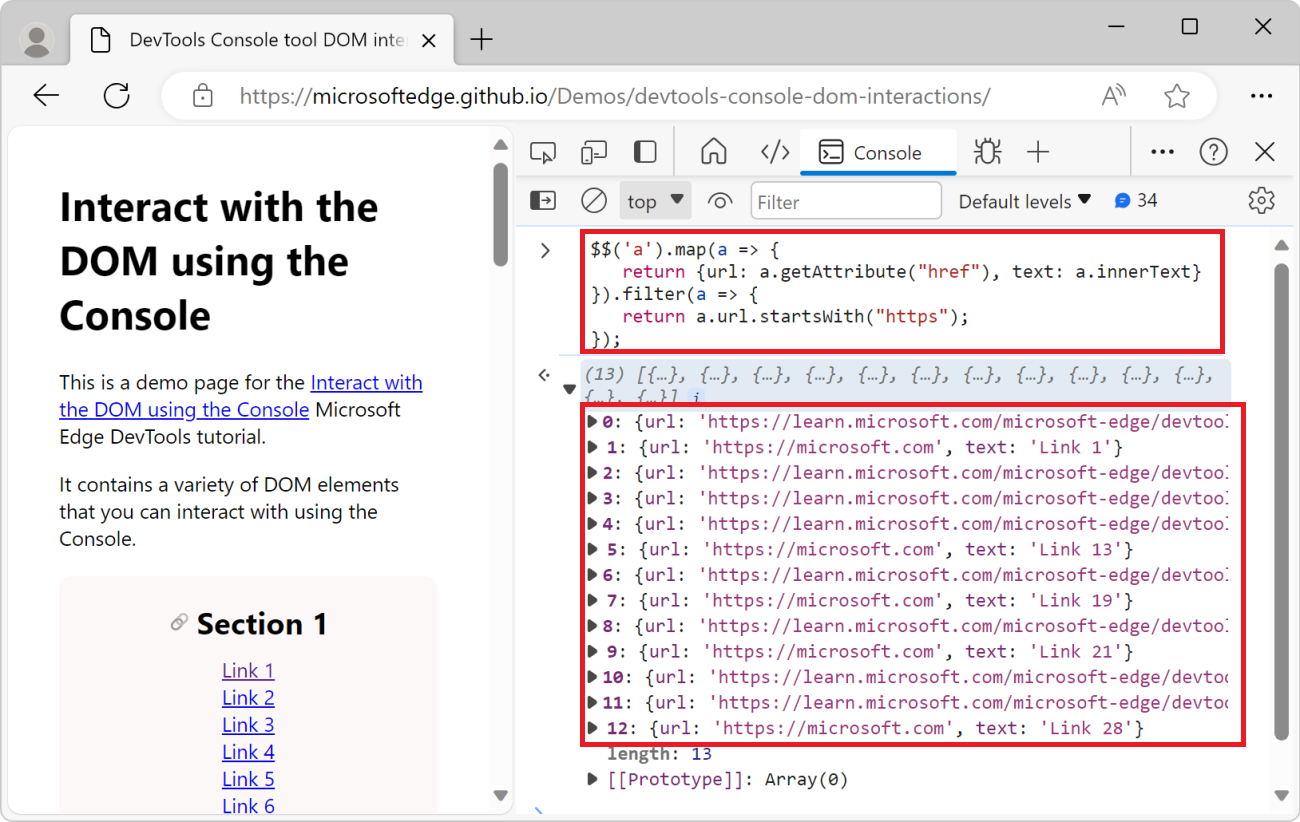
Display DOM elements in a table
In the previous example, you displayed a list of elements from the page in the Console. The elements are displayed as a JavaScript array. To make it easier to use the list of elements in the Console, you can display them in a sortable table instead, by using the console.table() utility function:
Go to the webpage that you want to inspect. For example, open the DevTools Console tool DOM interactions demo page in a new tab or window.
Press Ctrl+Shift+J (Windows, Linux) or Command+Option+J (macOS). The Console tool opens in DevTools, next to the webpage.
Paste the following code into the Console, and then press Enter:
console.table($$('img'), ['src','alt'])The list of
<img>elements on the webpage is displayed in the Console, formatted as a table, with each image'ssrcandaltattributes as columns: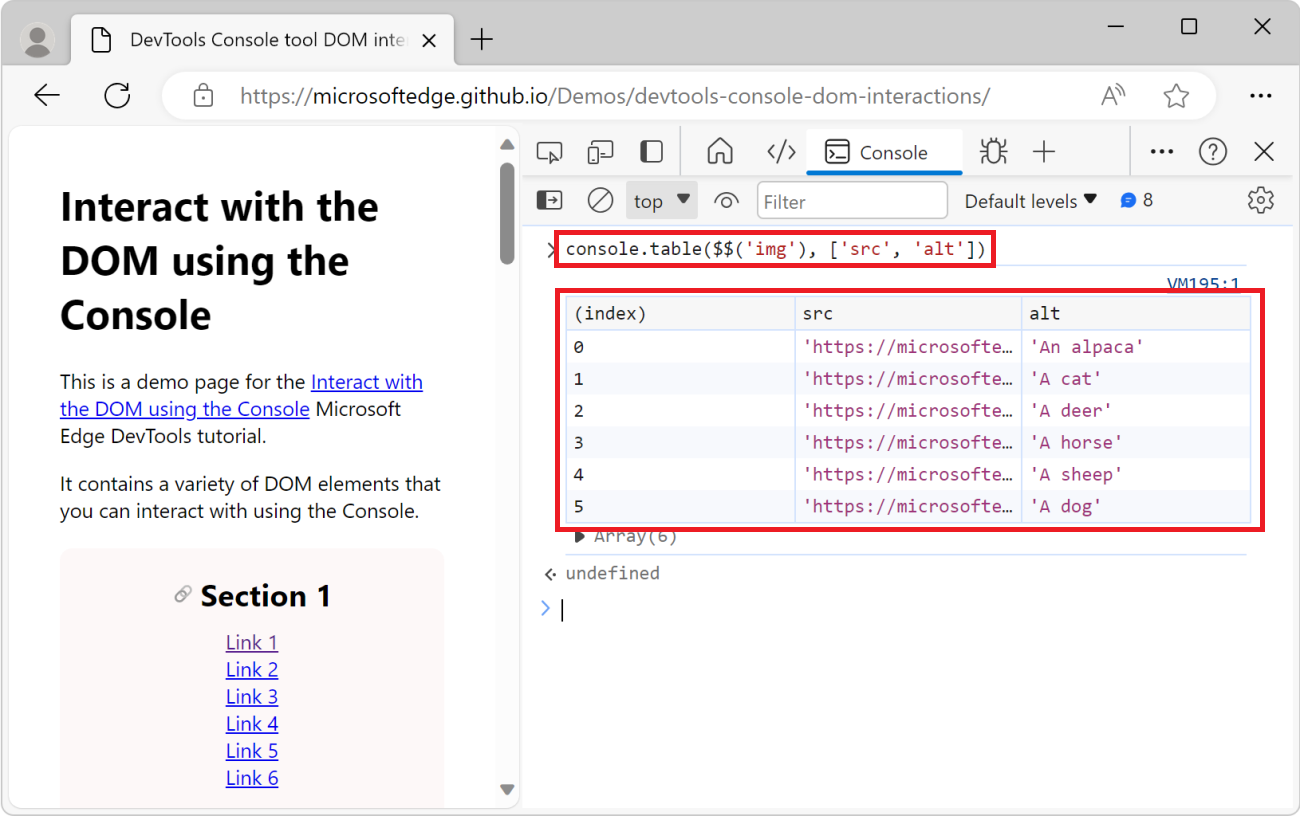
Get all page headings and anchor URLs
In this example, you get all the headings on the webpage that have an id attribute, and you generate a URL that points to each heading.
Go to the webpage that you want to inspect. For example, open the DevTools Console tool DOM interactions demo page in a new tab or window.
Press Ctrl+Shift+J (Windows, Linux) or Command+Option+J (macOS). The Console tool opens in DevTools, next to the webpage.
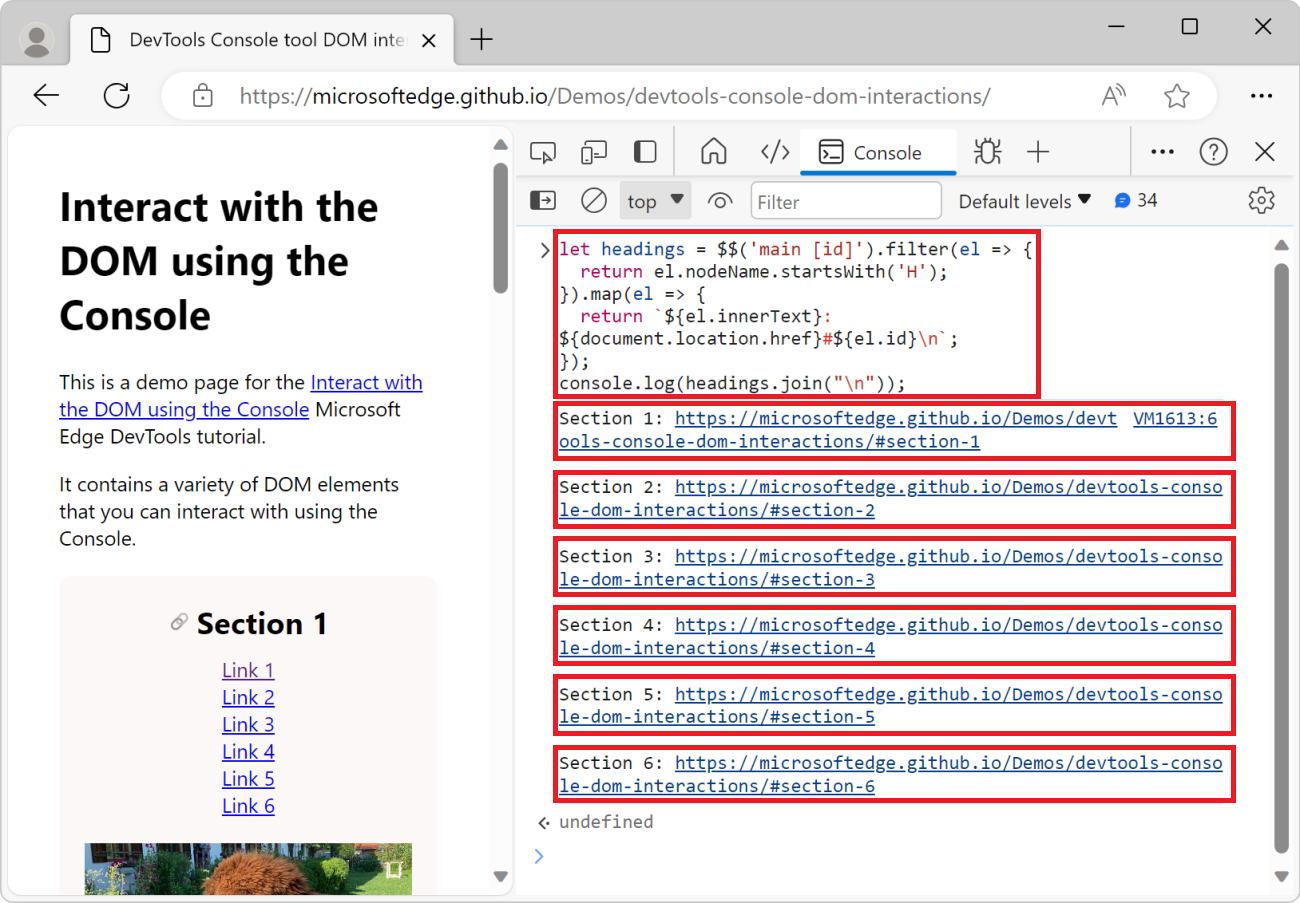
Copy and paste the following code into the Console, and then press Enter:
let headings = $$('main [id]').filter(el => {
  return el.nodeName.startsWith('H');
}).map(el => {
  return `${el.innerText}: ${document.location.href}#${el.id}\n`;
});
console.log(headings.join("\n"));
The result is text that contains content for each section heading, followed by the full URL for the section heading:
Copy information from the Console
In the previous examples, you generated lists of elements and strings of information. It can be useful to copy the generated information from the Console and paste it somewhere else.
To copy the return value from an expression that you run in the Console, use the copy() utility function:
Go to the webpage that you want to extract some information from. For example, open the DevTools Console tool DOM interactions demo page in a new tab or window.
Press Ctrl+Shift+J (Windows, Linux) or Command+Option+J (macOS). The Console tool opens in DevTools, next to the webpage.
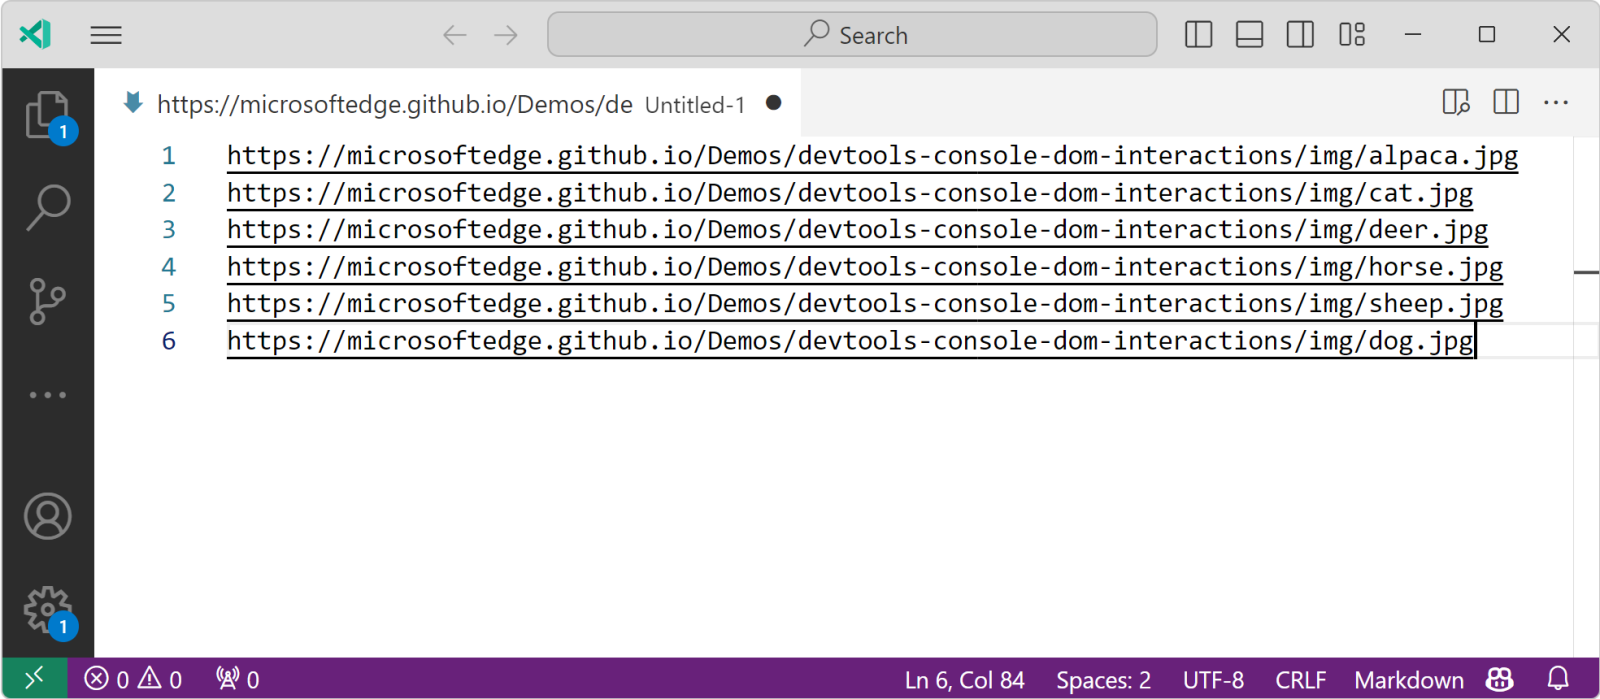
To copy the list of all image URLs on the page, enter the following code in the Console, and then press Enter:
copy($$('img').map(img => img.src).join("\n"));The
copy()utility function can take any argument that can be converted into a string and copies it to the clipboard. In this example, the argument is a string that contains all the image URLs on the page, separated by a new line.Open a text editor, such as Visual Studio Code, and then paste the copied image URLs into the editor:
Clear the Console
When running code in the Console, you often end up with many input statements and output results that you no longer need to display. You can clear the Console by using the clear() utility function.
List the event listeners that are assigned to an element
To list all event listeners that are assigned to an element, use the getEventListeners() utility function:
Go to the webpage that you want to inspect. For example, open the DevTools Console tool DOM interactions demo page in a new tab or window.
Press Ctrl+Shift+J (Windows, Linux) or Command+Option+J (macOS). The Console tool opens in DevTools, next to the webpage.
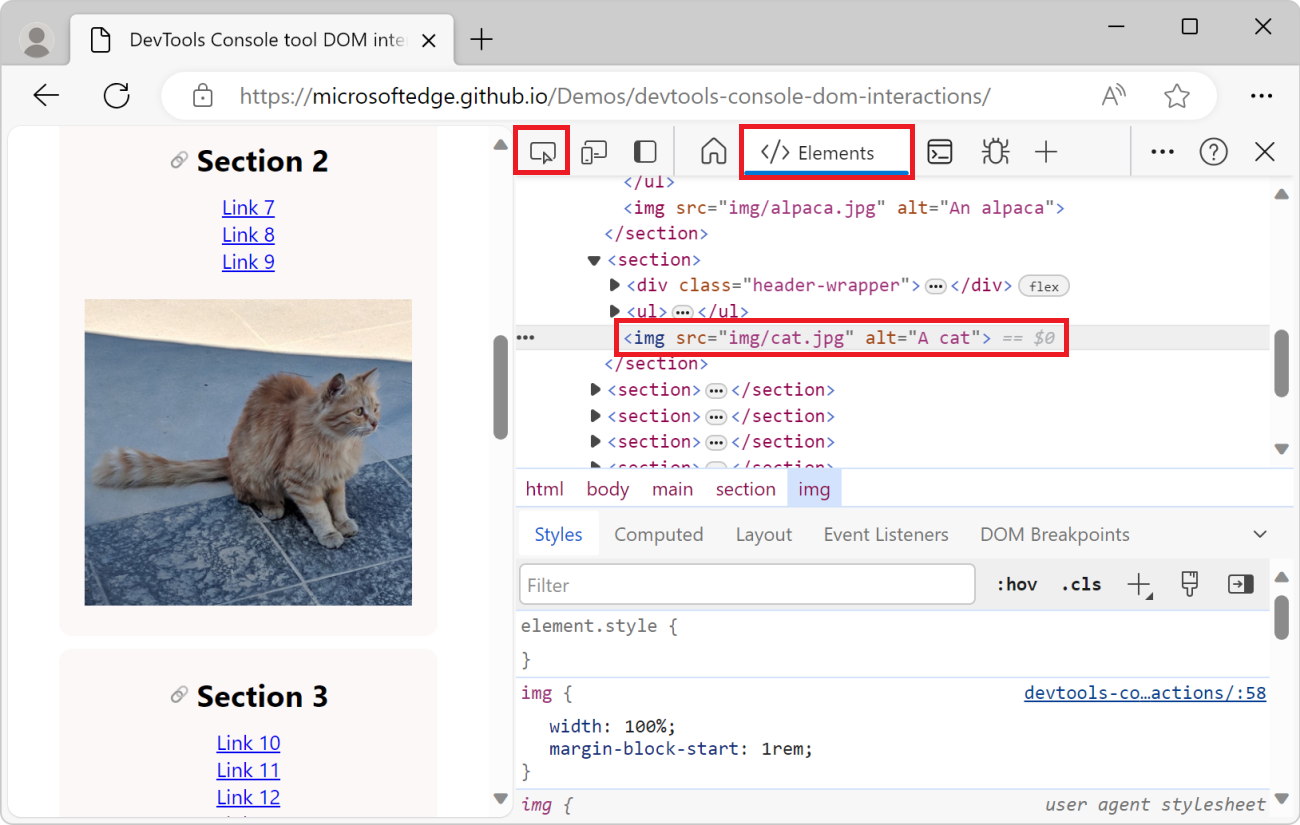
Click the Inspect tool, and then in the rendered webpage, click one of the images to select it. The Elements tool is displayed, and the image element you selected is highlighted in the DOM tree:
Open the Console tool, enter the following code, and then press Enter:
getEventListeners($0);In the above code snippet,
$0is a shortcut to the currently selected<img>element in the Elements tool. ThegetEventListeners()utility function returns an object that contains all the event listeners that are assigned to the image.Expand the object, and then expand the only event listener in the list to see the listener's properties. The
listenerproperty shows the name of the function that's called when the event is triggered (in this example,showImage):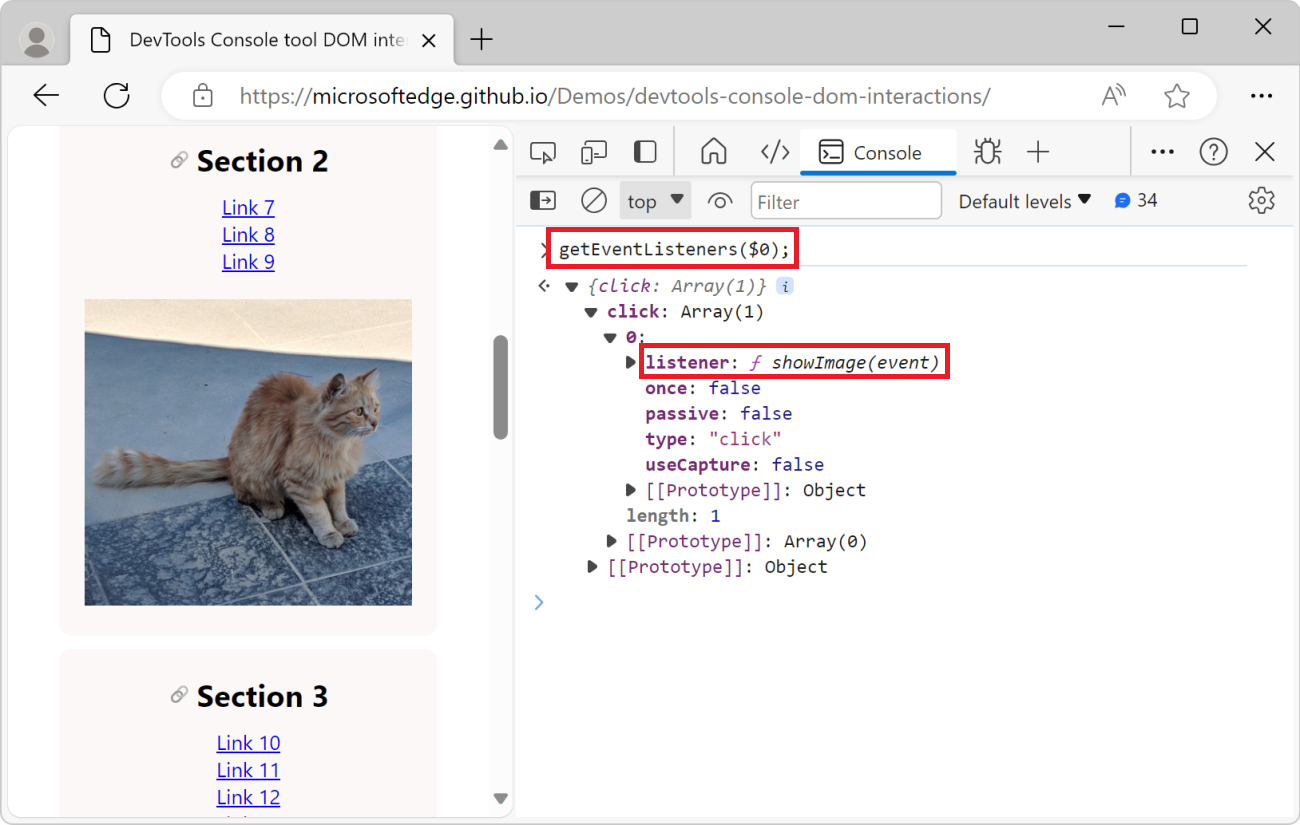
Monitor events triggered on the page
Websites that use JavaScript often react to user events that happen in the browser. It can be difficult to keep track of all the events that are triggered by the browser. The monitorEvents() utility function allows you to monitor events that are triggered on the webpage.
Monitor all events on an element
To start monitoring events:
Go to the webpage that you want to monitor. For example, open the DevTools Console tool DOM interactions demo page in a new tab or window.
Press Ctrl+Shift+J (Windows, Linux) or Command+Option+J (macOS). The Console tool opens in DevTools, next to the webpage.
To start monitoring the events triggered on an element, for example on one of the
<img>elements, enter the following code in the Console, and then press Enter:monitorEvents(document.querySelector('img'));The above code monitors all events that are triggered on the first
<img>element on the page.In the rendered webpage, hover over the image, and move your mouse, or tab to the image with the keyboard. Events such as
mouseover,mousemove, andfocusget logged to the Console: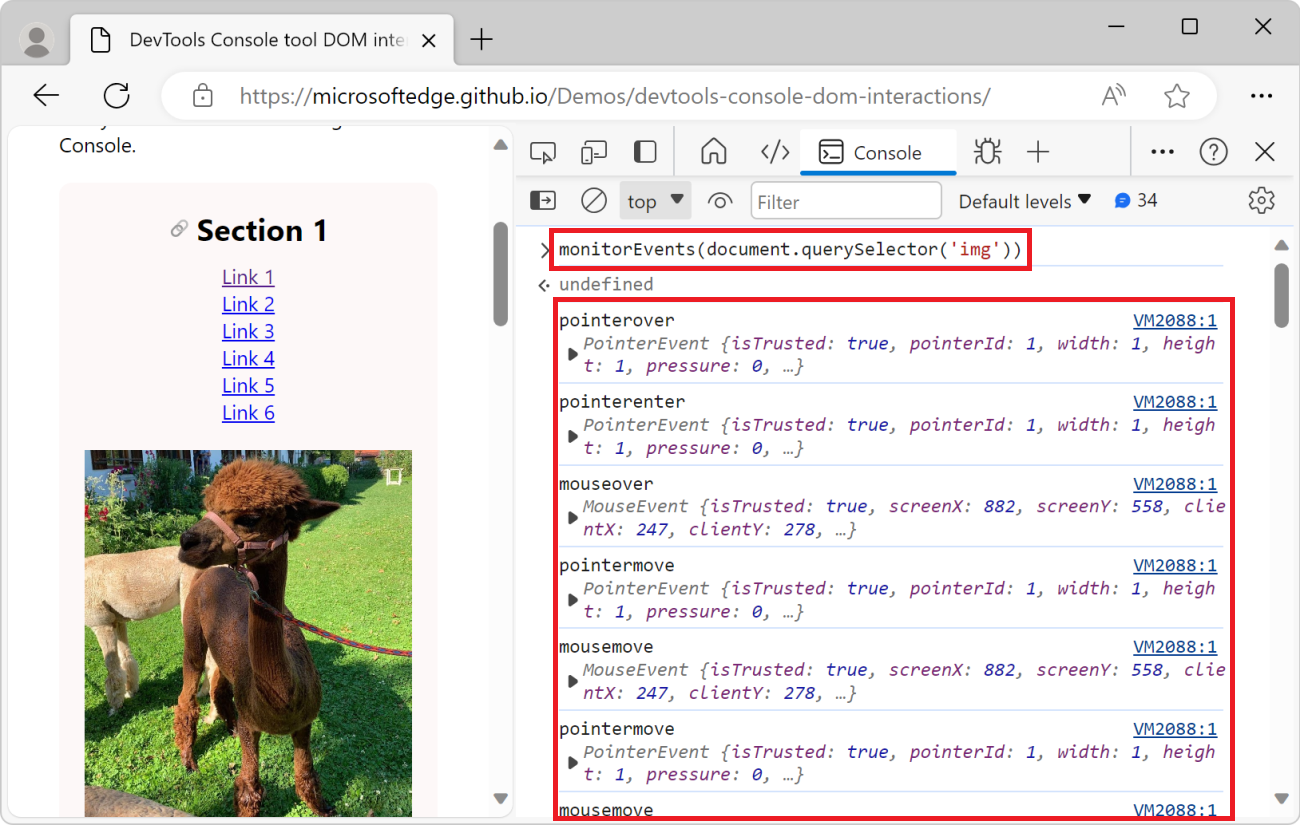
When you monitor events, you get logs in the Console every time an event is triggered by the browser. This can lead to a lot of noise in the Console. You can also monitor specific events on an element.
Monitor specific events on an element
To start monitoring specific events on an element:
Go to the webpage that you want to monitor. For example, open the DevTools Console tool DOM interactions demo page in a new tab or window.
Press Ctrl+Shift+J (Windows, Linux) or Command+Option+J (macOS). The Console tool opens in DevTools, next to the webpage.
To start monitoring only the mousedown, mouseup, and click events that are triggered on a the first
<img>element on the page, enter the following code in the Console, and then press Enter:monitorEvents(document.querySelector('img'), ['mousedown', 'mouseup', 'click']);In the rendered webpage, click the first image.
mousedown,mouseup, andclickevents get logged to the Console: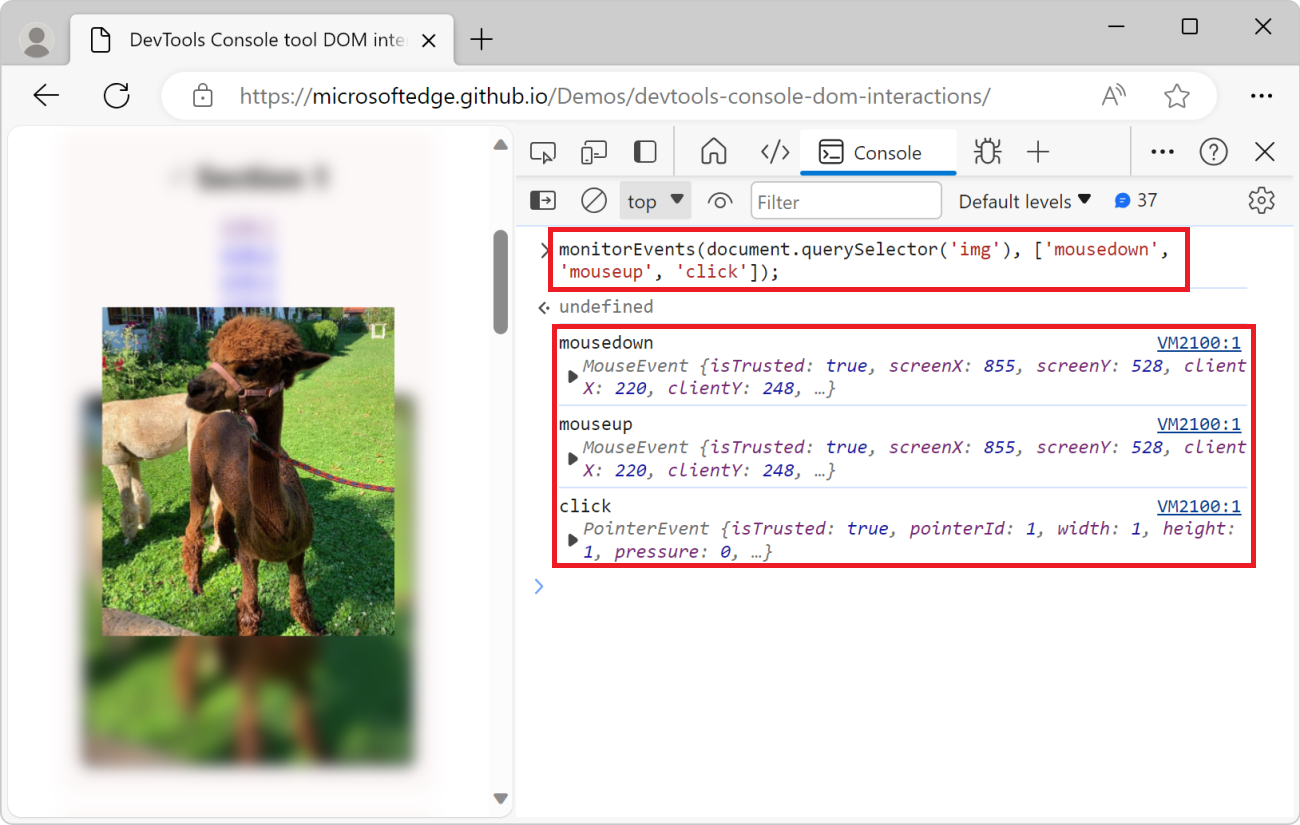
Monitor events on the Window
To get a notification in the Console every time you scroll or resize the window:
Paste the following code into the Console:
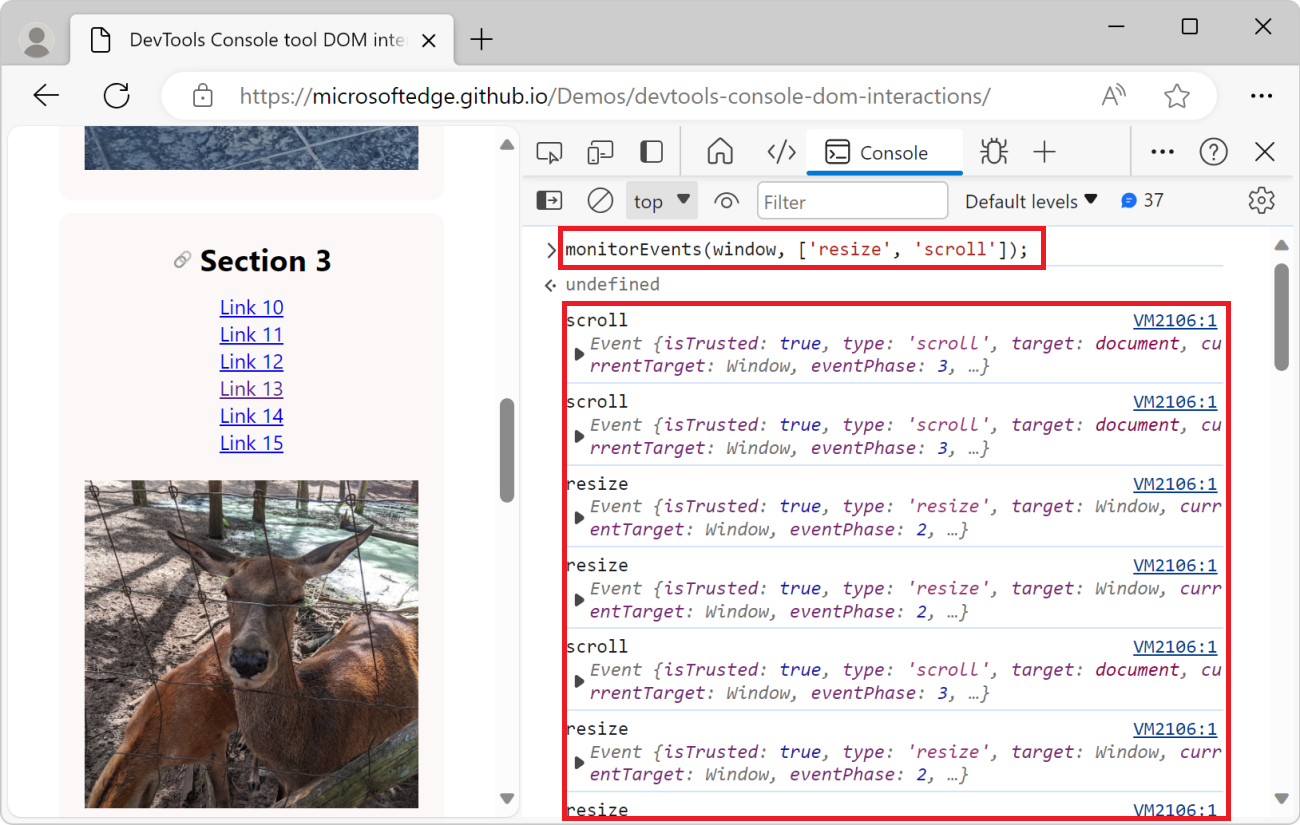
monitorEvents(window, ['resize', 'scroll']);Scroll the page and resize the browser window. The Console logs the events that are triggered:
Stop monitoring events
While monitoring events in the DOM, the Console can get noisy. To stop monitoring events, use the unmonitorEvents() utility function:
unmonitorEvents(document.querySelector('img'));
unmonitorEvents(document.querySelector('img'), ['mousedown', 'mouseup', 'click']);
unmonitorEvents(window, ['resize', 'scroll']);
Save DOM interaction scripts as snippets
If you enter the same DOM interaction code repeatedly in the Console, consider instead saving the code as a snippet and then running the snippet. Snippets are saved in the Sources tool, and you can run them from there or from the Command menu. To learn more, see Run snippets of JavaScript on any webpage.
See also
Feedback
Coming soon: Throughout 2024 we will be phasing out GitHub Issues as the feedback mechanism for content and replacing it with a new feedback system. For more information see: https://aka.ms/ContentUserFeedback.
Submit and view feedback for