Source Maps Monitor tool
Use the Source Maps Monitor tool to monitor which source files on your webpage requested loading of source maps, and whether the source maps were loaded. This tool is useful if your webpage uses source maps to map your reprocessed code to your original source code. Source mapping enables you to see and debug your original source code, rather than having to work with the reprocessed version of your code that's returned by the server.
To try this feature:
In a new tab or window, follow the instructions in Map the processed code to your original source code, for debugging, and then continue below.
Close the popup dialog that the demo opens.
In the Sources tool, in the Page tab, select the file that the demo created for you, such as Coffee2.js.
In DevTools, on the main toolbar, click the More Tools (
 ) button, and then select the Source Maps Monitor tool.
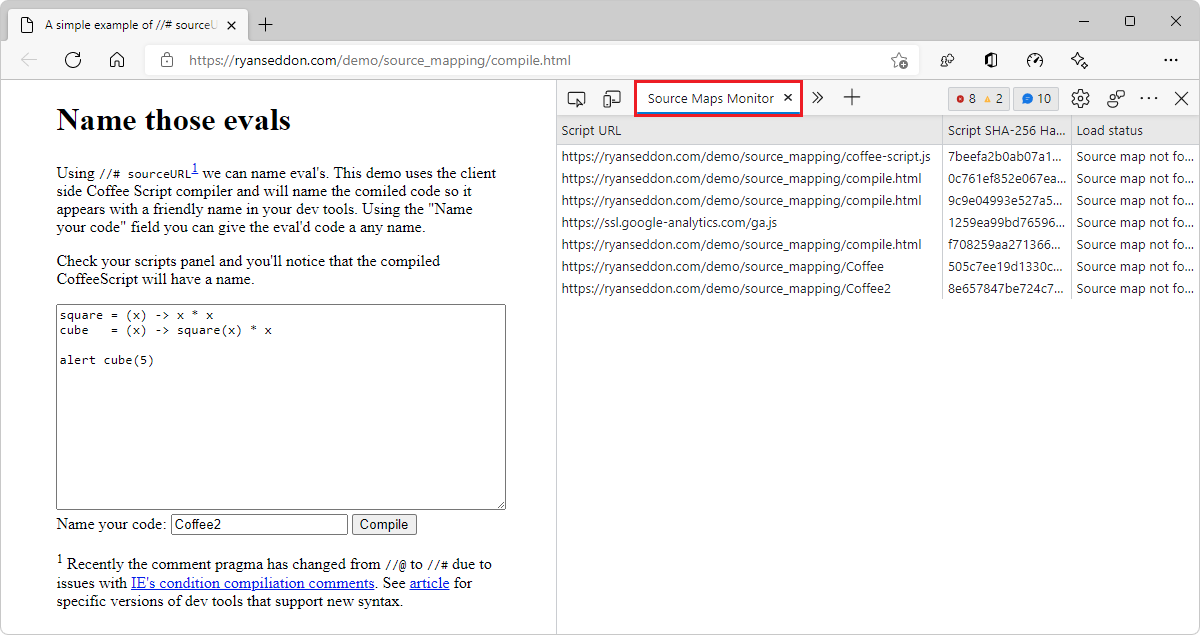
Exclusions and inclusions
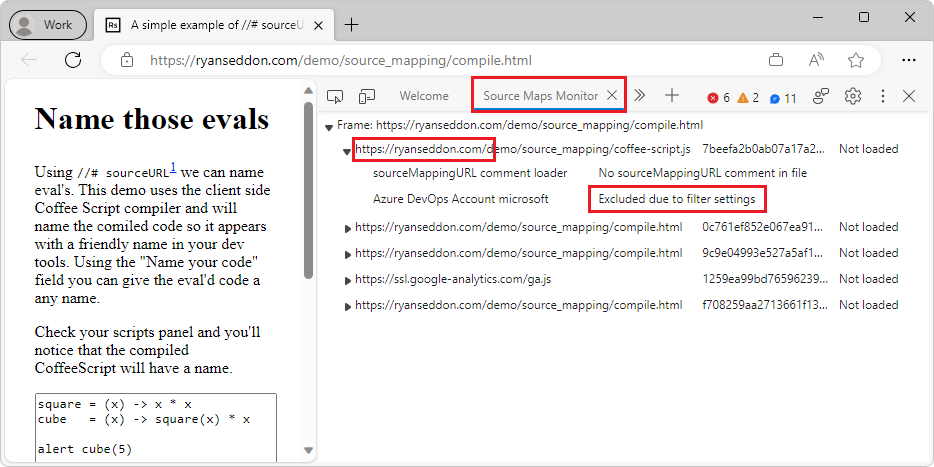
The Source Maps Monitor tool shows which URL lookups have or haven't been attempted, as configured in filter settings in DevTools Settings > Symbol Server > Filter behavior. For example:
Right-click a webpage and then select Inspect. DevTools opens.
Click the Settings (
 ) button, and then select Symbol Server.
In the Filter behavior dropdown list, select Exclusion List (or, select Inclusion List). If the Filter behavior dropdown list isn't displayed, set the Symbol Server settings, as described in the following articles:
In the Filter behavior text box, enter a domain with wildcard to exclude (or, to include), such as:
https://ryanseddon.com/*Close DevTools Settings.
In DevTools, select the Source Maps Monitor tool.
The Source Maps Monitor tool now indicates excluded (or, included) source map URL lookup attempts:
See also
- Map the processed code to your original source code, for debugging
- Securely debug original code by publishing source maps to the Azure Artifacts symbol server
- Securely debug original code by using Azure Artifacts symbol server source maps
- Sources tool now notifies you when sourcemaps can't be loaded in What's New in DevTools (Microsoft Edge 96).
Feedback
Coming soon: Throughout 2024 we will be phasing out GitHub Issues as the feedback mechanism for content and replacing it with a new feedback system. For more information see: https://aka.ms/ContentUserFeedback.
Submit and view feedback for