Monitor your connections
To access and manage your Microsoft Graph connectors, you must be designated as a search administrator for your organization. Contact your administrator to assign you the search administrator role.
Connection operations
In the Microsoft 365 admin center, go to the Connectors tab.
For each connector type, the Microsoft 365 admin center supports the operations shown in the following table.
| Operation | Connectors by Microsoft | Connectors by partners |
|---|---|---|
| Add a connection | ✔️ (see Setup overview) | ❌ (refer to your partner or custom-built connector admin UX) |
| Delete a connection | ✔️ | ✔️ |
| Edit a published connection | ✔️ Name and description ✔️ Connection settings ✔️ Property labels ✔️ Schema ✔️ Refresh schedule |
✔️ Name ✔️ Description |
| Edit a draft connection | ✔️ | ❌ |
Monitor your connection state
After you create a connection, the number of processed items shows on the Connectors tab on the Microsoft Search page. After the initial full crawl completes successfully, the progress for periodic incremental crawls displays. This page provides information about the connector's day-to-day operations and an overview of the logs and error history.
Five states show up in the State column against each connection:
Syncing. The connector is crawling the data from the source to index the existing items and make any updates.
Ready. The connection is ready, and there's no active crawl running against it. Last sync time indicates when the last successful crawl happened. The connection is as fresh as the last sync time.
Paused. The crawls are paused by the admins through the pause option. The next crawl runs only when it's manually resumed. However, the data from this connection continues to be searchable.
Failed. The connection had a critical failure. This error requires manual intervention. The admin needs to take appropriate action based on the error message shown. Data that was indexed until the error occurred is searchable. Next section talks about getting notified if such failures happen in a connection.
Delete Failed. The deletion of the connection failed. Depending upon the failure reason, the data might still be indexed, item quota might still be consumed, and crawls might still run for the connection. We recommend that you try deleting the connection again in this state.
Notifications for permanent crawl failures in your connections
The connection crawls are scheduled to run at specific times. The crawls can fail because of certain issues in the connections. Some times these issues are temporary and the crawls resume automatically and some times these failures are permanent where admin intervention is needed to start the crawls. In such cases of permanent failures, we mark the connection as "Failed" and send notifications to the Service Health Dashboard under the section: Issues for your organization to act on.
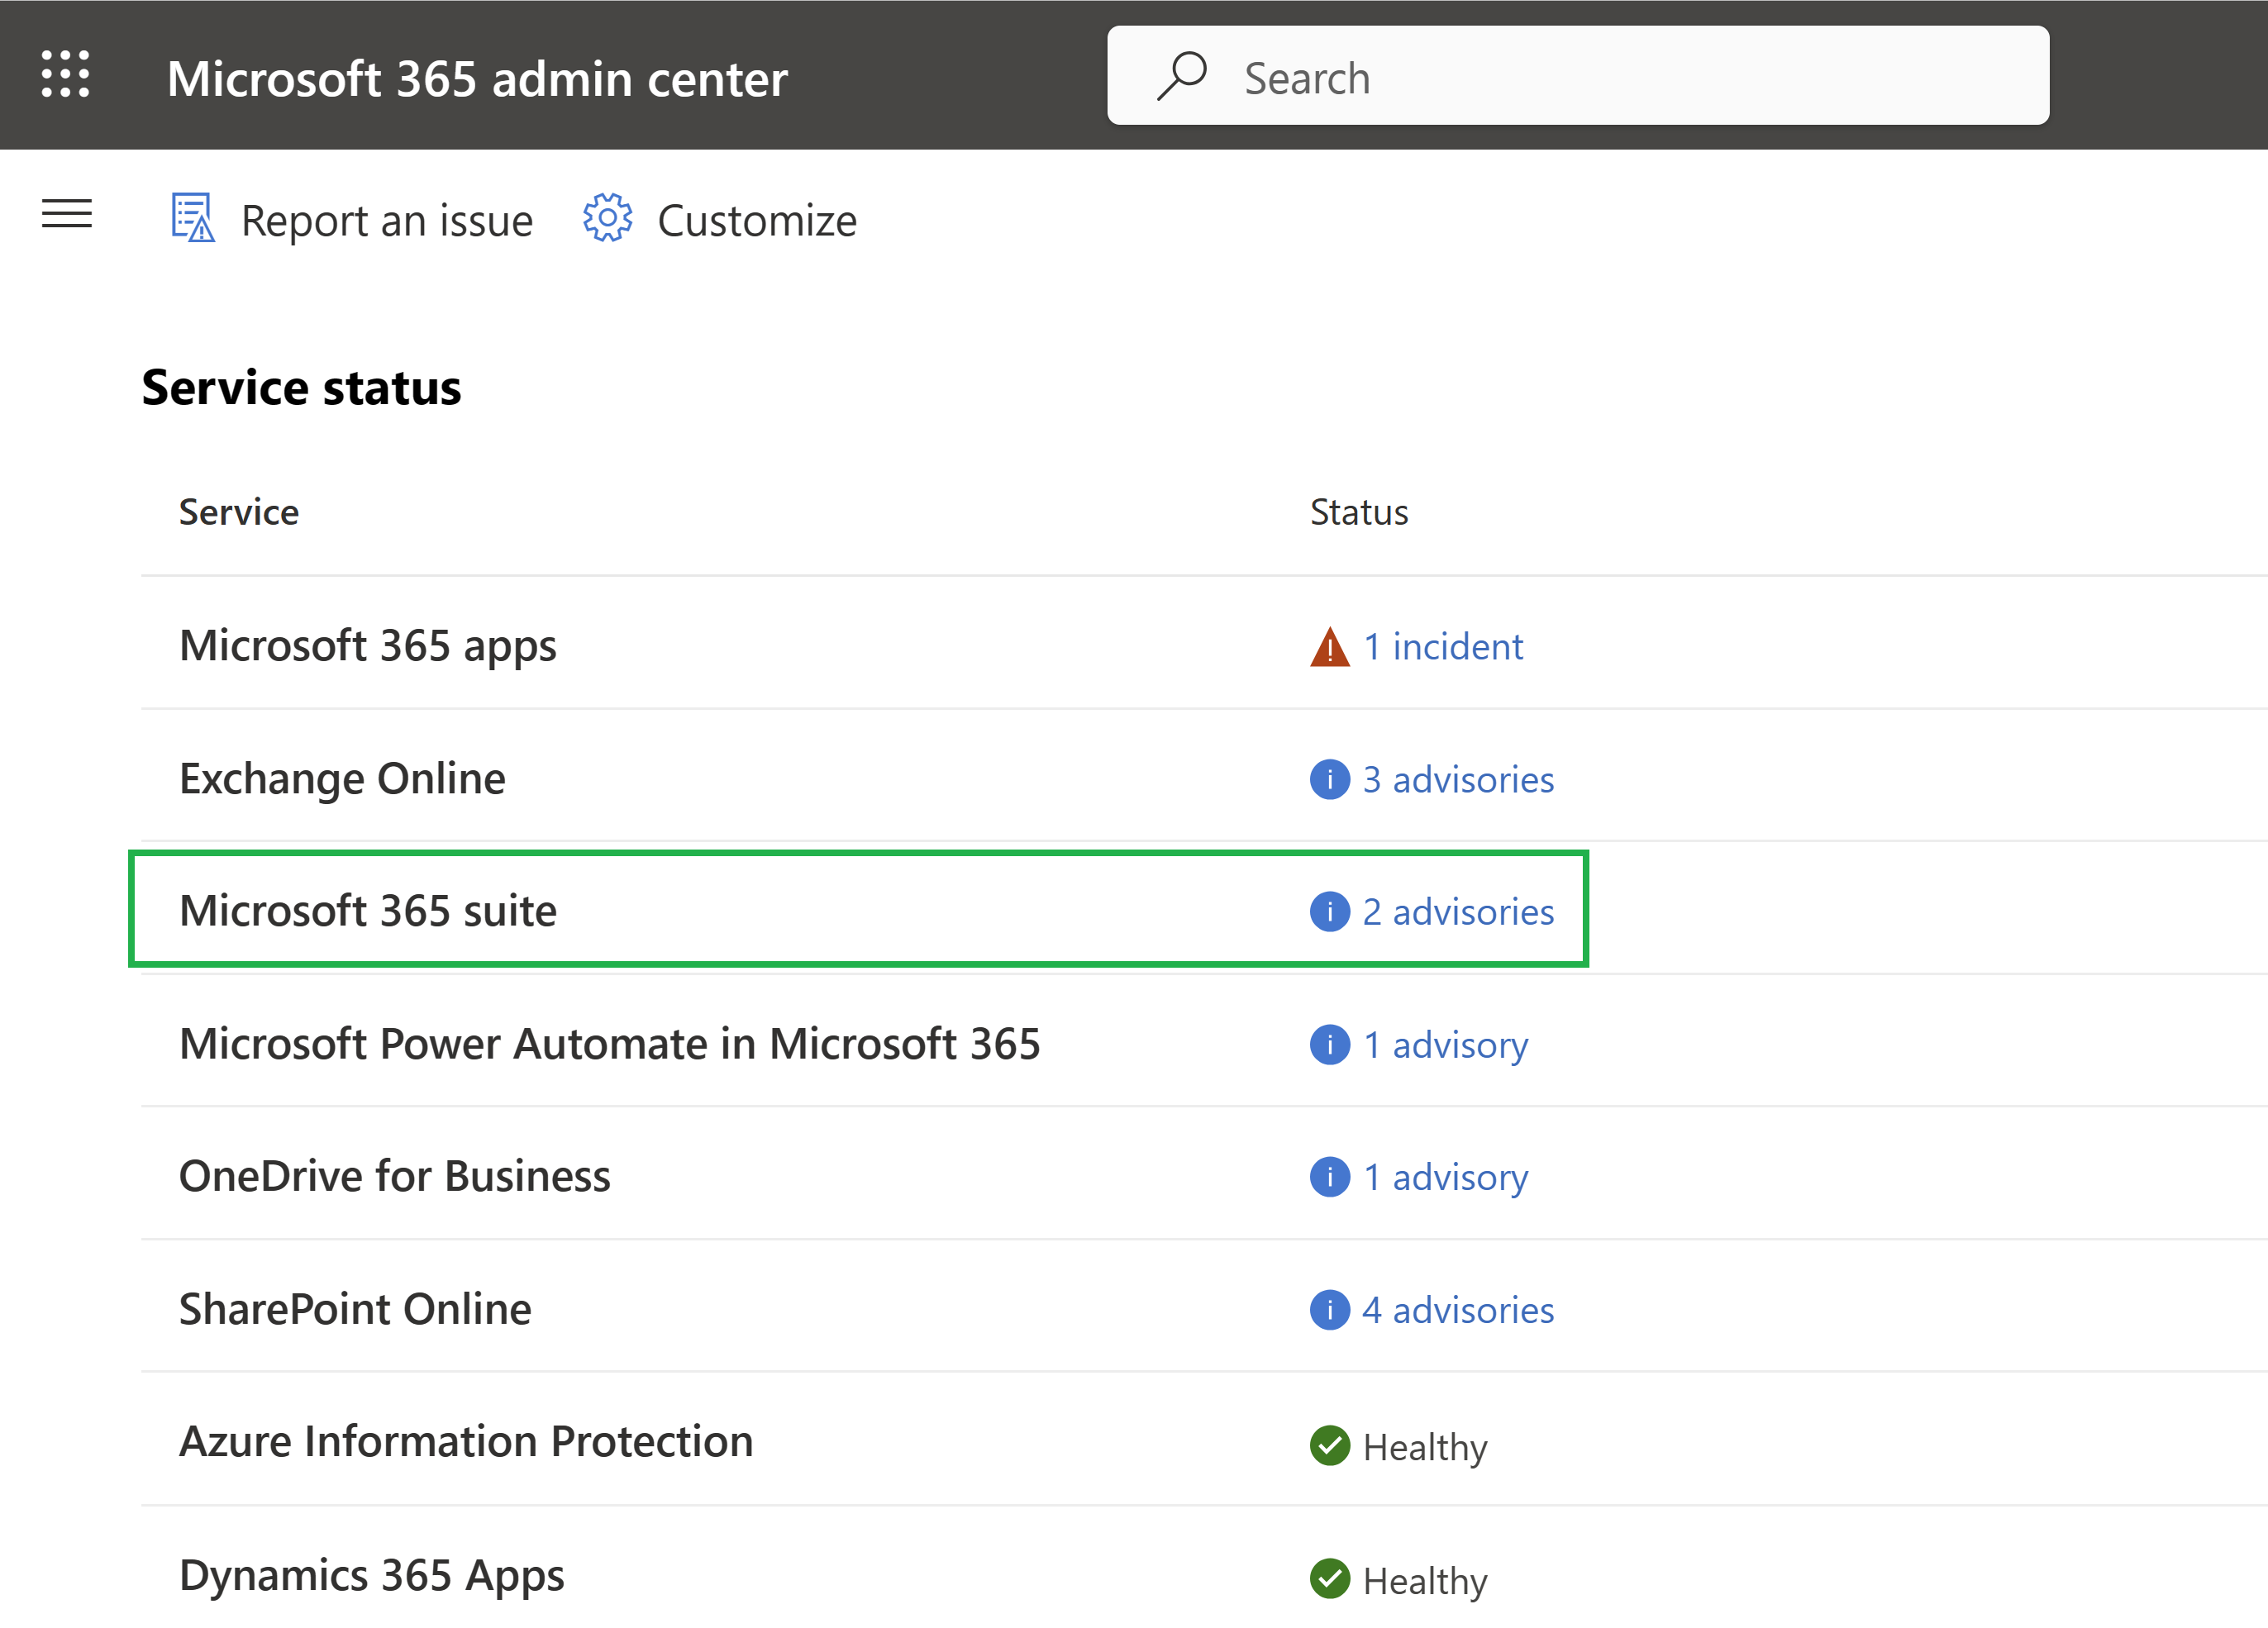
The same can also be seen in the form of Advisory in the "Service Status" section of Service Health page, under Microsoft 365 suite category.
If there are active notifications, admins get alerts in the form of notification bars in the Microsoft admin center home page. Notification bars contain the connectionId of the connection for which the crawls have failed. Admins can navigate to see more details of the notifications or remove the notification bars from the page.
Admins can check the notification details by clicking the notification.
Some points to note:
- The notification is live in the Service Health Dashboard for six days. After that the notification is automatically moved to the "Issue History" section where the same is stored for a maximum of 30 days.
- If the connection resumes the crawl, the notification is automatically moved to the "Issue History" section.
- No new notification is sent for the same connection until the crawls on that connection restart. Once the crawls are restarted and if a failure happens again, a new notification is sent.
- If there are crawl failures in multiple connections, each connection has a separate notification bar in the admin center home page and service health dashboard landing page.
Subscribing for getting notifications in e-mail
To get these failure notifications and updates on the e-mail, admins can add up to two e-mail addresses for the same.
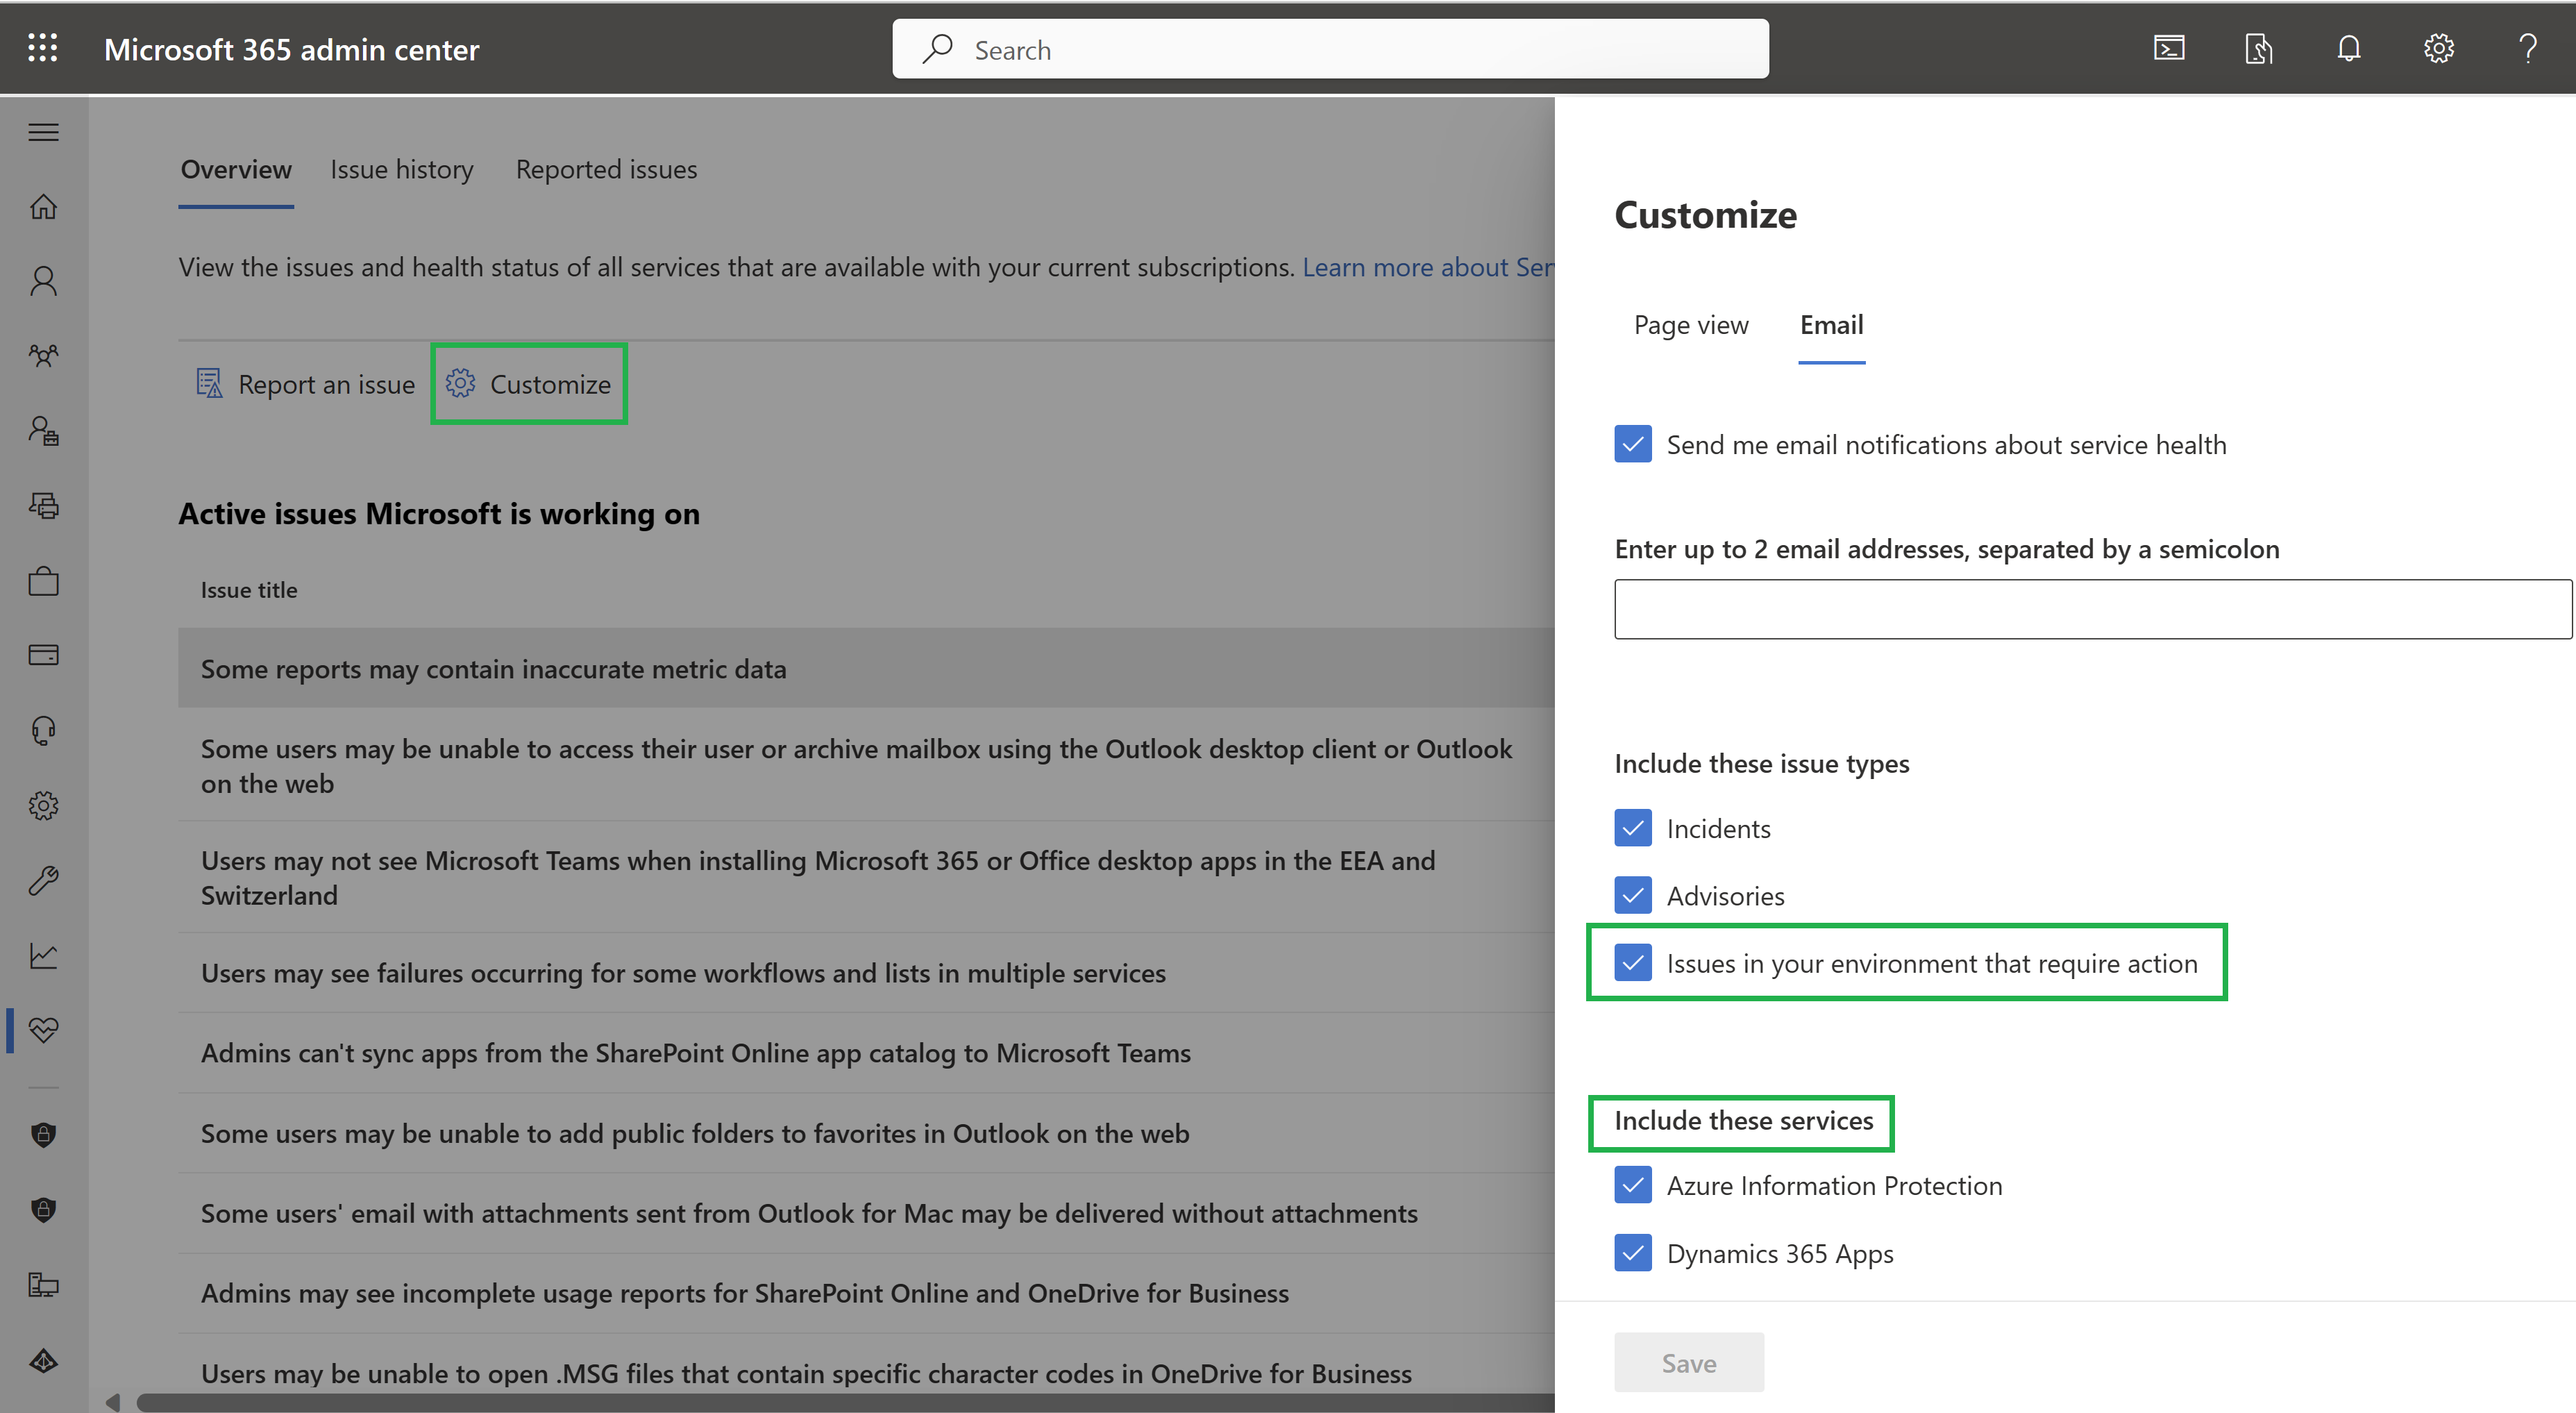
- Go to Customize section in Service Health page and open the Email tab.
- Select the check box for - Issues in your environment that require action.
- In the "Include these services" section, select Microsoft 365 suite. Admins get all notifications for Microsoft 365 suite, including Graph connector notifications, after they subscribe to the service health notifications.
- Save
Manage crawls in your connections
During connection creation or edit connection flow, you can configure the crawl schedule through Refresh Settings. To learn more about different types of crawls available see: Setup Overview.
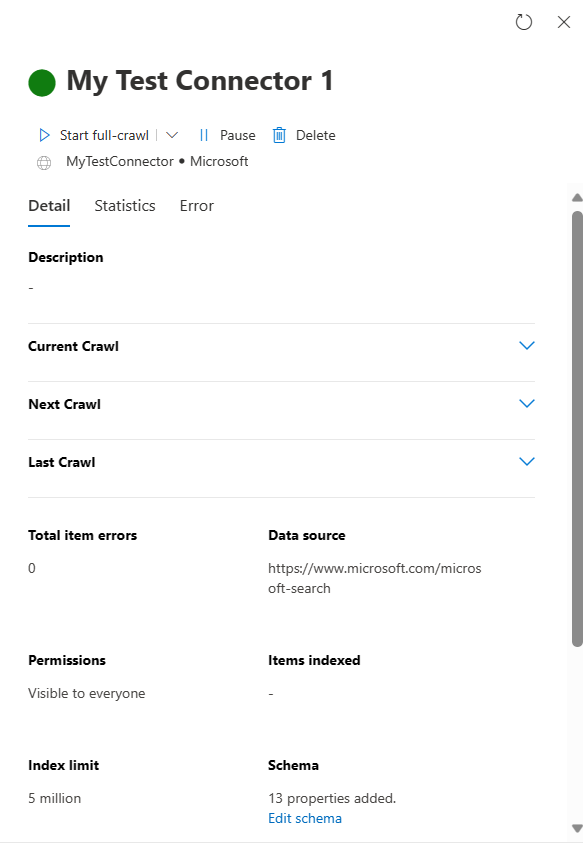
Apart from the scheduled crawls, you can run on-demand crawls for your connection through the connection pane.
On-demand crawl helps you start a crawl irrespective of the crawl schedule. You can choose to run a full or incremental crawl using the drop-down as shown in the image:
Note
Graph Connector Agent, only from version 2.1.0.0 onwards, supports on-demand crawl.
There can be only one category of crawl, scheduled or on-demand, running on a connection at any time. If a connection is in "Syncing" state, on-demand crawls are disabled. Scheduled crawls are auto triggered.
If a scheduled or an on-demand crawl continues beyond the time of the schedule of the next full or incremental crawl, the ongoing crawl is stopped, and the next scheduled crawl is skipped and queued. After the ongoing crawl completes, the crawl of the opposite type (full or incremental) is picked from the skipped queue and triggered. For example, if the previous crawl was of the type full crawl, only the incremental crawl, if present in the skipped queue, is triggered and vice versa.
Monitor your index quota utilization
The available index quota and consumption is displayed on the connectors landing page.
The quota utilization bar indicates various states based on consumption of quota by your organization:
| State | Quota utilization levels |
|---|---|
| Normal | 0–79% |
| High | 80–89% |
| Critical | 90%–99% |
| Quota Exceeded | >=100% |
The number of items indexed is also displayed with each connection. The number of items indexed by each connection contributes to the total quota available for your organization.
When index quota is exceeded for your organization, all active connections are impacted, and those connections operate in a limit exceeded state. In this state, your active connections:
Will not be able to add new items.
Are able to update or delete existing items.
To fix this, you can do any of the following actions:
Purchase index quota for your organization, to learn more see: Licensing requirements and pricing.
Identify connections that have some items that you didn't want to index. To update this connection, you must delete and create a new connection with a data source exclusion filter to exclude the items you don't want to index anymore.
Permanently delete one or more connections.
Feedback
Coming soon: Throughout 2024 we will be phasing out GitHub Issues as the feedback mechanism for content and replacing it with a new feedback system. For more information see: https://aka.ms/ContentUserFeedback.
Submit and view feedback for


