Downloads hub - Cloud product performance
Appropriate roles: Cloud product performance: Executive report viewer | Report viewer
All reports
This section is for downloading reports related to any program. It's highly flexible in terms of how users interact with the data. Below are the main functions of this area:
- Favorites: All templates that are added as favorites appear in this section.
- Reports: You can find all of the reports available for download here, and the ones scheduled or running in the list. The reports table has the following details for each report:
- Report name: Shows the user the defined name or the default name based on the report type for the unique identification of the report.
- Report type: Shows the data source selected during the report creation.
- Status/Actions: Shows the status of the Download. These statuses can be running, preparing for download, or it can be a download link when the report is ready for download.
- Columns included: Shows the list of columns selected for download.
- Filters applied: Shows the columns on which filters are applied.
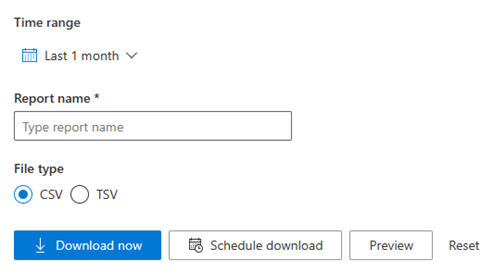
- Time range: Shows the time range for which the report is generated. If you don't choose a predefined format, this field shows custom.
- Generation timestamp (UTC): Shows the exact time and date (in UTC) when the report was generated.
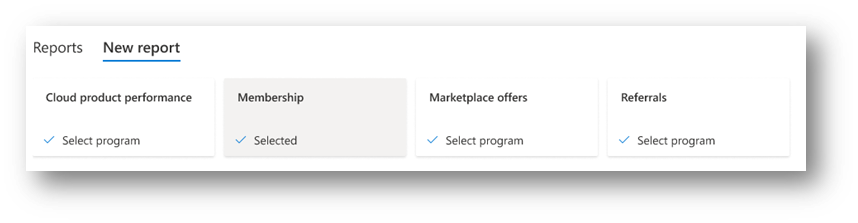
Create a new report
You can create, download or schedule downloadable reports. You can select the following paths:
- Basic: You can generate a report with the steps you're already familiar with in the classic download reports view.
- The path for basic is Program > Report name > Select columns (Optional) > Select time range > Update the file name > Select the file type > Preview report and select on download.
- Advanced: With the advanced path, you have the ability to create templates, apply filters, schedule reports, and access the curated list of areas and templates, which would help in report discovery and usability.
Common elements
Program selector: You need to select the program for which you want to download the report.
Report name: A generic name is added to the report by default. You can update this name to any string and the downloaded file name have the same name.
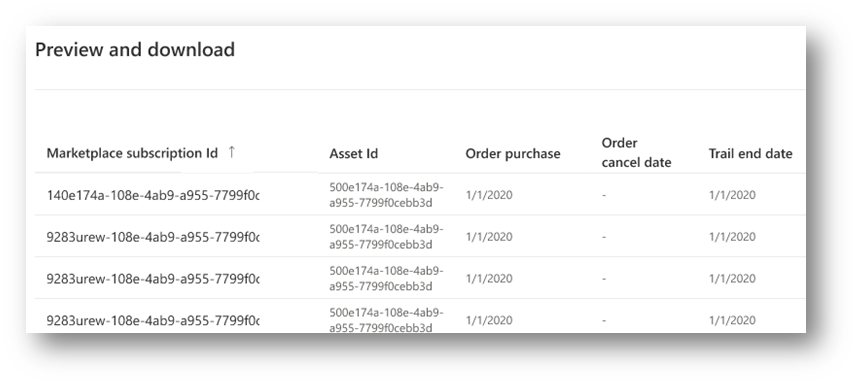
Preview data: You can preview the data after you've selected any of the templates (or columns and filters). The first 15 rows of data are shown based on their selection. This is a change from how report generation works currently.
Basic download options
Column selector: The ability to select the columns, which are available for a report.
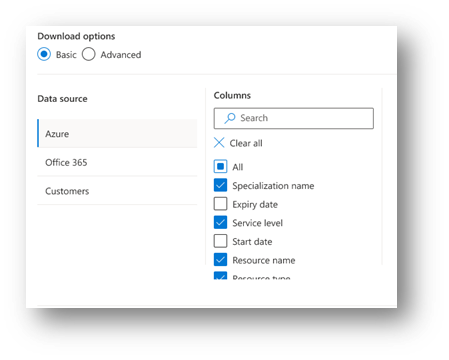
Advanced download options
Area: A segment or logical grouping of the various formats of the reports. This is helpful to reflect a familiar business use case in mind. Area is optional and would only be visible for any data sources, which have areas stored. This is applicable for a lesser number of data sources.
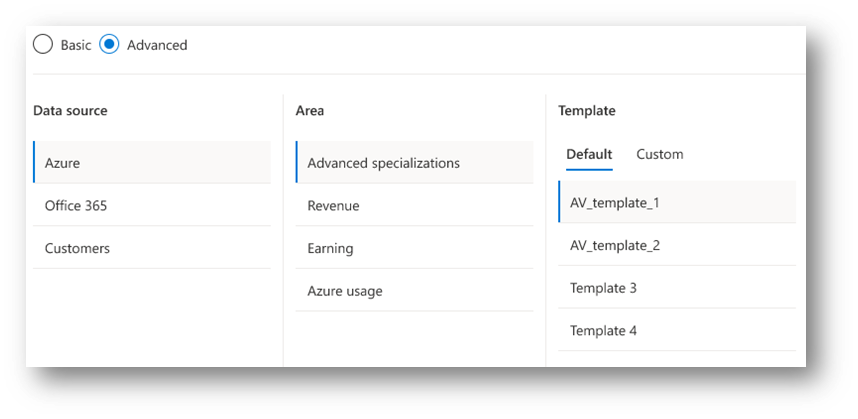
Template: Templates are the preselected group of column and filters that are applied to the report before downloading.
- Default templates - Curated templates, which can apply to any generic use case.
- Custom templates - You can create a template using any set of columns and filters.
Column selector - Ability to select the columns, which are available for a report. You might or might not need all of the columns available in the report, which is true for reports such as Azure usage, which has around 40 columns.
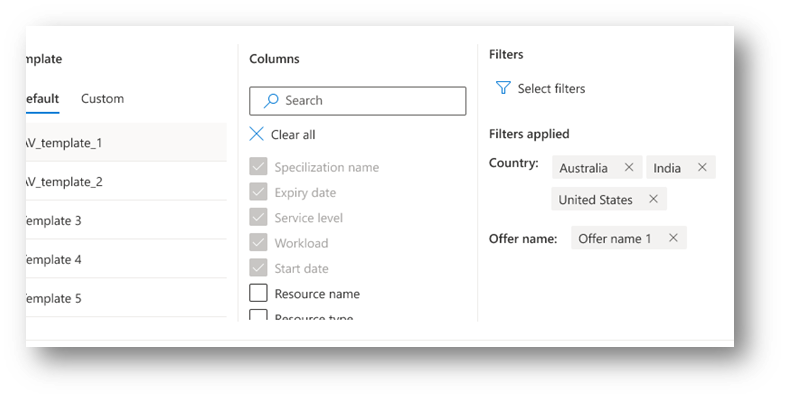
Filter selection: Ability to apply filters on the column selected. This is important for Power users to have a clear understanding of the data and create purpose driven reports in any analytics tool.
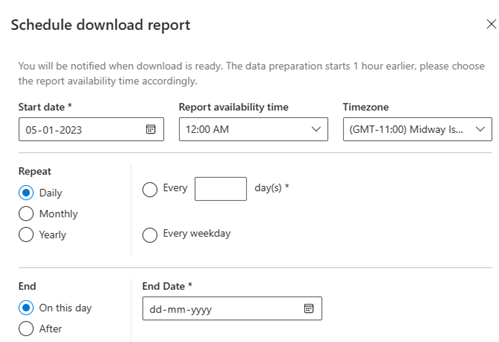
Scheduling the report: Ability to schedule a report with required frequency (Daily, Monthly or any combination of dates for the frequency possible).
Adding to favorites: Frequently used templates can be saved as favorites, which can be accessed on the download reports landing page. There can be up to five favorites for the user. Any new favorites prompt the user to replace an existing favorite to make room for the new one.
- Only user defined templates can be added to the favorites.
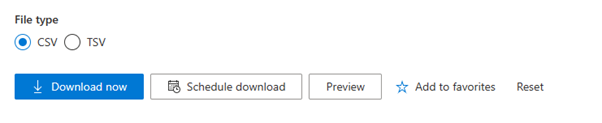
Reset the report creation: If you make an error, you can reset the selection, which removes all the selections made in area, template, columns, and filters.
Reports scheduled
You can find all of the reports scheduled under the Reports Scheduled section.
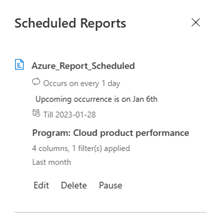
The following details are displayed in this section:
- Report name: Shows the user the defined name or the default name based on the report type for unique identification of the scheduled report.
- Occurrence count: Shows the number of occurrences, which are planned as per the user.
- Program details: Shows the program name to which the report belongs.
- Columns and filter details: Shows the count of selected columns and filters applied.
- Time range: Shows the time range for which the report is scheduled.
Limits to consider
- Favorites: 30 per program
- Templates: 200 per program
- Five reports in download can now complete in 60 minutes
Restrictions on the scheduling of reports
Because scheduling of the reports results in preparing the report for download, there's opportunity for the scheduling of the reports to be misused. To avoid such scenarios, there are two-level restrictions on the scheduling of the reports:
Program level total scheduled reports count:
- Level 1: Per program: 40 scheduled reports per user
- Level 2: Allowed maximum time range restriction when scheduled reports are selected
| Scheduling frequency | Month time range allowed |
|---|---|
| Daily | Last 30 days |
| Weekly | Last 30 days |
| Monthly | Last two years |
| Yearly | Lifetime or last years (as applicable) |
Users can't create more than allowed count of scheduled reports and the time range has to comply, as shown in the scheduling frequency.
Scheduled report execution limits
- Daily: Six months (180 executions)
- Weekly: One year (52 executions)
- When the selection for daily is more than seven days
- Monthly: Two years (24 executions)
- Yearly: Five years (five executions)
Note
You can download reports for two years at a time and the date selection can't be more than the previous three years.
For example, if you want to download data from January 2020 to January 2023, you can't download the three-year report at once. You must download two reports with different timelines and combine the data after. One report can be January 2020 to January 2021 and the second report can be January 2021 to January 2023 (a two-year time range is the maximum).
Next steps
Feedback
Coming soon: Throughout 2024 we will be phasing out GitHub Issues as the feedback mechanism for content and replacing it with a new feedback system. For more information see: https://aka.ms/ContentUserFeedback.
Submit and view feedback for