Use a data source to insert pins
You can load a table that contains existing data into the map control. The control will then plot each row in your table as a map pin.
Prerequisites
- Create a Canvas app and make sure it meets the Geospatial prerequisites.
- In your app, insert a map.
Add pin data from an Excel workbook
Your data source needs to contain a named table with the following columns that should then be mapped to the associated property in the control's Advanced pane.
| Column description | Maps to property | Required |
|---|---|---|
| Label for the pin | ItemsLabels | Required |
| Longitude of the pin | ItemsLongitudes | Required |
| Latitude of the pin | ItemsLatitudes | Required |
| Color of the pin | ItemsColors | Optional |
| Icon for the pin | ItemsIcons | Optional |
The color field accepts any CSS string, as defined in Color enumeration and ColorFade, ColorValue, and RGBA functions in Power Apps.
You can use the icons described in the List of image templates topic as your icon.
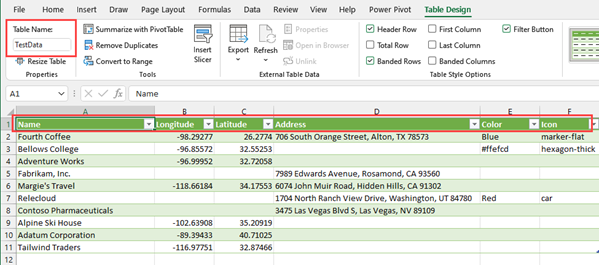
The following Excel table shows the required columns:
You can copy the following sample data to test this functionality:
| Name | Longitude | Latitude | Color | Icon |
|---|---|---|---|---|
| Fourth Coffee (sample) | -98.29277 | 26.2774 | Blue | marker-flat |
| Litware, Inc. (sample) | -96.85572 | 32.55253 | #ffefcd | hexagon-thick |
| Adventure Works (sample) | -96.99952 | 32.72058 | car | |
| Fabrikam, Inc. (sample) | -118.30746 | 34.86543 | ||
| Blue Yonder Airlines (sample) | -118.66184 | 34.17553 | ||
| City Power & Light (sample) | -113.46184 | 37.15363 | ||
| Contoso Pharmaceuticals (sample) | -80.26711 | 40.19918 | ||
| Alpine Ski House (sample) | -102.63908 | 35.20919 | ||
| A Datum Corporation (sample) | -89.39433 | 40.71025 | ||
| Coho Winery (sample) | -116.97751 | 32.87466 |
Copy and paste the table into a new data source. In this example, we are using an Excel workbook.
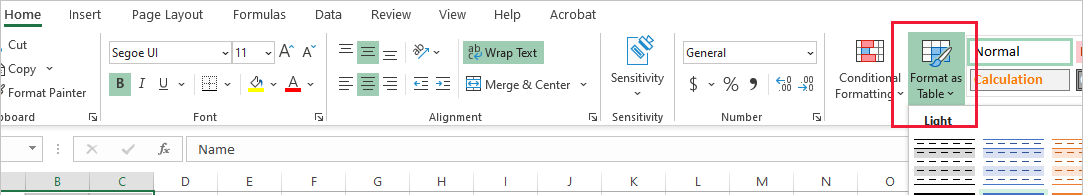
Select one of the cells, and then on the Home tab in the ribbon, select Format as Table and choose any style, and then OK.
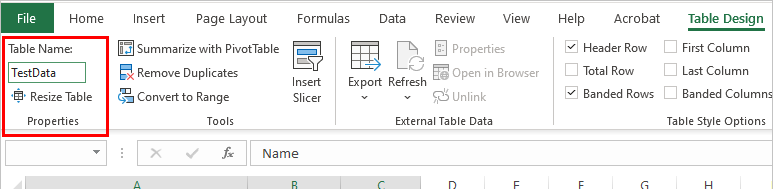
Select the table, and then go to the Table Design tab on the ribbon. Enter a name for the table under Table Name:, for example TestData.
Save the workbook.
Open or create a new app in Power Apps, and insert the map control.
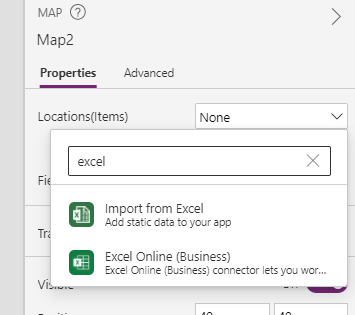
On the Properties pane, select the Locations(Items) field and then search for excel and select Import from Excel.
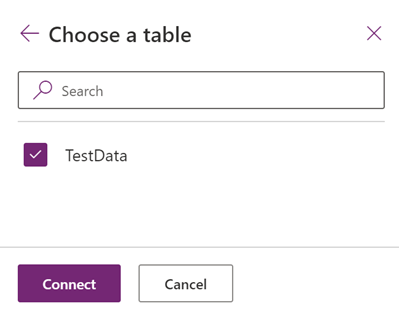
Locate the Excel workbook and then select Open. Select the table that contains the information, TestData, and then Connect.
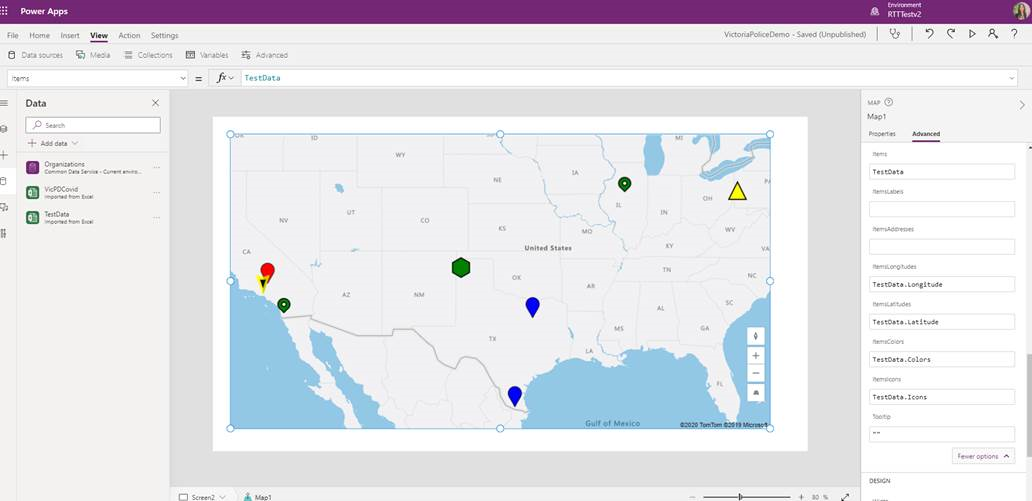
On the Properties pane, go to the Advanced tab, and select More options.
Set the following properties:
- ItemsLabels as "Name"
- ItemsLatitudes as "Latitude"
- ItemsLongitudes as "Longitude"
- (Optional) ItemsColors as "Colors"
- (Optional) ItemsIcons as "Icons"
The map control will now show each row in the table as a pin, labeled with its Name as defined in the Excel table, and using the provided icons and colors. If an icon or color isn't provided, then the control will use the default icon and color.
Note
Each map control can display up to 5000 pins from latitude or longitude and 50 pins from addresses. The pin limit is lower for addresses as the map needs to geocode these addresses into latitude or longitude to display them. We recommend not using addresses where possible. You can save geocoded addresses back to your data source.
When both latitude or longitude and an address is given for a single pin, the map control will prioritize using the latitude or longitude to avoid geocoding the address.
Save geocoded addresses from map control to data source
To avoid geocoding the same set of addresses every time the map control is launched, you can save the geocoded addresses back to the original data source, such that when the map relaunches, it will use the latitude and longitude instead of geocoding the addresses again.
To do so, add a button to save the geocoded address back to the original data source with the following formula:
ForAll(Map1.GeocodedItems, Patch(Accounts1, LookUp(Accounts1, ThisRecord.Address = Address && ThisRecord.Name = Label), {Latitude: Latitude, Longitude: Longitude }))

Other interactive map features
Other geospatial controls
To see dynamic address suggestions as you type, use the Address input control.
Feedback
Coming soon: Throughout 2024 we will be phasing out GitHub Issues as the feedback mechanism for content and replacing it with a new feedback system. For more information see: https://aka.ms/ContentUserFeedback.
Submit and view feedback for