Design refreshable reports in Excel with Power BI data
Now that you've created an Excel workbook with refreshable Power BI data, you can start analyzing your data and designing reports in the workbook using familiar spreadsheet functionality.
You've connected to the Power BI semantic model in one of two ways:
- If you connected using Analyze in Excel or the Power BI semantic model experience in Excel, your Excel workbook contains an empty PivotTable and Fields list from the Power BI semantic model.
- If you connected via export with live connection, your Excel workbook contains an Excel table.
Prerequisites
- Your organization’s tenant administrator must enable the Users can work with Power BI semantic models in Excel using a live connection tenant setting. Learn more about the Excel live connection tenant setting in the admin portal documentation.
- For on-premises datasets, your organization’s tenant administrator also must enable the Allow XMLA endpoints and Analyze in Excel with on-premises datasets tenant setting. Learn more about the Allow XMLA endpoints tenant setting in the admin portal documentation.
- You must have Build permission to the Power BI semantic model or have at least a Contributor role in the Power BI workspace containing your semantic model.
- You must have a Power BI license: Fabric (free), Pro or Premium Per User (PPU). Fabric (free) license users can only work with datasets in My workspace or a Premium capacity or Fabric F64 or greater capacity. Learn more about Power BI licenses.
- You can use Excel workbooks containing refreshable Power BI data in both Excel Desktop and Excel for the web.
Analyze your Power BI data with PivotTables
With Analyze in Excel or the Power BI semantic model experience in Excel, you've connected to a Power BI semantic model that you want to explore in Excel. The Excel workbook contains a Power BI connection string that links your Excel workbook to the Power BI semantic model.

Start adding fields from the PivotTable Fields into the Excel grid to create your own PivotTable report or perform validation analysis on your data.

Analyze your Power BI data with Excel tables
With the export with live connection, you can create an Excel workbook containing an Excel table connected to Power BI. This Excel workbook also contains a Power BI connection string that links your Excel workbook to the Power BI data.

You can customize the table by adding unique formatting to the Excel table. That formatting is preserved when you refresh the data in Excel.

Refresh the data
Whether you have an Excel PivotTable or table connected to a Power BI semantic model, you can update data in your Excel workbook by either refreshing a specific object (PivotTable, Pivot Chart, or table), or by refreshing all objects connected to a specific Power BI semantic model.
Refresh a single object
To refresh a specific object in Excel, right-click the object and select Refresh in the menu.

Refresh all objects
To refresh all objects connected to a Power BI semantic model, use either of these options:
Select the Data tab in Excel, select Refresh All > Refresh.
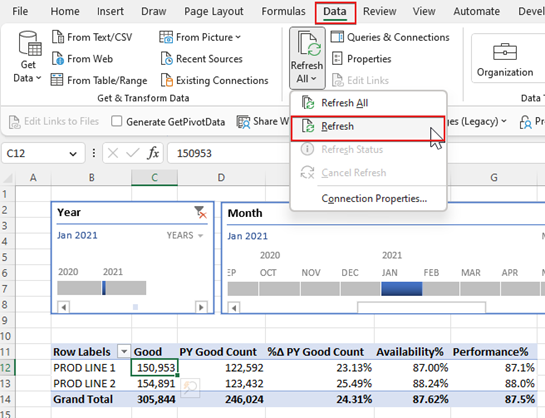
Note
If you have other connections in your Excel workbook, Refresh All will update all the data in your workbook, including Power BI data.
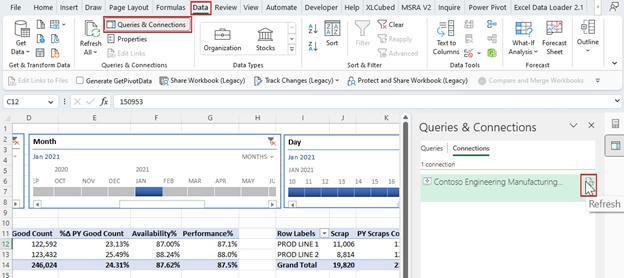
In the Excel Desktop ribbon, select Data > Queries & Connections. In the Queries & Connections pane, select Refresh.


Related content
Feedback
Coming soon: Throughout 2024 we will be phasing out GitHub Issues as the feedback mechanism for content and replacing it with a new feedback system. For more information see: https://aka.ms/ContentUserFeedback.
Submit and view feedback for