Tutorial: Embed a Power Apps visual in a Power BI report
APPLIES TO: ![]() Power BI Desktop
Power BI Desktop ![]() Power BI service
Power BI service
In this tutorial, you use the Power Apps visual to create a new app that is embedded in a sample Power BI report. This app interacts with other visuals in that report.
If you don't have a Power Apps subscription, create a free account before you begin.
In this tutorial, you learn how to:
- Add a Power Apps visual to a Power BI report
- Work in Power Apps to create a new app that uses data from the Power BI report
- View and interact with the Power Apps visual in the report
Prerequisites
- Google Chrome or Microsoft Edge browser
- A Power BI subscription, with the Opportunity Analysis Sample installed
- An understanding of how to create apps in Power Apps and how to edit Power BI reports
Create a new app
When you add the Power Apps visual to your report, it launches Power Apps Studio with a live data connection between Power Apps and Power BI.
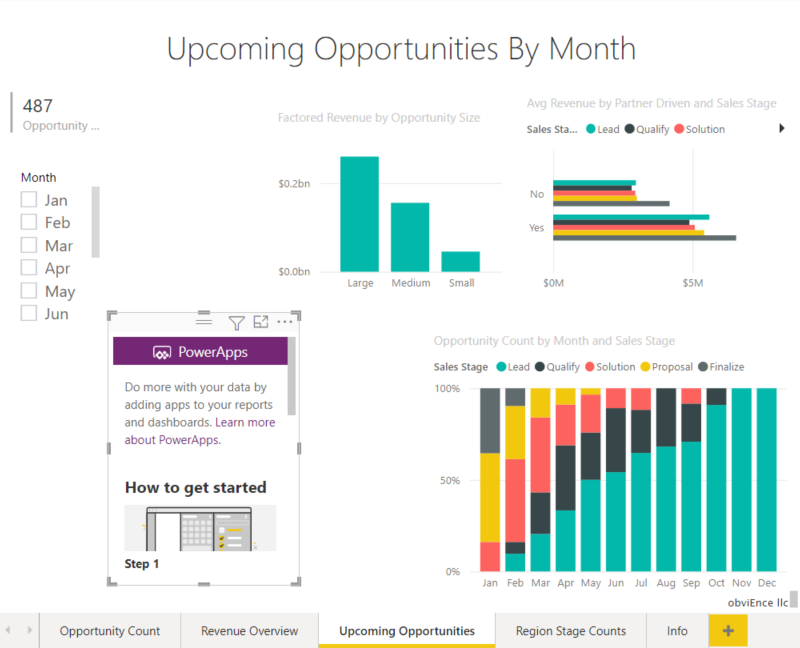
Open the Opportunity Analysis sample report and select the Upcoming Opportunities page.
Open the report in Editing mode by selecting Edit from the Options bar.
Move and resize some of the report tiles to make space for the new visual.
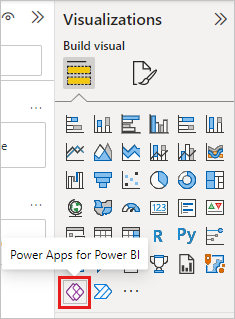
From the Visualizations pane, select the Power Apps icon, then resize the visual to fit the space you made.
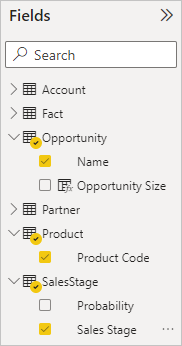
In the Fields pane, select Opportunity > Name, Product > Product Code, and SalesStage > Sales Stage.
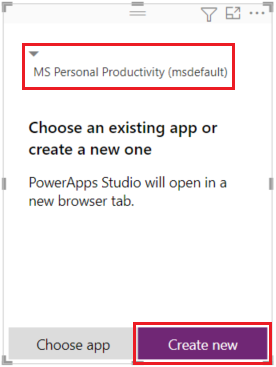
On the Power Apps visual, select the Power Apps environment where you want to create the app, then select Create new.
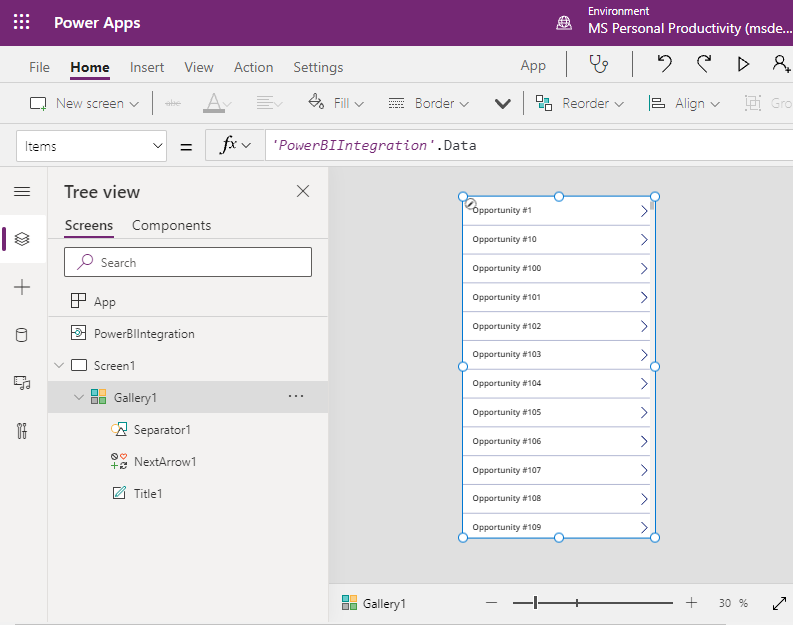
In Power Apps Studio, you see that a basic app is created, with a gallery that shows one of the fields you selected in Power BI.
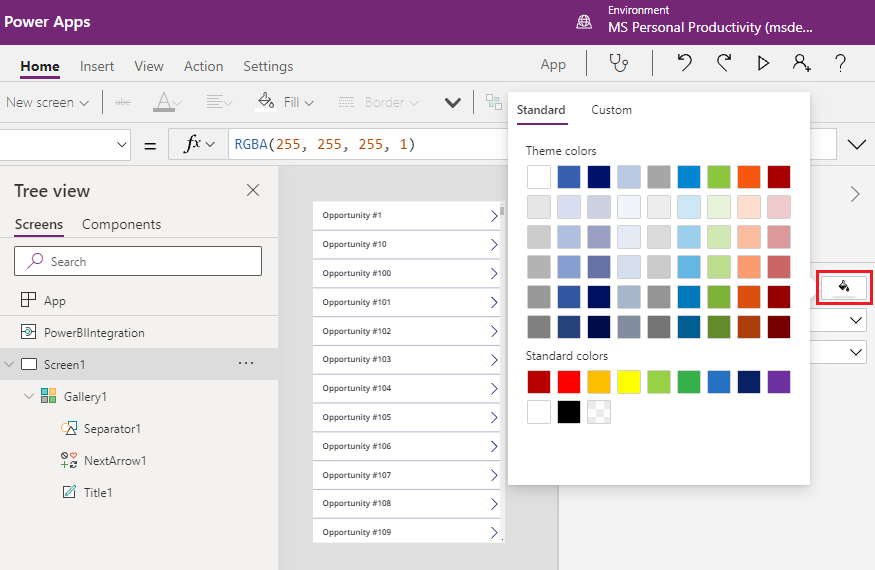
In the left pane, select Screen1, then set the screen's Fill property to "LightBlue" (so it shows up better in the report).
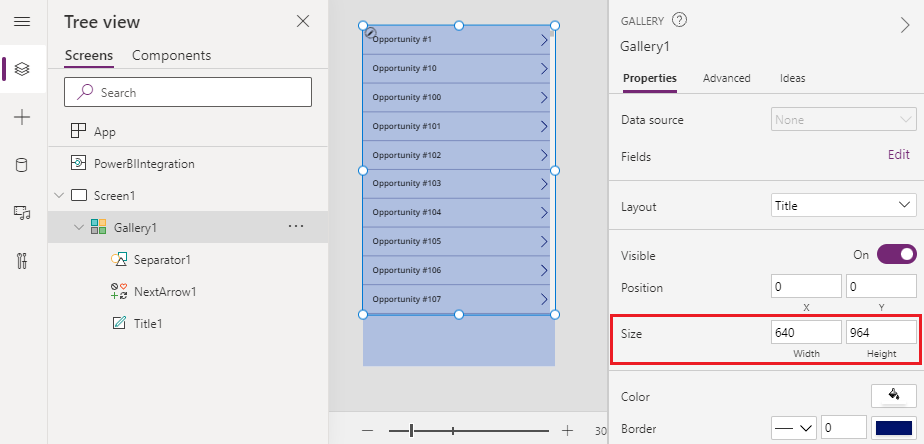
Select Gallery1 and make some room for a label control by changing Properties > Size > Height to 964.
Note
If you can't edit the Height field, try adjusting the size of the visual on the canvas first. Select the visual and drag one of the handles. Now edit the Height field.
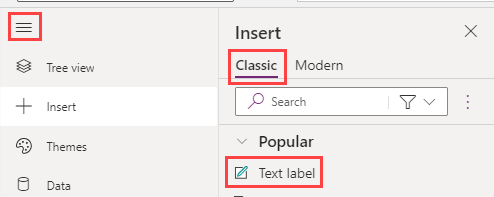
Expand the left navigation menu, choose + Insert, and select Classic > Text label from the list of controls.
Drag the label to the bottom of your visual. Set the Text property to
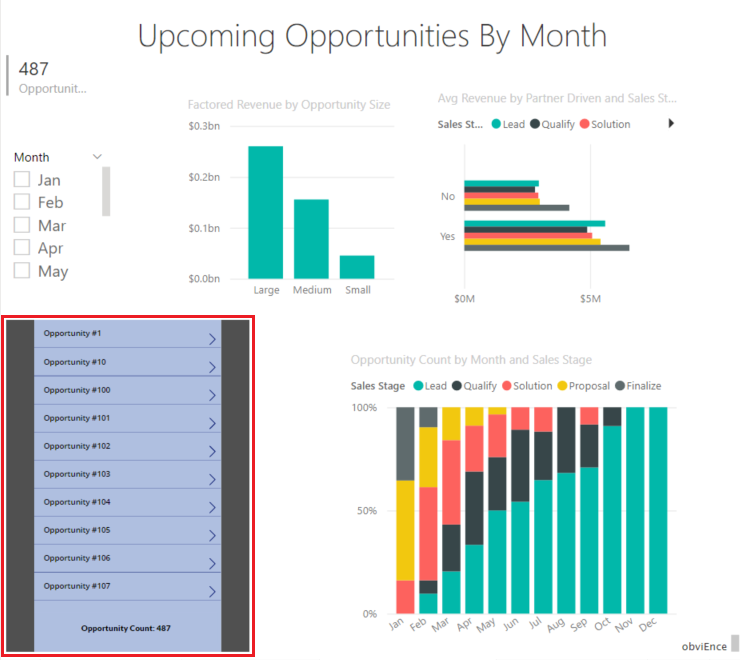
"Opportunity Count: " & CountRows(Gallery1.AllItems). The visual on the canvas now shows a total of 487 opportunities in the dataset.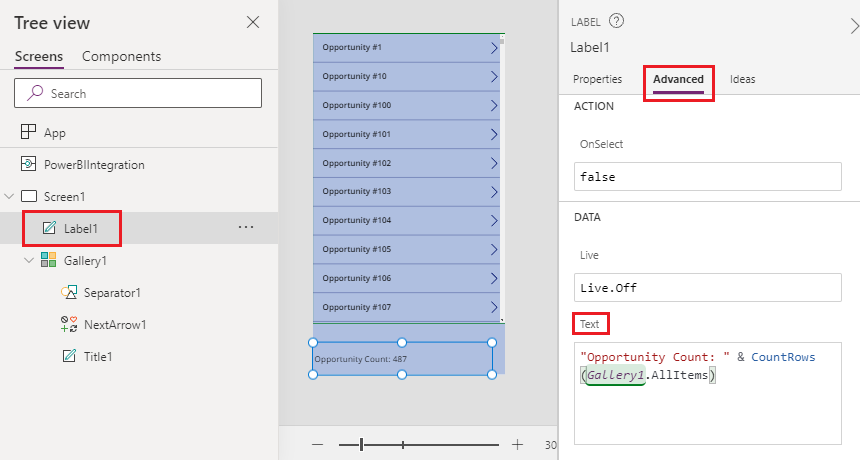
Select the Save icon from the upper right corner. Save the app with the name "Opportunities App".
View the app in the report
The app is now available in the Power BI report, and it interacts with other visuals because it shares the same data source.
In the Power BI report, select Jan in the slicer. This filters the whole report, including the data in the Power Apps visual.
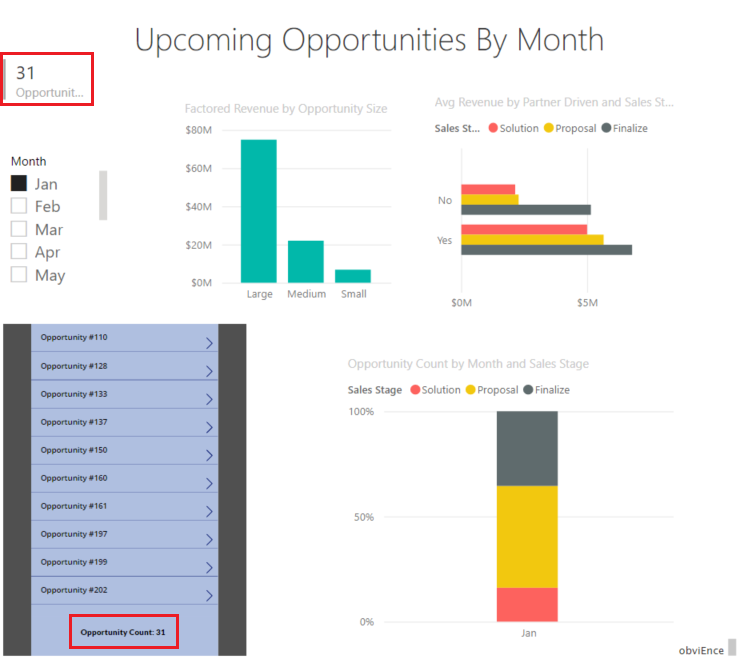
Notice that the updated opportunity count in the Power App visual matches the count in the upper left of the report. You can select other items in the report, and the data in the app updates.
Clean up resources
If you don't want to save the Opportunity Analysis sample with the Power Apps visual, delete the dashboard, report, and semantic model.
Considerations and limitations
For troubleshooting information, see Power Apps visual for Power BI.
Related content
Feedback
Coming soon: Throughout 2024 we will be phasing out GitHub Issues as the feedback mechanism for content and replacing it with a new feedback system. For more information see: https://aka.ms/ContentUserFeedback.
Submit and view feedback for