Monitoring for Azure VMs
In this unit, you explore Azure monitoring capabilities for VMs, and the types of monitoring data you can collect and analyze with Azure Monitor. Azure Monitor is a comprehensive monitoring solution for collecting, analyzing, and responding to monitoring data from Azure and non-Azure resources, including VMs. Azure Monitor has two main monitoring features: Azure Monitor Metrics and Azure Monitor Logs.
Metrics are numerical values collected at predetermined intervals to describe some aspect of a system. Metrics can measure VM performance, resource utilization, error counts, user responses, or any other aspect of the system that you can quantify. Azure Monitor Metrics automatically monitors a predefined set of metrics for every Azure VM, and retains the data for 93 days with some exceptions.
Logs are recorded system events that contain a timestamp and different types of structured or free-form data. Azure automatically records activity logs for all Azure resources. This data is available at the resource level. Azure Monitor doesn't collect logs by default, but you can configure Azure Monitor Logs to collect from any Azure resource. Azure Monitor Logs stores log data in a Log Analytics workspace for querying and analysis.
VM monitoring layers
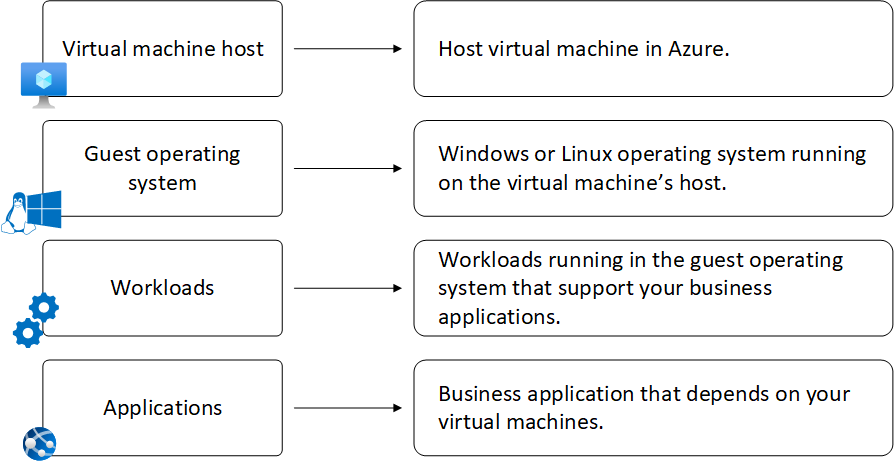
Azure VMs have several layers that require monitoring. Each of the following layers has a distinct set of telemetry and monitoring requirements.
- Host VM
- Guest operating system (OS)
- Client workloads
- Applications that run on the VM
Host VM monitoring
The VM host represents the compute, storage, and network resources that Azure allocates to the VM.
VM host metrics
VM host metrics measure technical aspects of the VM such as processor utilization and whether the machine is running. You can use VM host metrics to:
- Trigger an alert when your VM is reaching its disk or CPU limits.
- Identify trends or patterns.
- Control your operational costs by sizing VMs according to usage and demand.
Azure automatically collects basic metrics for VM hosts. On the VM's Overview page in the Azure portal, you can see built-in graphs for the following important VM host metrics.
- VM availability
- CPU usage percentage (average)
- OS disk usage (total)
- Network operations (total)
- Disk operations per second (average)
You can use Azure Monitor Metrics Explorer to plot more metrics graphs, investigate changes, and visually correlate metrics trends for your VMs. With Metrics Explorer you can:
- Plot multiple metrics on a graph to see how much traffic hits your VM and how the VM performs.
- Track the same metric over multiple VMs in a resource group or other scope, and use splitting to show each VM on the graph.
- Select flexible time ranges and granularity.
- Specify many other settings such as chart type and value ranges.
- Send graphs to workbooks or pin them to dashboards for quickly viewing health and performance.
- Group metrics by time intervals, geographic regions, server clusters, or application components.

Recommended alert rules
Alerts proactively notify you of specified occurrences and patterns in your VM host metrics. Recommended alert rules are a predefined set of alert rules based on commonly monitored host metrics. These rules define recommended CPU, memory, disk, and network usage levels to alert on, as well as VM availability, which alerts you when the VM stops running.
You can quickly enable and configure recommended alert rules when you create an Azure VM, or afterwards from the VM's portal page. You can also view, configure, and create custom alerts by using Azure Monitor Alerts.
Activity logs
Azure Monitor automatically records and displays activity logs for Azure VMs. Activity logs include information like VM startup or modifications. You can create diagnostic settings to send activity logs to the following destinations:
- Azure Monitor Logs, for more complex querying and alerting and for longer retention up to two years.
- Azure Storage, for cheaper, long-term archiving.
- Azure Event Hubs, to forward outside of Azure.
Boot diagnostics
Boot diagnostics are host logs you can use to help troubleshoot boot issues with your VMs. You can enable boot diagnostics by default when you create a VM, or afterwards for existing VMs.
Once you enable boot diagnostics, you can see screenshots from the VM's hypervisor for both Windows and Linux machines, and view the serial console log output of the VM boot sequence for Linux machines. Boot diagnostics stores data in a managed storage account.
Guest OS, client workload, and application monitoring
VM client monitoring can include monitoring the operating system (OS), workloads, and applications that run on the VM. To collect metrics and logs from guest OS and client workloads and applications, you need to install Azure Monitor Agent and set up a data collection rule (DCR).
DCRs define what data to collect and where to send that data. You can use a DCR to send Azure Monitor metrics data, or performance counters, to Azure Monitor Logs or Azure Monitor Metrics. Or, you can send event log data to Azure Monitor Logs. In other words, Azure Monitor Metrics can store only metrics data, but Azure Monitor Logs can store both metrics and event logs.
VM insights
VM insights is an Azure Monitor feature that helps get you started monitoring your VM clients. VM insights is especially useful for exploring overall VM usage and performance when you don't yet know the metric of primary interest. VM insights provides:
- Simplified Azure Monitor Agent onboarding to enable monitoring a VM's guest OS and workloads.
- A preconfigured DCR that monitors and collects the most common performance counters for Windows and Linux.
- Predefined trending performance metrics charts and workbooks from the VM's guest OS.
- A set of predefined workbooks that show collected VM client metrics over time.
- Optionally, collection of processes running on the VM, dependencies with other services, and a dependency map that displays interconnected components with other VMs and external sources.
Predefined VM insights workbooks show performance, connections, active ports, traffic, and other collected data from one or several VMs. You can view VM insights data directly from a single VM, or see a combined view of multiple VMs to view and assess trends and patterns across VMs. You can edit the prebuilt workbook configurations or create your own custom workbooks.
Client event log data
VM insights creates a DCR that collects a specific set of performance counters. To collect other data, such as event logs, you can create a separate DCR that specifies the data you want to collect from the VM and where to send it. Azure Monitor stores collected log data in a Log Analytics workspace, where you can access and analyze the data by using log queries written in Kusto Query Language (KQL).